

vk.com/id446425943
4 December 2018 | 6:17PM EST
Credit Outlook
Insights into 2019
Top trades in High Yield for 2019
Ahead of 2019, we provide our top trades in single name credit across the high yield market. Following recent market volatility, we believe investors have become increasingly better positioned to identify single name opportunities - from both the long and short side - to generate alpha in 2019. Specifically, we have identified 22 trade ideas across eight core themes including (1) event driven ideas (M&A, asset sales); (2) debt redemption driven ideas; (3) traditional relative value; (4) crossover/ratings upgrades; (5) mis-priced cyclical risk; (6) mis-priced secular risk; (7) non-consensus fundamental views; and (8) deep value plays. Our top trades for high yield are as follows:
Exhibit 1: Top high yield trades for 2019
Event-driven |
Debt Redemption |
Traditional Relative Value |
Crossover / Rating Upgrades |
|
(M&A, asset sales) |
||||
|
|
|
||
Intelsat: Buy INTEL Jackson 2025s |
Ardagh: Buy ARDFIN 7.125% |
Caesar's: Swap into CGPHLC |
HCA: Buy HCA 2047 secureds |
|
2023s |
2025s from WYNNLV 2025s |
|||
|
|
|||
|
|
|
|
|
Navistar: Buy NAV 2025s |
First Quantum: Buy FMCN 2022s |
United Rentals: Swap out of CAR |
-- |
|
|
|
2023s into URI 2023s |
|
|
|
|
|
|
|
-- |
Tenet Healthcare: Buy THC 2031s |
-- |
-- |
|
|
|
|
|
Mispriced cyclical risk |
Mispriced secular risk |
Out-of-consensus fundamentals |
Deep value |
|
American Axle: Swap out of GT |
Hertz: Sell HTZ 2022 2L notes |
Dish: Buy DISH DBS 2026s |
Frontier: Buy FTR 2022s (CTF) and |
|
2023s into AXL 2022s |
FTR 2023s (Legacy) |
|||
|
|
|||
|
|
|
|
|
Lennar: Buy LEN 4.75% due 2027 |
L Brands: Swap out of SBH 25s |
Rackspace: Buy RAX 2024s or RAX |
J.C. Penney: Swap out of RAD 23s |
|
vs. Sell LEN 4.125% due 2022 |
into LB 28s |
TLB |
into JCP 23s |
|
|
|
|
|
|
SM Energy: Buy SM 2025s |
Univision: Sell UVN 2025s |
Toll Brothers: Buy TOL 4.35% due |
Wynn Macau: Buy WYNMAC |
|
2028 vs. Sell LEN 4.75% due 2027 |
2024s |
|||
|
|
|||
|
|
|
|
|
WPX Energy: Buy WPX 2024s |
US Steel: Buy X 2025s |
Tronox: Buy the TROX 2025s |
-- |
|
|
|
|
|
Franklin Jarman
+1(212)902-7537 | franklin.jarman@gs.com Goldman Sachs & Co. LLC
Jason Kim
+1(212)902-2233 | jason.kim@gs.com Goldman Sachs & Co. LLC
Karl Blunden, CFA
+1(212)357-2769 | karl.blunden@gs.com Goldman Sachs & Co. LLC
Source: Goldman Sachs Global Investment Research
For Reg AC certification and other important disclosures, see the Disclosure Appendix, or go to www.gs.com/research/hedge.html. This document is intended for institutional investors and is not subject to all of the independence and disclosure standards applicable to debt research reports prepared for retail investors. Goldman Sachs trades the securities covered in this report for its own account and on a discretionary basis on behalf of certain clients. Such trading interests may be contrary to the recommendation(s) offered in this report.

vk.com/id446425943
Goldman Sachs
Table of Contents
Credit Outlook
Autos: Komal Patel |
7 |
|
|
Cable & Satellite: Jason Kim |
11 |
|
|
Chemicals: Karl Blunden |
15 |
|
|
Energy: Jason Gilbert |
18 |
|
|
Gaming: Komal Patel |
26 |
|
|
Healthcare Facilities: Franklin Jarman |
31 |
|
|
Homebuilders: Kwaku Abrokwah |
35 |
|
|
Media: Jason Kim |
39 |
|
|
Metals & Mining: Karl Blunden |
42 |
|
|
Packaging: Karl Blunden |
46 |
|
|
Retail: Jenna Giannelli |
49 |
|
|
Services: Komal Patel |
54 |
|
|
Technology: Franklin Jarman |
59 |
|
|
Telecom (Wireless & Wireline): Jason Kim |
64 |
|
|
Disclosure Appendix |
68 |
|
|
4 December 2018 |
2 |

vk.com/id446425943
Goldman Sachs
Credit Outlook
Insights into 2019
GS Credit Strategy: Forecasts for 2019
On Nov 20, our Credit Strategy team led by Lotfi Karoui published their 2019 outlook “Global Credit Outlook 2019: From challenging to difficult.” At a high level, they are calling for spreads to drift wider over the next two quarters as (1) late-cycle profitability headwinds, (2) a less-friendly macro backdrop, and (3) the return of “cash” as an investable asset class greatly limit the scope for spreads to revert to their recent range. As a result, they are targeting spreads to widen by 80bp from current levels to ~500bp over the course of next year.
To be clear, our Credit Strategy team is not calling for a recession in the near-term and still expects the default rate to stay below 3%. Furthermore, they believe that HY primary supply will continue to decline in 2019 which should provide a needed offset to continued weakness of funds flows. When coupled with our macro team’s forecast for the US Treasury yields to move up to 3.5% at the 10yr point, the high yield market could be set up to end 2019 at an average yield of 8.0-8.5%. All in, this leaves the burden on investors to identify more compelling return opportunities down at a single name level.
Exhibit 2: GS Strategy sees HY spreads drifting wider to 500bp by |
Exhibit 3: Expect the default environment will likely remain benign |
YE2019 |
|
|
|
|
|
bp |
|
|
|
|
|
950 |
|
|
|
|
300 |
850 |
|
|
|
|
250 |
|
|
|
|
|
|
750 |
|
|
|
|
|
650 |
|
|
|
|
200 |
|
|
|
|
|
|
550 |
|
|
|
|
150 |
|
|
|
|
|
|
450 |
|
|
|
|
|
350 |
|
|
|
|
100 |
|
|
|
|
|
|
250 |
|
|
|
|
50 |
2010 |
2012 |
2014 |
2016 |
2018 |
2020 |
Source: BAML, The Yield Book Inc., Goldman Sachs Global Investment Research |
Source: Moody’s, S&P Capital IQ LCD, Goldman Sachs Global Investment Research |
So how did we get here?
For much of 2018, high yield market returns could best be characterized by their low volatility … whether compared to concurrent moves in the equity market or by historical standards. Several factors played a part in keeping spread volatility low. New issue volumes in US HY, for one, have trended down ~33% YTD, leading investors to meet market moves lower with buying programs. And while Treasury rates did indeed move wider for most of this year, rate volatility has recently remained in check until September (see Exhibit 4). From a fundamental standpoint, default rates have also remained low, in the 3% range, and US macro growth positive (albeit slowing).
4 December 2018 |
3 |

vk.com/id446425943
Goldman Sachs
Credit Outlook
Exhibit 4: HY spreads widened in 4Q as Treasury vol rose |
|
Exhibit 5: Best performing credit asset class at one point, CCCs |
|||||||||
|
|
|
|
|
|
have lost 95% of their gains in 4Q18 |
|
|
|
||
|
|
|
|
|
|
Cumulative total returns: BBs vs CCCs |
|
|
|
||
6.5 |
|
|
|
|
451 |
8% |
|
|
|
|
|
6.0 |
|
|
|
|
429 |
6% |
|
|
|
|
|
|
|
|
|
|
|
|
|
|
|
|
|
5.5 |
|
|
|
|
407 |
4% |
|
|
|
|
|
5.0 |
|
|
|
|
385 |
|
|
|
|
|
|
|
|
|
|
|
|
|
4Q reversal |
|
|||
|
|
|
|
|
|
2% |
|
|
|
||
4.5 |
|
|
|
|
363 |
|
|
|
|
|
|
|
|
|
|
|
|
|
|
|
|
||
4.0 |
|
|
|
|
341 |
0% |
|
|
|
|
|
3.5 |
|
|
|
|
319 |
-2% |
|
|
|
|
|
|
|
|
|
|
|
|
|
|
|
|
|
3.0 |
|
|
|
|
297 |
-4% |
|
|
|
|
|
|
|
|
|
|
|
|
|
|
|
|
|
2.5 |
|
|
|
|
275 |
Jan-18 |
Mar-18 |
May-18 |
Jul-18 |
Sep-18 |
Nov-18 |
Jul-18 |
Aug-18 |
Sep-18 |
Oct-18 |
Nov-18 |
Dec-18 |
|
|
BB Index |
CCC Index |
|
|
|
|
TYVIX |
HY OAS (bp; RHS) |
|
|
|
|
|
|
||
|
|
|
|
|
|
|
|
|
|
||
Source: Bloomberg, Goldman Sachs Global Investment Research |
|
|
Source: Bloomberg, Goldman Sachs Global Investment Research |
|
|
||||||
October brought a reversal of fortunes in HY: For much of 2018, investors were left with a difficult choice of buying beta to outperform the market. Through Sep 30, the CCC index had generated a total return of just over 6%, well ahead of the BB index at 0.5%. Furthermore, the sectors that delivered the highest returns were the ones typically challenged by secular operating risks, with Retail, Telecom and Hospitals at the top of the list.
Beginning in October, however, all of this changed, and in somewhat dramatic form. A confluence of events led the high yield market to finally exhibit more characteristic volatility. Since October 1, HY spreads have moved 99bp wider culminating in a 2.4x standard deviation move in weekly returns during the week before Thanksgiving. So what changed?
To start, hawkish comments out of the Fed on October 3 drove the US 10 year Treasury market to gap out to 3.22%, the highest level since May 2011. Looking ahead, our macro team expects the 10 year to leak wider but has highlighted the front end as an area of greater risk. In fact, GS economist Praveen Korapaty is currently calling for the 2s-10s US Treasury curve to invert as soon as 1Q2019 (see report), which is likely to bring investors’ focus back to the growth debate.
4 December 2018 |
4 |
vk.com/id446425943 |
|
|
|
|
|
|
|
|
|
|
|
|
|
Credit Outlook |
||||
Goldman Sachs |
|
|
|
|
|
|
|
|
|
|
|
|
|
|
|
|||
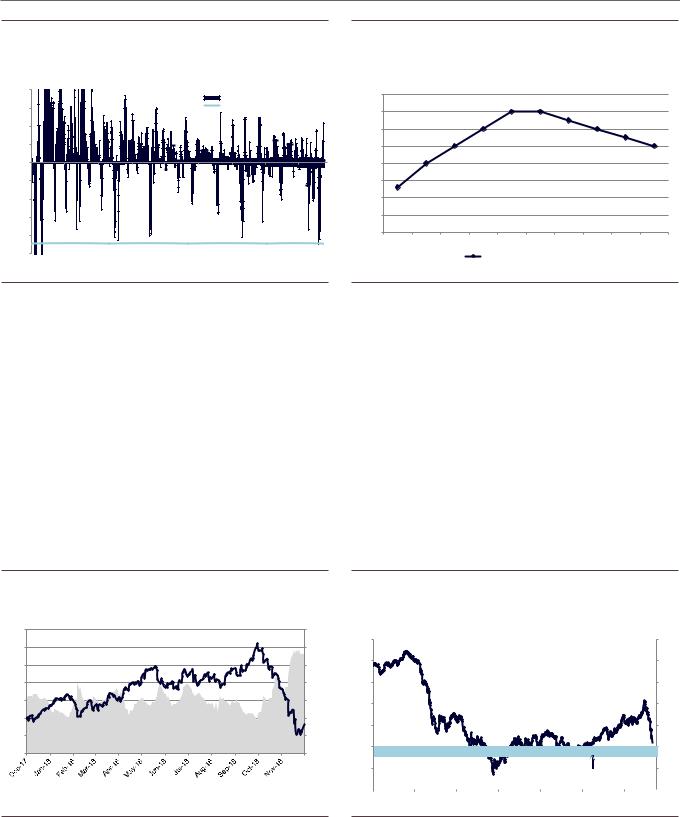
Exhibit 6: Credit saw its worst return in November, since oil prices |
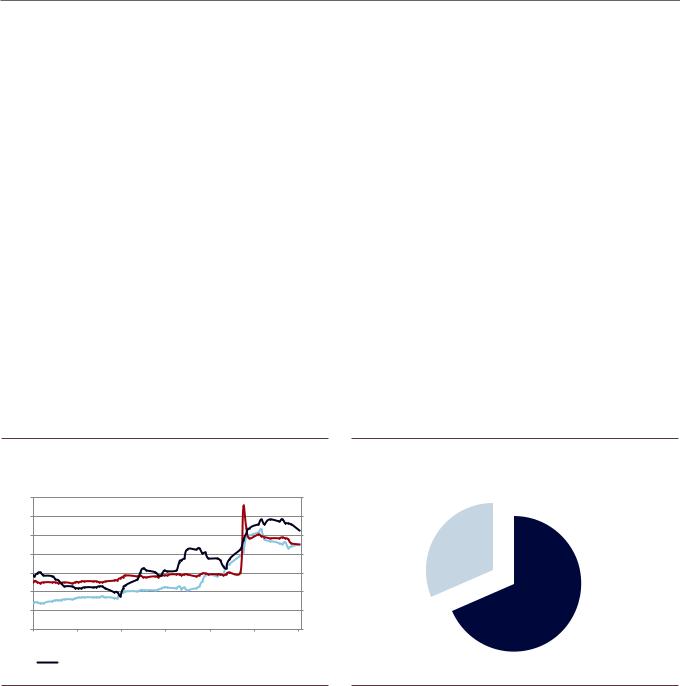
Exhibit 7: GS Macro forecasts 10Y US Treasury yields to reach 3.5% |
|||||||||||||||||
troughed in early 2016 |
|
|
|
|
|
|
in 2H2019 |
|
|
|
|
|
|
|
|
|
||
Rolling weekly US HY returns over the past 2 years |
|
|
|
|
|
|
|
|
|
|
|
|
||||||
1.40% |
|
|
|
|
|
Weekly HY credit return |
3.60% |
|
|
|
|
|
|
|
|
|
||
|
|
|
|
|
|
|
|
|
|
|
|
|
|
|
||||
|
|
|
|
|
|
|
|
|
|
|
|
|
|
|
|
|||
1.05% |
|
|
|
|
|
Nov 15th |
|
|
3.50% |
|
|
|
|
|
|
|
|
|
|
|
|
|
|
|
|
|
|
|
|
|
|
|
|
|
|
|
|
0.70% |
|
|
|
|
|
|
|
|
3.40% |
|
|
|
|
|
|
|
|
|
|
|
|
|
|
|
|
|
|
|
|
|
|
|
|
|
|
|
|
0.35% |
|
|
|
|
|
|
|
|
3.30% |
|
|
|
|
|
|
|
|
|
0.00% |
|
|
|
|
|
|
|
|
3.20% |
|
|
|
|
|
|
|
|
|
-0.35% |
|
|
|
|
|
|
|
|
3.10% |
|
|
|
|
|
|
|
|
|
-0.70% |
|
|
|
|
|
|
|
|
3.00% |
|
|
|
|
|
|
|
|
|
-1.05% |
|
|
|
|
|
|
|
|
2.90% |
|
|
|
|
|
|
|
|
|
-1.40% |
|
|
|
|
|
|
|
|
2.80% |
|
|
|
|
|
|
|
|
|
|
|
|
|
|
|
|
|
Spot |
4Q18 |
1Q19 |
2Q19 |
3Q19 |
4Q19 |
1Q20 |
2Q20 |
3Q20 |
4Q20 |
|
|
|
|
|
|
|
|
|
|
||||||||||
-1.75% |
May-16 |
Sep-16 |
Jan-17 |
May-17 |
Sep-17 |
Jan-18 |
May-18 |
Sep-18 |
|
|
|
10-Year US Treasury Yield |
|
|
|
|||
Jan-16 |
|
|
|
|
|
|
|
|
|
|
||||||||
Source: Datastream, Goldman Sachs Global Investment Research |
Source: Goldman Sachs Global Investment Research |
WTI shares some blame (not surprisingly): At the same time, energy prices began to move steadily lower and at $50/bl, they are now 33% below their local high on September 30. While energy is a smaller component of high yield than it was in 2016, it is still by far the largest sector in the market at 16% of the index. With this move in WTI, the energy sector has traded 30bp wider since October 1 with higher beta CCC credits like Weatherford, EP Energy and Sanchez down 5-15 points.
To be clear, GS HY Energy analyst Jason Gilbert believes the sector is currently 50bp cheap based on the correlation between production margins and high yield spreads. At a single name level, he views WPX Energy (OP; -5% since 10/1) and SM Energy (OP; -5%) as attractive “mid-quality” picks. For higher beta bonds, Halcon Resources (IL) has underperformed (-11%) despite a recent asset sale and having 90% of 2019E oil production hedged at $56.
Exhibit 8: WTI sell-off coincides with sharp HY widening |
Exhibit 9: Oil has moved to fundamental support levels |
WTI crude price vs low cost shale band (USD/bbl)
$80 |
460 |
$/bbl |
WTI 18 month contract |
$/bbl |
|
100 |
|||||
$75 |
430 |
100 |
|
||
|
|
|
|||
$70 |
400 |
90 |
|
90 |
|
|
|
|
|||
$65 |
370 |
80 |
|
80 |
|
$60 |
340 |
70 |
|
70 |
|
|
|
|
|||
$55 |
310 |
60 |
|
60 |
|
|
|
|
|||
$50 |
280 |
|
|
|
|
$45 |
250 |
50 |
|
50 |
|
|
|
|
|||
|
|
40 |
|
40 |
Low cost US shale suppy
|
HY Index OAS (RHS; bp) |
|
WTI Oil Futures ($/bbl) |
30 |
|
|
|
|
|
|
|
30 |
|
|
|
|
Nov 13 |
Aug 14 |
May 15 |
Feb 16 |
Nov 16 |
Aug 17 |
May 18 |
||
Source: Bloomberg, Goldman Sachs Global Investment Research Source: Goldman Sachs Global Investment Research
Secondary market liquidity also in focus: Finally, we think several idiosyncratic moves in the investment grade market have reminded credit investors that secondary market clearing mechanisms remain far from perfect. Since October, General Electric bonds have traded down ~20 points as investors became concerned that it may lose IG
4 December 2018 |
5 |
vk.com/id446425943
Goldman Sachs
Credit Outlook
ratings. Subsequently, single-A rated utility company, PG&E, underwent similar selling pressure when it warned that it may be forced to restructure as a result of the California wild fires (see Exhibit 10).
We think these moves in IG have helped remind credit investors that a significant amount of borrowing has been done at the BBB ratings level over this cycle. As GS CIO of Americas Equity Research, Jessica Graham, recently examined in a report, there are currently $2tn of non-financial bonds rated BBB, the lowest rating across the investment grade scale. The amount has increased to 58% of the non-financial IG market over the last several years and is currently at its highest level in the last 10 years.
This is important because a turn in the cycle could result in these bonds being downgraded to high yield. Looking back to prior cycles, approximately 5% to 15% of the BBB rated bonds were downgraded to high yield. If we assume the same percentages are applied to a theoretical down-cycle today, approximately $100-300bn of debt could be at risk of falling to the high yield market in a cycle correction.
While not necessarily a near-term risk given solid sales/earnings growth and low recession risk (See The Credit Trader), it is potentially problematic given the current size of the high yield market is only $1.2tn. We think prices may need to adjust in order to generate the level of demand that would require a potential 25% increase in the size of the high yield market – especially at a time when risk appetite could be low.
Exhibit 10: As GE and PCG bonds widened, HY spreads moved wider concurrently
|
7.8 |
460.0 |
|
7.0 |
430.0 |
|
6.3 |
400.0 |
YTW% |
5.5 |
370.0 |
4.8 |
340.0 |
|
|
4.0 |
310.0 |
|
3.3 |
280.0 |
|
2.5 |
250.0 |
Sep-18 |
Sep-18 |
Oct-18 |
Oct-18 |
|
Nov-18 |
Nov-18 |
Dec-18 |
|
|
|
GE 3.375% Sr Unsec 2024s |
|
|
PCG 3.5% Sr Unsec 2024s |
|
||
|
|
|
|
|
||||
|
|
HY Index OAS (RHS; bp) |
|
|
|
|
|
|
Exhibit 11: BBB market value is more than 2x the entire HY market index value
$1,231 bn |
|
|
BBB Index |
|
|
||
|
|
|
|
|
|
|
HY Market Index |
|
|
|
|
|
|
|
|
|
$2,677 bn |
||
Source: Bloomberg, Goldman Sachs Global Investment Research |
Source: Bloomberg, Goldman Sachs Global Investment Research |
4 December 2018 |
6 |

vk.com/id446425943
Goldman Sachs
Credit Outlook
Autos: Komal Patel
Sector View:
We have a Neutral coverage view on IG Auto OEMs and a Cautious coverage view on
HY Autos/Suppliers. We generally have a bearish outlook on the sector; end of cycle concerns run high in the space, incentives remain elevated to support new vehicle sales, rising interest rates reduce vehicle affordability, tax reform related benefits to consumers lap, higher raw material costs add headwinds, and trade and tariff concerns increase volatility. However, trading levels have widened to reflect these concerns, especially in IG. IG Auto Manufacturers trade at 4.7% YTW (180bp on OAS-basis) vs. the overall IG market at 4.3% (136bp on OAS-basis), already underperforming the market by ~40bp. HY Autos/Vehicle Parts trades at 7.0%, slightly tighter than the broad HY Market at 7.2%; we see downside risk to these levels given end of cycle concerns as U.S. SAAR softening will also weigh on suppliers.
On the IG side, we see idiosyncratic differences in the performance of GM and F, as GM has outperformed since its emergence from bankruptcy and reversing the prior relative relationship with F (F was perceived more positively than GM post-crisis). However, F’s wider trading levels are an opportunity, in our view, to be more constructive as the company launches new vehicles amidst an aging portfolio, executes on cost savings plans, and undertakes restructuring activities with its substantial liquidity as a buffer.
In HY, we note that suppliers are closely tied to changes in the auto cycle, though differences in businesses/products drive divergence in performance. GT has a large replacement business to complement its OEM business, but we remain cautious due to continued pressure from higher commodity costs, stepped up competition, and shareholder friendly tendencies. AXL is predominantly an OEM-focused business and is thus subject to declines in U.S. SAAR, but its ability to pass through raw material costs and focus on deleveraging keeps us comfortable in the near term during which we expect U.S. SAAR to decline only moderately. In Class 8 trucks, we see an additional ~12 months of runway; we think NAV’s partnership with VW provides some downside protection to cycle risks and MTOR’s balance sheet is in much better shape than the previous cycle.
Our top trade ideas in the sector are to (1) Buy the NAV 2025s (on our Credit Conviction List), and (2) Swap out of the GT 2023s and into the AXL 2022s. We discuss these ideas in further detail below.
4 December 2018 |
7 |
vk.com/id446425943
Goldman Sachs
Credit Outlook
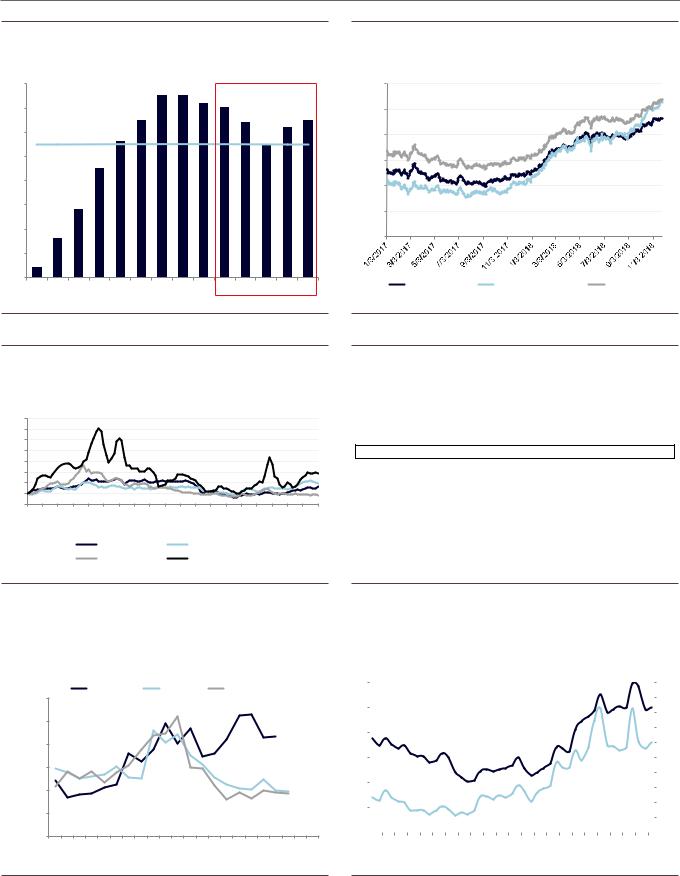
Exhibit 12: US SAAR is past the peak |
|
|
Exhibit 13: IG Auto OEMs have underperformed relative to the |
||||
|
|
|
|
|
broader market this year |
|
|
18.0 |
17.5 |
17.5 |
|
|
5.00% |
|
|
17.0 |
|
17.2 |
17.0 |
|
4.50% |
|
|
16.5 |
|
16.4 |
16.5 |
|
|
||
|
|
|
|
|
|||
|
|
|
|
16.2 |
|
|
|
16.0 |
15.6 |
|
|
15.5 |
4.00% |
|
|
|
|
|
|
|
|||
15.0 |
14.5 |
|
|
|
3.50% |
|
|
|
|
|
|
|
|
||
14.0 |
|
|
|
|
3.00% |
|
|
|
|
|
|
|
|
|
|
13.0 |
12.8 |
|
|
|
2.50% |
|
|
|
|
|
|
|
|
||
|
|
|
|
|
|
|
|
12.0 |
11.6 |
|
|
|
2.00% |
|
|
|
|
|
|
|
|
|
|
11.0 |
|
|
|
|
|
|
|
10.4 |
|
|
|
|
|
|
|
10.0 |
|
|
|
|
IG Broad Market |
IG Auto Manufacturers |
BBB Index |
2009 |
2010 2011 2012 2013 2014 2015 |
2016 2017 |
2018E 2019E 2020E 2021E 2022E |
||||
Source: Goldman Sachs Global Investment Research, IHS
Exhibit 14: Sharp increases in oil, steel, and butadiene have negatively impacted tire manufacturers
800 |
|
|
|
|
|
|
|
|
|
|
|
|
|
|
700 |
|
|
|
|
|
|
|
|
|
|
|
|
|
|
600 |
|
|
|
|
|
|
|
|
|
|
|
|
|
|
500 |
|
|
|
|
|
|
|
|
|
|
|
|
|
|
400 |
|
|
|
|
|
|
|
|
|
|
|
|
|
|
300 |
|
|
|
|
|
|
|
|
|
|
|
|
|
|
200 |
|
|
|
|
|
|
|
|
|
|
|
|
|
|
100 |
|
|
|
|
|
|
|
|
|
|
|
|
|
|
0 |
|
|
|
|
Oct-11 Apr-12 Oct-12 |
|
|
|
|
Oct-16 |
Apr-17 |
|
|
|
Apr-09 |
Oct-09 |
Apr-10 |
Oct-10 |
Apr-11 |
Apr-13 |
Oct-13 |
Apr-14 |
Oct-14 Apr-15 Oct-15 Apr-16 |
Oct-17 |
Apr-18 |
Oct-18 |
|||
|
|
|
|
|
Indexed oil |
|
|
|
Indexed steel |
|
|
|
|
|
|
|
|
|
|
Indexed rubber |
|
|
Indexed Butadiene |
|
|
|
|
||
Source: Goldman Sachs Global Investment Research, The Yield Book, FTSE Index
Exhibit 15: HVA tire market to see softer utilization as capacity growth outpaces demand
High value-add light vehicle tire supply/demand analysis (mn)
HVA tires |
2013 |
2014 |
2015 |
2016 |
2017 |
2018E |
2019E |
2020E |
Global HVA demand |
306.1 |
333.8 |
358.1 |
385.9 |
406.2 |
431.3 |
456.2 |
479.7 |
Global HVA capacity |
340.1 |
353.2 |
372.2 |
401.3 |
445.5 |
483.6 |
534.7 |
559.2 |
Capacity utilization |
90.0% |
94.5% |
96.2% |
96.2% |
91.2% |
89.2% |
85.3% |
85.8% |
Source: Goldman Sachs Global Investment Research, FactSet, Steel Business Briefing, |
|
Source: Company data, Goldman Sachs Global Investment Research |
Malaysian Rubber Exchange, Chemical Data |
|
|
|
|
|
Exhibit 16: This Class 8 cycle has run longer than previous ones |
|
Exhibit 17: Spot rates have moved down with utilization in recent |
|
|
months, a leading indicator for a potential cycle turn |
|
|
|
|
Current Cycle |
|
|
2014 Cycle |
|
|
2006 Cycle |
|
|
|
12 |
||||||||
|
60,000 |
|
|
|
|
|
|
|
|
|
|
|||||||||||
|
|
|
|
|
|
|
|
|
|
|
|
|
|
|
|
|
|
|
|
|
10 |
|
|
|
|
|
|
|
|
|
|
|
|
|
|
|
|
|
|
|
|
|
|
|
|
Orders |
50,000 |
|
|
|
|
|
|
|
|
|
|
|
|
|
|
|
|
|
|
|
|
|
|
|
|
|
|
|
|
|
|
|
|
|
|
|
|
|
|
|
|
|
|
8 |
|
40,000 |
|
|
|
|
|
|
|
|
|
|
|
|
|
|
|
|
|
|
|
|
|
|
Truck |
30,000 |
|
|
|
|
|
|
|
|
|
|
|
|
|
|
|
|
|
|
|
|
6 |
|
|
|
|
|
|
|
|
|
|
|
|
|
|
|
|
|
|
|
|
|
||
Monthly |
20,000 |
|
|
|
|
|
|
|
|
|
|
|
|
|
|
|
|
|
|
|
|
4 |
|
|
|
|
|
|
|
|
|
|
|
|
|
|
|
|
|
|
|
|
|
||
|
|
|
|
|
|
|
|
|
|
|
|
|
|
|
|
|
|
|
|
|
|
|
|
10,000 |
|
|
|
|
|
|
|
|
|
|
|
|
|
|
|
|
|
|
|
|
2 |
|
|
|
|
|
|
|
|
|
|
|
|
|
|
|
|
|
|
|
|
|
|
|
|
0 |
|
|
|
|
|
|
|
|
|
|
|
|
|
|
|
|
|
|
|
|
0 |
|
1 |
2 |
3 |
4 |
5 |
6 |
7 |
8 |
9 |
10 |
11 |
12 |
13 |
14 |
15 |
16 |
17 |
18 |
19 |
20 |
21 |
22 |
# months
|
|
|
Load-to-truck ratio (lhs) |
|
Trucker spot rates (rhs) |
$2.0 |
|
|
|
|
|
|
|
$1.9 |
|
|
|
|
|
|
|
$1.8 |
|
|
|
|
|
|
|
$1.7 |
|
|
|
|
|
|
|
$1.6 |
|
|
|
|
|
|
|
$1.5 |
|
|
|
|
|
|
|
$1.4 |
|
|
|
|
|
|
|
$1.3 |
|
|
|
|
|
|
|
$1.2 |
|
|
|
|
|
|
|
$1.1 |
|
|
|
|
|
|
|
|
$1.0 |
Jan-15 Mar-15 May-15 Jul-15 Sep-15 Nov-15 Jan-16 Mar-16 May-16 Jul-16 Sep-16 Nov-16 Jan-17 Mar-17 |
May-17 Jul-17 Sep-17 Nov-17 Jan-18 Mar-18 May-18 Jul-18 Sep-18 |
|
|||||
|
|
||||||
Source: Goldman Sachs Global Investment Research, ACT Research |
Source: Goldman Sachs Global Investment Research, DAT |
4 December 2018 |
8 |

vk.com/id446425943
Goldman Sachs
Best ideas
Credit Outlook
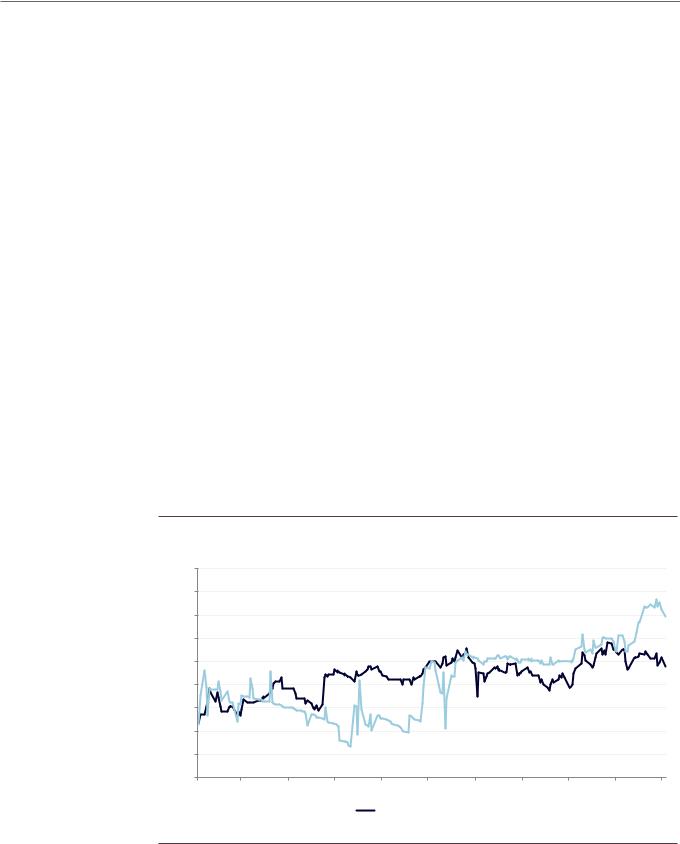
Trade idea #1: Buy NAV 6.625% 2025s (on the Conviction List). The NAV 2025s widened ~75bps in the last month, versus the HY Market and Autos/Vehicle Parts Index which widened ~30bps and ~40bps respectively. We believe the underperformance in NAV was driven by MTOR 4Q18 results; while MTOR reported a solid 4Q, its FY19 guidance for revenue, EBITDA, and FCF came in below Bloomberg consensus estimates. We think this guidance raised some concerns about the Class 8 cycle heading into 2019, and drove weakness in the credit and equity of sector peers such as NAV. However, as freight rates and orders remain strong we see continued runway for NAV in 2019, and forecast topline and EBITDA growth as well as positive FCF generation. Although there are risks of the truck cycle turning, we see a window (though potentially short) for continued strength into 2019.
Additionally, the VW ownership stake and partnership, in our view, provides a valuable backstop for the NAV 2025s. When VW first announced that it was acquiring a 16.6% stake in Navistar back in Sep 2016, NAV bonds rallied 17 points and have been range-bound since. There are also press reports (e.g., Reuters) that Traton Group (VW’s Truck & Bus segment) could acquire all of NAV once it is spun-off in 2019/2020. While we take no view on the possibility of an acquisition, we think it could provide a potential 7-8% return if investors exercise the 101 CoC put on the NAV 2025s, and a 9-22% return if the bonds are made-whole as part of any transaction. Even if NAV isn’t acquired, we continue to see the partnership driving synergies from product innovation and manufacturing efficiencies. Given our positive near-term growth outlook, the backstop from the VW stake, and ratings upside (positive outlook at all three agencies), we see attractive risk/reward in the NAV 2025s which are also on the Credit Conviction List.
Risks to our view: Downside: VW decreases stake or distances from full acquisition, Inability to deleverage, loss of Class 8 market share.
Exhibit 18: The NAV 2025s have widened this month
7.50% |
|
|
|
|
|
|
|
|
|
|
7.00% |
|
|
|
|
|
|
|
|
|
|
6.50% |
|
|
|
|
|
|
|
|
|
|
6.00% |
|
|
|
|
|
|
|
|
|
|
5.50% |
|
|
|
|
|
|
|
|
|
|
11/1 |
11/4 |
11/7 |
11/10 |
11/13 |
11/16 |
11/19 |
11/22 |
11/25 |
11/28 |
12/1 |
Exhibit 19: Potential NAV takeout scenarios
|
Makewhole |
Total |
CoC put |
Total |
Total |
|
Date |
Price |
Return |
option |
Return Call price |
Return |
|
6/1/2019 |
$107.69 |
21.7% |
$101.00 |
8.1% |
|
|
1/1/2020 |
$105.90 |
11.5% |
$101.00 |
7.2% |
|
|
6/1/2020 |
$104.62 |
9.1% |
$101.00 |
6.9% |
|
|
11/1/2020 |
|
|
|
|
$103.31 |
7.8% |
*Totalreturnassumesbuyingbondsat100.25, the offered-side as of 12/3/2018
Nav 2025s Yield Book HY Broad Market Yield Book Autos/Vehicle Parts Index
Source: Goldman Sachs Global Investment Research, Bloomberg, The Yield Book Source: Goldman Sachs Global Investment Research, Bloomberg
4 December 2018 |
9 |
vk.com/id446425943
Goldman Sachs
Credit Outlook
Trade idea # 2: Swap out of the GT 5.125% 2023s and into the AXL 6.625% 2022s.
Following a challenging 3Q print, the AXL 2022s are currently yielding ~6.5% (bid), a substantial 100bps wider than the GT 2023s. While we recognize that both names face headwinds, we see better risk/reward in the AXL 2022s. GT has shown an inability to offset moves in commodities, has cut its FY18 SOI target multiple times this year and abandoned its long-standing 2020 target with the arrival of the new CFO. We also see an unfavorable supply/demand dynamic in HVA/LVA tires; we expect foreign producers to enter the market, increasing price competition and weighing on results. While AXL is facing some operational issues in the near-term, they are related to specific product launches as opposed to macroeconomic factors. Thus, we see these problems as more in the company’s control and think it is taking the right steps to get them resolved over the next few quarters. We also note that deleveraging is still AXL’s main priority, and we think it is possible the company addresses a portion or all of the 2022s early (currently callable at 102.208). We see a ~10% total return if the 2022s are called in the middle of next year at 102.208, and a ~7% total return if the company waits until the call price steps down to 101.104 in Oct 2019. Meanwhile, GT remains focused on shareholder returns, and management does not seem focused on debt paydown. Given these dynamics, we recommend investors swap into the AXL 2022s given the incremental spread in a deleveraging story, early take-out potential, and lower duration risk.
Risks to our view: Upside risks for GT: Raw material costs decline, tariffs on Chinese tires help company protect market share, successful Tirehub ramping. Downside risks for AXL: cost structure inflated going-forward (systemic), inability to pass-through commodity costs, unfavorable renegotiations with OEMs, dependency on GM and other large OEM products, declines in SAAR.
Exhibit 20: AXL 2022s and GT 2023s trading history
7.50% |
|
|
|
|
|
|
|
|
|
|
7.00% |
|
|
|
|
|
|
|
|
|
|
6.50% |
|
|
|
|
|
|
|
|
|
|
6.00% |
|
|
|
|
|
|
|
|
|
|
5.50% |
|
|
|
|
|
|
|
|
|
|
5.00% |
|
|
|
|
|
|
|
|
|
|
4.50% |
|
|
|
|
|
|
|
|
|
|
4.00% |
|
|
|
|
|
|
|
|
|
|
3.50% |
|
|
|
|
|
|
|
|
|
|
3.00% |
|
|
|
|
|
|
|
|
|
|
Feb-18 |
Mar-18 |
Apr-18 |
May-18 |
Jun-18 |
Jul-18 |
Aug-18 |
Sep-18 |
Oct-18 |
Nov-18 |
Dec-18 |
GT 2023s |
|
AXL 2022s |
|
Source: Goldman Sachs Global Investment Research, Bloomberg
4 December 2018 |
10 |