

GS European Views. Macro Outlook 2019 2022_watermark
.pdfvk.com/id446425943
20 November 2018 | 3:31PM GMT
European Views: Macro Outlook 2019 — 2022: A focus on Italy
Silvia Ardagna
+44(20)7051-0584 | silvia.ardagna@gs.com Goldman Sachs International
See all our year-ahead forecasts in one place. Visit the page.
nWe expect the Italian economy to moderate further from the current lacklustre pace of growth, and flirt with recession in H1 2019. We think that any temporary boost to private domestic demand from the fiscal expansion provided with the 2019 budget would be crowded out by the negative impact of a potential credit crunch stemming from market tensions. As such, we have downgraded our 2018 and 2019 growth forecast to 1.0% (vs. 1.1% previously) and 0.4% (0.9%), respectively. Our real GDP growth projections in 2018-2019 are below Consensus and official sector forecasts.
nOn the back of significant remaining slack and the impact of the German inflation cap, we forecast continued weakness in Italian headline and core inflation, which, at the end of our forecast horizon, will reach only 1.3%pa.
nOur fiscal projections are more pessimistic than those of the government. We expect a rising public debt-to-GDP ratio. Our fiscal outlook beyond 2019 assumes that a less expansionary set of economic policies than announced by the government will be implemented in future years. But, the details of the pension reform and the minimum universal income scheme have not been yet published. If enacted along the lines the government is suggesting, these policies would be difficult to reverse and more expensive than the government indicates. This would lead to a sharper increase in public debt than we forecast.
nWe anticipate more pressure on Italian assets and more political and policy uncertainty, with possible snap elections in 2019. In our view, economic pain and market pressure are needed to shift voters’ preferences and politicians’ choices towards a more market-friendly set of economic policies. This shift is embedded in our forecast, which foresees a mild rebound in economic activity starting from the second half of 2019.
nRisks to our outlook are to the downside. In our view, the main risk is that Italy could reach a political impasse and / or could be locked out of financial markets before an economic policy reversal occurs, leading to a self-fulfilling market dynamic akin to what emerged in 2011-12, with non-linear consequences for asset prices and the economy.
Investors should consider this report as only a single factor in making their investment decision. For Reg AC certification and other important disclosures, see the Disclosure Appendix, or go to www.gs.com/research/hedge.html.

vk.com/id446425943
Goldman Sachs
European Views
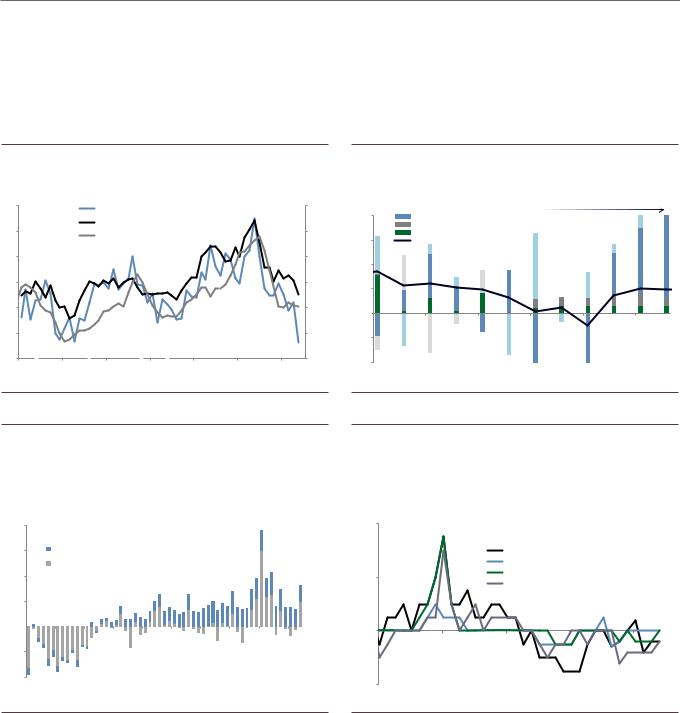
Exhibit 1: Our latest forecast for Italy
Forecasting horizon is indicated by the shaded area
|
|
2012 |
2013 |
2014 |
2015 |
2016 |
2017 |
2018 |
2019 |
2020 |
2021 |
2022 |
|
|
GDP and its components (%yoy) |
|
|
|
|
|
|
|
|
|
|
|
|
|
GDP |
-2.9 |
-1.7 |
0.2 |
0.8 |
1.3 |
1.6 |
1.0 |
0.4 |
1.1 |
1.0 |
1.0 |
|
|
Private consumption |
-4.0 |
-2.4 |
0.2 |
1.9 |
1.3 |
1.5 |
0.7 |
0.4 |
0.6 |
0.8 |
1.0 |
|
|
Govt consumption |
-1.4 |
-0.3 |
-0.7 |
-0.6 |
0.3 |
-0.1 |
0.0 |
0.4 |
0.4 |
0.3 |
0.3 |
|
|
Fixed Investment |
-9.4 |
-6.6 |
-2.2 |
1.9 |
3.7 |
4.4 |
3.1 |
-1.0 |
4.0 |
2.9 |
2.4 |
|
|
Exports |
2.0 |
0.9 |
2.4 |
4.1 |
2.3 |
6.3 |
0.9 |
3.6 |
3.9 |
3.7 |
3.2 |
|
|
Imports |
-8.2 |
-2.3 |
3.0 |
6.7 |
3.9 |
5.6 |
1.6 |
3.3 |
4.3 |
4.1 |
3.8 |
|
|
External position (% of GDP) |
|
|
|
|
|
|
|
|
|
|
|
|
|
Current account |
-0.4 |
1.0 |
1.9 |
1.5 |
2.5 |
2.8 |
2.7 |
2.6 |
2.4 |
2.4 |
2.3 |
|
|
Prices (%yoy) |
|
|
|
|
|
|
|
|
|
|
|
|
|
Consumer prices (Harmonised) |
3.3 |
1.2 |
0.2 |
0.1 |
-0.1 |
1.3 |
1.3 |
1.1 |
1.2 |
1.2 |
1.2 |
|
|
Core consumer prices (Harmonised) |
2.0 |
1.2 |
0.7 |
0.7 |
0.5 |
0.8 |
0.7 |
0.8 |
1.3 |
1.3 |
1.3 |
|
|
Labour market |
|
|
|
|
|
|
|
|
|
|
|
|
|
Unemployment rate (Harmonised) |
10.7 |
12.1 |
12.6 |
11.9 |
11.7 |
11.3 |
10.7 |
10.7 |
10.6 |
10.2 |
9.9 |
|
|
Total labour costs |
1.8 |
2.3 |
1.5 |
0.3 |
-0.4 |
0.8 |
1.4 |
1.0 |
1.2 |
1.4 |
1.4 |
|
|
Fiscal positions (% of GDP) |
|
|
|
|
|
|
|
|
|
|
|
|
|
Government budget balance |
-2.9 |
-2.9 |
-3.0 |
-2.6 |
-2.5 |
-2.4 |
-1.9 |
-3.0 |
-3.2 |
-3.6 |
-3.3 |
|
|
Government gross debt |
123.4 |
129.1 |
131.7 |
131.6 |
131.3 |
131.7 |
130.5 |
131.5 |
131.4 |
131.8 |
131.8 |
|
|
|
|
|
|
|
|
|
|
|
|
|
|
|
Source: ISTAT, Goldman Sachs Global Investment Research
Macro Outlook 2019 — 2022: A focus on Italy
Over the course of 2018, Italian GDP growth has been only slightly weaker than we and Consensus expected this time a year ago1. However, after a strong Q1, political and policy uncertainty generated by the outcome of the general election has weighed on confidence, leading to a sizeable slowdown in economic activity. We expect this deceleration to extend in the coming months and, as a result, have downgraded our 2018 and 2019 growth forecasts to 1.0% (vs. 1.1% previously) and 0.4% (0.9%), respectively. Our real GDP growth projection in 2019 is below Consensus (0.9%) and official sector forecasts.
Bearish on Italian growth next year ...
With real GDP stagnating in Q3, despite little evidence thus far of the increase in bond yields and drop in equity prices passing through to the real economy, we expect the economy to moderate further and flirt with recession in H1 2019. The fall in asset prices is likely to tighten bank credit conditions and, via this channel, lead to a further decline in private consumption and business investment. Based on our analysis (see below), we expect any temporary boost to private domestic demand from the fiscal expansion provided with the 2019 budget to be crowded out by the negative impact of such a credit crunch.
In addition (and in line with the rest of the Euro area), we expect a weak contribution to growth from foreign demand as the recent moderation in exports is likely to continue on the back of developments in emerging market economies, a slowdown in the US, and risks from tariff and trade policies.
1GS (Consensus) forecast as of November 2017: real GDP growth at 1.1% (1.2%) in 2018 and 0.9% in 2019.
20 November 2018 |
2 |
vk.com/id446425943
Goldman Sachs
European Views
We expect a mild rebound in the second half of 2019, when we anticipate that, on the back of a likely decline in the coalition’s popularity in opinion polls (see below), our view is that a populist-led government (albeit potentially of different composition to the current government) would pursue an overall less expansionary fiscal policy. This would likely to lead to a relief in markets, which, over time, would reverse the negative dynamics we expect during the first half of the year.
Exhibit 2: Confidence indicators point to weak domestic demand |
Exhibit 3: ...Italy is likely to flirt with recession in H1 2019 |
and... |
Real GDP growth (% qoq) and its contribution to main components |
60 |
Index |
|
Italy Composite PMI (lhs) |
|
|
% |
|
58 |
|
|
Euro area Composite PMI (lhs) |
|
|
||
|
|
Ita-coin (rhs) |
|
|
|
|
|
|
|
|
|
|
|
|
|
56 |
|
|
|
|
|
|
|
54 |
|
|
|
|
|
|
|
52 |
|
|
|
|
|
|
|
50 |
|
|
|
|
|
|
|
48 |
|
|
|
|
|
|
|
Jan14 |
Oct14 |
Jul15 |
Apr16 |
Jan17 |
Oct17 |
Jul18 |
|
0.8 |
|
Stocks |
|
||
|
Net Export |
|
|
|
1.2 |
Gross fixed capital formation |
|
GS Forecasts |
|
|
0.6 |
|
Govt Consumption |
|
|
|
|
0.9 |
Private Consumption |
|
|
|
||
|
GDP |
|
|
|
|
|
0.4 |
0.6 |
|
|
|
|
|
|
|
|
|
|
|
|
0.2 |
0.3 |
|
|
|
|
|
|
|
|
|
|
|
|
0.0 |
0.0 |
|
|
|
|
|
|
|
|
|
|
|
|
-0.2 |
-0.3 |
|
|
|
|
|
|
|
|
|
|
|
|
-0.4 |
-0.6 |
|
|
|
|
|
|
|
|
|
|
|
|
|
Mar17 |
Sep17 |
Mar18 |
Sep18 |
Mar19 |
Sep19 |
Source: Eurostat, Haver Analytics, Goldman Sachs Global Investment Research
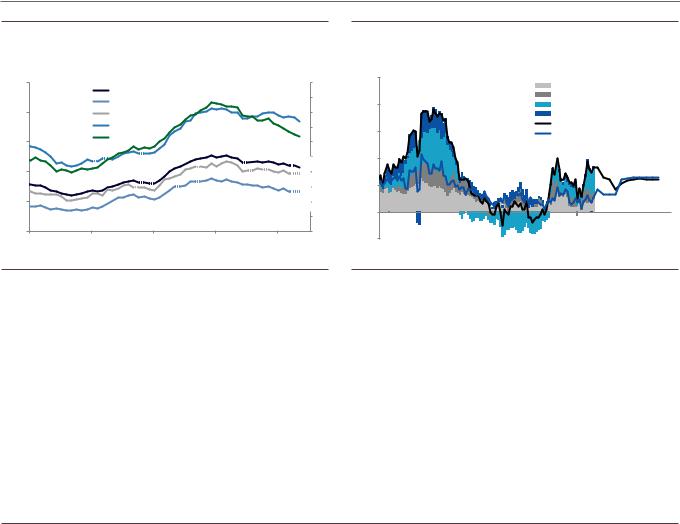
Exhibit 4: Credit is continuing to flow to the real economy as...
8EUR (bn)
6 |
|
Flow of lending to HHs (3mnth ma) |
|
|
Flow of lending to NFCs (3mnth ma) |
4 |
|
|
2 |
|
|
0 |
|
|
|
|
|
-2 |
|
|
-4 |
|
|
Jan14 |
Jul14 Jan15 Jul15 Jan16 Jul16 Jan17 Jul17 Jan18 Jul18 |
|
Source: ISTAT, Haver Analytics, Goldman Sachs Global Investment Research
Exhibit 5: ... banks have not yet tightened lending standards notably, although the risks are tilted in that direction
Net % computed as difference between those answering credit standards have been tightened and those answering have been eased in Bank Lending Survey
100 |
|
|
|
|
Higher values indicate a tightening of credit standards |
|
|||
|
|
Change of credit standards to enterprises |
||
|
|
Due to banks’ cost of capital |
|
|
50 |
|
Due to banks’ access to finance |
|
|
|
Due to changes in size of loans and credit lines |
|||
|
|
|||
0 |
|
|
|
|
-50 |
|
|
|
|
Mar.2010 |
Mar.2012 |
Mar.2014 |
Mar.2016 |
Mar.2018 |
Source: Bank of Italy, Goldman Sachs Global Investment Research |
Source: Bank of Italy, Goldman Sachs Global Investment Research |
...although less so in 2020-2022
In our forecast, real GDP growth averages 1% in 2020-2022. This pace of growth is above our and most estimates of potential growth (at about 0.6%-0.8%). After a weak 2019, our medium-term view of the growth outlook reflects some cyclical rebound, followed by a temporary stabilisation, with some delayed positive effects from the planned increase in public investment rather than a sizeable increase in potential growth. From a medium-term perspective, a new coalition government would still be unlikely to turn around the quality of many institutions, pass the necessary reforms to boost productivity and potential growth, and create the long-lasting virtuous circle
20 November 2018 |
3 |

vk.com/id446425943
Goldman Sachs
European Views
required for a sizeable decline in the public debt-to-GDP ratio. Hence, on our base case, a resolution of the current Italian situation would, once again, only allow Italy to “muddle through”.
A contractionary fiscal expansion
Based on our analysis of the fiscal multipliers, we are sceptical that the fiscal easing proposed by the government (as embodied in the changes to the size and composition of the budget) will stimulate real GDP growth to rates above our forecast. In line with the economic literature, we find that fiscal multipliers in high-debt countries such as Italy are much smaller than in countries with median public-debt-to-GDP ratios (European Economics Analyst: An Italian fiscal expansion — Part II: Not so growth supportive, may halt decline in public debt-to-GDP ratio). This is because the increase in interest rates and the widening of spreads that occur on the back of a fiscal expansion in high-debt countries leads to an increase in the banks’ cost of funding, which is passed on to consumers and firms. This crowds out private consumption and private investment. In addition, the decrease in government bond prices also has negative effects on household wealth and on banks and insurance companies’ balance sheets, all of which weighs on consumer and business confidence. In sum, we expect that any temporary boost to private domestic demand from the fiscal expansion provided with the 2019 budget will be crowded out by the negative impact of a potential credit crunch stemming from market tensions, and the decline in business confidence and the concurrent widening of the spreads, in our view, provides some initial evidence in favour of the crowding out.
So far, data on bank deposits, loan volumes and interest rates charged on consumers’ and firms’ loans do not show notable signs of deterioration in credit supply conditions. But the data available so far cover the period until July-August. More recent data should provide us with direct evidence on the effect of the increase in interest rates and banks’ funding costs on credit supply and the real economy. In 2011-2012, the feedback loop between the Italian sovereign and its banks was both a reason for heightened financial stress and for a sizeable recession.
The composition of the fiscal expansion included in the 2019 budget is also rather growth-unfriendly. It is skewed towards a sizeable increase in public current spending on transfers to households and pension payments (via the universal minimum income and pension scheme, and by allowing people to retire younger than under current law), rather than towards an increase in public investment or cuts to labour taxes. Based on our estimates, the combined effect of the fiscal expansion included in the 2019 budget plan and the widening of BTPs-Bunds spreads could have an overall negative drag on real GDP growth of around 0.6-0.8% over a 12-month horizon.
20 November 2018 |
4 |
vk.com/id446425943
Goldman Sachs
European Views
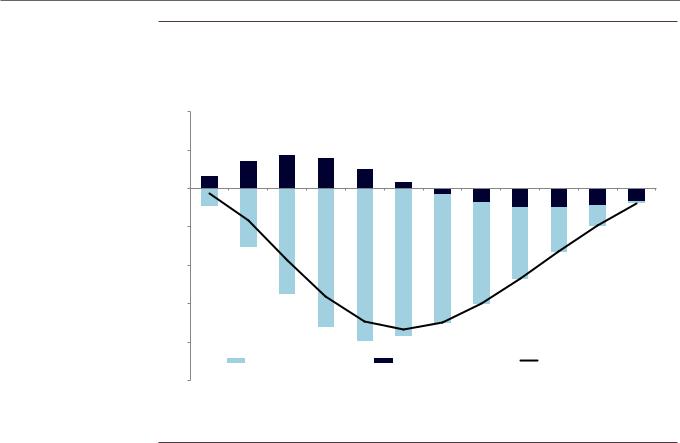
Exhibit 6: The temporary boost to private domestic demand from the fiscal expansion provided with the 2019 budget will likely be crowded out by the negative impact of a credit crunch stemming from market tensions
Impact on real GDP growth of an expansionary fiscal policy shock and a shock to BTPs-Bunds spreads
0.4 |
|
|
|
|
|
|
|
|
|
|
|
Impact on real GDP yoy |
|
|
|
|
|
|
|
|
|
||
growth (%) |
|
|
|
|
|
|
|
|
|
|
|
0.2 |
|
|
|
|
|
|
|
|
|
|
|
0 |
|
|
|
|
|
|
|
|
|
|
|
-0.2 |
|
|
|
|
|
|
|
|
|
|
|
-0.4 |
|
|
|
|
|
|
|
|
|
|
|
-0.6 |
|
|
|
|
|
|
|
|
|
|
|
-0.8 |
|
|
|
|
|
|
|
|
|
|
|
|
BTPs-Bunds spread (+200bp) |
Gov. balance (-0.8% of GDP) |
|
sum |
|
|
|||||
-1 |
|
|
|
|
|
|
|
|
|
|
|
Q3.2018 |
Q4.2018 |
Q1.2019 |
Q2.2019 |
Q2.2019 |
Q3.2019 |
Q4.2019 |
Q1.2020 |
Q2.2020 |
Q2.2020 |
Q3.2020 |
Q4.2020 |
Impulse responses are computed by estimating a structural VAR of change in real GDP growth, change in cyclically adjusted government deficit-to-GDP ratio and change in 7-year BTP-Bund spread.
Source: Bloomberg, Haver Analytics, Goldman Sachs Global Investment Research
A slightly positive contribution from net exports to GDP growth
Strong global growth and the pass-through of the Euro depreciation in 2015-2016 supported Italian exports in 2017. This year, Italian exports have declined owing to drivers turning from tailwinds into headwinds. We expect only limited growth in exports in 2019, reflecting the slower global backdrop and the lack of improvement in Italian competitiveness. At the same time, slowing domestic demand will likely weigh on imports. As a result, we forecast a slight positive contribution to growth from net exports.
Italian labour market has started to heal but inflation remains low
Italian inflation has remained weak. Core inflation printed at 0.8%yoy in October, 30bp below the Euro area outturn. Slack in the Italian economy remains sizeable, with real per capita GDP below its pre-crisis level, and the unemployment rate at 10.7% in Q2 (down from 12.8% at the beginning of 2014, but up from 6% in 2007Q2). Continuing soft wage and price growth in Germany also spill over into wage and price dynamics in Italy, given the need for a ‘competitive disinflation’ to regain competitiveness in the absence of nominal exchange rate flexibility within monetary union. These two factors lead us to forecast continued weakness in Italian headline and core inflation, which, at the end of our forecast horizon, will reach only 1.3%pa.
20 November 2018 |
5 |
vk.com/id446425943
Goldman Sachs
European Views
Exhibit 7: Despite a fall, the unemployment rate remains double its |
Exhibit 8: We forecast a very gradual acceleration in inflation |
pre-global financial crisis level
25 |
% |
|
|
|
50 |
5 |
|
|
|
Services |
|
|
Italian unemployment rate |
|
|
|
|
|
|
||||
|
|
|
45 |
% |
|
|
|
|
|||
|
|
|
North |
|
4 |
|
|
|
Food |
|
|
20 |
|
|
|
40 |
|
|
|
Energy |
|
||
|
|
Central |
|
|
|
|
|
Non-energy industrial goods |
|||
|
|
|
South |
|
35 |
3 |
|
|
|
Headline |
|
15 |
|
|
Youth(rhs) |
|
30 |
|
|
|
Core |
|
|
|
|
|
|
|
|
|
|
|
|||
|
|
|
|
|
|
|
|
|
|
||
|
|
|
|
|
25 |
2 |
|
|
|
|
|
10 |
|
|
|
|
20 |
|
|
|
|
|
|
|
|
|
|
|
15 |
1 |
|
|
|
|
|
5 |
|
|
|
|
10 |
|
|
|
|
|
|
|
|
|
|
|
5 |
0 |
|
|
|
|
|
|
|
|
|
|
|
|
|
|
|
|
|
0 |
|
|
|
|
0 |
-1 |
|
|
|
|
|
Jun05 |
Jun08 |
Jun11 |
Jun14 |
Jun17 |
Jan12 |
Jan14 |
Jan16 |
Jan18 |
Jan20 |
||
|
|
|
|
|
|
Jan10 |
|||||
Source: ISTAT, Goldman Sachs Global Investment Research |
Source: ISTAT, Goldman Sachs Global Investment Research |
Weaker fiscal fundamentals...
Our fiscal projections are more pessimistic than those of the government. We anticipate that the new measures included in the recent budget plan will lead to a deterioration in the fiscal outlook beyond that which is incorporated in government forecasts. We also think that the savings and revenue raising measures in other parts of the budget projected by the government will be difficult to achieve, including privatisation proceeds recently indicated to the European Commission as a source of revenue to contain the increase of government deficit. Moreover, we forecast both lower nominal GDP growth and higher interest rate expenses than the government, leading us to expect that the public debt-to-GDP ratio will rise in the coming years.
Exhibit 9: Our macro and fiscal projections are more pessimistic than those of the government
|
|
Real GDP growth (%) |
Inflation, measured by GDP |
Average cost of public debt (%) |
Interest rates expenses (% of |
Gen. gov. primary balance (% |
Gen. gov. balance (% of GDP, |
Gen. gov. debt (% of GDP) |
|
||||||||||||||
|
|
|
|
|
|
deflator (%) |
|
|
|
|
|
GDP) |
|
of GDP, + surplus, - deficit) |
+ surplus, - deficit) |
|
|
|
|
||||
|
|
Stability |
Stability |
|
Stability |
Stability |
|
Stability |
Stability |
|
Stability |
Stability |
|
Stability |
Stability |
|
Stability |
Stability |
|
Stability |
Stability |
|
|
|
|
Program |
Program |
GS |
Program |
Program |
GS |
Program |
Program |
GS |
Program |
Program |
GS |
Program |
Program |
GS |
Program |
Program |
GS |
Program |
Program |
GS |
|
|
|
me May |
me |
me May |
me |
me May |
me |
me May |
me |
me May |
me |
me May |
me |
me May |
me |
|
|||||||
|
|
October |
|
October |
|
October |
|
October |
|
October |
|
October |
|
October |
|
|
|||||||
|
|
2018 |
|
2018 |
|
2018 |
|
2018 |
|
2018 |
|
2018 |
|
2018 |
|
|
|||||||
|
|
|
2018 |
|
|
2018 |
|
|
2018 |
|
|
2018 |
|
|
2018 |
|
|
2018 |
|
|
2018 |
|
|
|
2017 |
|
1.6 |
|
|
0.5 |
|
|
3.0 |
|
|
3.8 |
|
1.5 / 1.9 excluding one off |
2.4 / 2.0 excluding one off |
|
131.1 |
|
|
||||
|
|
|
|
|
|
|
|
|
expenses for banks |
expenses for banks |
|
|
|
||||||||||
|
|
|
|
|
|
|
|
|
|
|
|
|
|
|
|
|
|
||||||
|
2018 |
1.5 |
1.2 |
1.0 |
1.3 |
1.3 |
0.9 |
2.7 |
2.8 |
2.8 |
3.4 |
3.6 |
3.6 |
1.9 |
1.8 |
1.7 |
-1.5 |
-1.8 |
-1.9 |
129.0 |
130.9 |
130.5 |
|
|
2019 |
1.4 |
1.5 |
0.4 |
1.8 |
1.6 |
1.2 |
2.8 |
3.0 |
3.0 |
3.5 |
3.8 |
4.0 |
2.7 |
1.3 |
1.0 |
-0.8 |
-2.5 |
-3.0 |
125.8 |
130.0 |
131.4 |
|
|
2020 |
1.3 |
1.6 |
1.1 |
1.7 |
1.9 |
1.4 |
2.9 |
3.0 |
3.2 |
3.5 |
3.8 |
4.2 |
3.4 |
1.7 |
1.0 |
-0.1 |
-2.1 |
-3.2 |
122.2 |
128.1 |
131.4 |
|
|
2021 |
1.2 |
1.4 |
1.0 |
1.5 |
1.7 |
1.5 |
3.0 |
3.2 |
3.4 |
3.6 |
4.0 |
4.6 |
3.7 |
2.1 |
1.0 |
0.1 |
-1.9 |
-3.6 |
118.9 |
126.7 |
131.8 |
|
|
|
|
|
|
|
|
|
|
|
|
|
|
|
|
|
|
|
|
|
|
|
|
|
Source: Italian Finance Ministry, Eurostat, European Commission, Goldman Sachs Global Investment Research
20 November 2018 |
6 |
vk.com/id446425943
Goldman Sachs
European Views
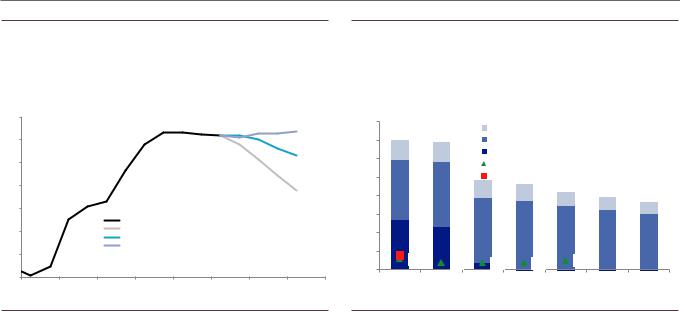
Exhibit 10: Italian public debt on a rising trend again |
Exhibit 11: Italian government gross refinancing needs in 2019 |
% of GDP |
close to those in 2018, but lower primary surplus and the end of |
|
ECB asset purchases increases the amount private investors need |
|
to absorb |
|
EUR bn |
135 |
|
|
|
|
|
|
400 |
|
|
|
|
|
|
|
|
|
|
|
|
|
|
|
|
|
Interest rate expenses on securities outstanding |
||||||
|
|
|
|
|
|
|
|
|
|
||||||
130 |
|
|
|
|
|
|
350 |
|
|
>12 months |
|
|
|
|
|
|
|
|
|
|
|
|
300 |
|
|
<12 months |
|
|
|
|
|
125 |
|
|
|
|
|
|
|
|
Primary surplus (GS forecast) |
|
|
||||
|
|
|
|
|
|
|
|
|
|
|
|||||
120 |
|
|
|
|
|
|
250 |
|
|
ECB PSPP |
|
|
|
|
|
|
|
|
|
|
|
200 |
|
|
|
|
|
|
|
|
|
|
|
|
|
|
|
|
|
|
|
|
|
|
|
|
|
115 |
|
|
|
|
|
|
150 |
|
|
|
|
|
|
|
|
|
|
|
Public Debt/GDP |
|
|
|
|
|
|
|
|
|
|
||
|
|
|
|
|
|
|
|
|
|
|
|
|
|
||
110 |
|
|
Stability Programme May 2018 |
|
100 |
|
|
|
|
|
|
|
|
||
|
|
Stability Programme October 2018 |
|
|
|
|
|
|
|
|
|
||||
|
|
|
|
|
|
|
|
|
|
|
|
|
|||
105 |
|
|
GS |
|
|
|
50 |
39 |
|
|
|
|
|
|
|
|
|
|
|
|
|
|
|
|
|
25 |
|
|
|||
|
|
|
|
|
|
|
0 |
30 |
18 |
|
18 |
19 |
|
|
|
|
|
|
|
|
|
|
|
|
|
|
|
||||
100 |
|
|
|
|
|
|
|
|
|
|
|
|
|
|
|
2009 |
2011 |
2013 |
2015 |
2017 |
2019 |
2018 |
|
2019 |
2020 |
2021 |
|
2022 |
2023 |
2024 |
|
2007 |
2021 |
|
|
|
|
|
|
|
|
||||||
Source: Italian Finance Ministry, Eurostat, European Commission, Goldman Sachs Global |
Source: Bloomberg, ECB, Bank of Italy, Goldman Sachs Global Investment Research |
Investment Research
...higher government funding needs in 2019...
The lower primary surplus that we forecast, together with the end of ECB asset purchases, would increase the supply of government bonds that the private sector will have to absorb (by about EUR50bn). Domestic investors, including the Bank of Italy, hold about two-thirds of the stock of government securities. Italian banks and other financial institutions are already significantly exposed to the government (via debt holdings and/or loans granted), reflected in the sizeable share of government liabilities in their total assets. Furthermore, Italian households already allocate the majority of their financial wealth domestically. As yet, there is little evidence of capital outflows from domestic investors. However, recent data on capital inflows into Italian assets point to a decline in foreign appetite for Italian financial assets, and in particular government bonds. In our view, Italian asset prices are likely to fall further from current levels as the economic and fiscal outlooks continue to deteriorate, and we do not think that domestic institutional and retail investors would be able (or willing) to absorb the large BTPs supply (let alone a large decline in foreign holdings of Italian debt) at current prices.
20 November 2018 |
7 |
vk.com/id446425943
Goldman Sachs
European Views
Exhibit 12: About two-thirds of Italian government bonds are held by domestic investors, including the Bank of Italy
100%  Foreigners
|
Other Italian residents |
|
80% |
Italian financial institutions other than |
EUR657bn,33.3% |
|
||
|
banks |
|
60% |
Italian banks |
|
EUR90bn,4.5% |
|
|
|
|
|
|
Bank of Italy |
EUR447bn,22.7% |
40% |
|
|
|
|
|
20% |
EUR394bn,19.9% |
|
|
||
0% |
|
EUR 390, 19.6% |
|
|
|
Jan-10 Jan-11 Jan-12 Jan-13 Jan-14 |
Jan-15 Jan-16 Jan-17 Jan-18 |
|
Source: Bank of Italy, Goldman Sachs Global Investment Research
Exhibit 13: Italian banks are exposed to the general government (via its securities and/or loans granted) by a sizeable share of their assets
% of banks’ assets
12 |
|
11 |
|
10 |
|
9 |
|
8 |
|
7 |
|
6 |
|
5 |
Loans granted by Italian banks to Italian government as a share of |
4 |
Italian banks’ assets |
|
Italian banks holdings of Italian general government securities as a
3share of Italian banks’ assets
2 


 Jan-10 Jan-11 Jan-12 Jan-13 Jan-14 Jan-15 Jan-16 Jan-17 Jan-18
Source: Bank of Italy, Goldman Sachs Global Investment Research
Exhibit 14: Italian households could buy more foreign assets if they were to expect sizeable losses or taxes on their holdings of domestic financial assets
EUR bn as of end of Q1 2018
Exhibit 15: Since May, foreign investors have reduced their exposure to Italian assets
Cumulative monthly flows
1400 |
|
Other |
|
Domestic Insurance and pension |
40 |
EUR mln. |
|
|
|
|
|
||
|
|
|
|
|
|
|
|
||||||
1200 |
|
Domestic Equities |
Domestic Bonds |
|
30 |
|
|
|
|
|
|
||
|
|
Foreign assets |
Domestic Mutual funds shares |
|
|
|
|
|
|
||||
1000 |
|
20 |
|
|
|
|
|
|
|||||
|
|
|
|
|
|
|
|
|
|
|
|
||
800 |
|
|
|
|
|
|
10 |
|
|
|
|
|
|
|
|
|
|
|
|
|
|
|
|
|
|
|
|
600 |
1261 |
|
|
|
|
|
0 |
|
|
|
|
|
|
|
|
|
|
|
-10 |
|
|
|
|
|
|
||
400 |
|
1003 |
966 |
|
|
|
|
|
|
|
|
|
|
|
|
|
|
|
|
-20 |
|
Foreigners purchases of Italian Equity |
|
|
|||
|
|
|
|
|
|
|
|
|
|
||||
200 |
|
|
|
447 |
433 |
260 |
-30 |
|
Foreigners purchases of Italian Debt |
|
|
||
|
|
|
|
|
|
|
|
|
|||||
|
|
|
|
|
|
|
|
Foreign direct investment in Italy |
|
|
|||
0 |
|
|
|
|
|
|
-40 |
|
|
|
|||
Other |
Domestic |
Domestic |
Domestic |
Foreign assets |
Domestic |
|
|
|
|
|
|
||
|
-50 |
|
|
|
|
|
|
||||||
|
|
Insurance and |
Equities |
Bonds |
|
Mutual funds |
|
|
|
|
|
|
|
|
|
pension |
|
|
|
shares |
Jan.2016 |
Jul.2016 |
Jan.2017 |
Jul.2017 |
Jan.2018 |
Jul.2018 |
|
Source: Bank of Italy, Goldman Sachs Global Investment Research |
Source: Eurostat, Goldman Sachs Global Investment Research |
...and a highly uncertain fiscal outlook in 2020-2022
That said, the fiscal outlook in 2020-2022 hinges on the details and passage of the law decrees on the pension reform and the minimum universal income scheme. The 2019 budget law is currently being discussed in Parliament. It creates two funds to finance the pension reform and the minimum universal income scheme, with an allocation of around EUR7bn and EUR9bn per annum to these measures. But the law decrees governing these two measures have yet to be published, leaving the details sketchy. Based on available information, the cost of the pension reform and the cost of the minimum universal income scheme could be significantly higher than projected in the years beyond 2019. As a result, if these measures are implemented in line with indications given so far by the government, they would imply a sizeable deterioration in the fiscal outlook beyond 2019, for the reasons we discussed here. That said, there is disagreement between the parties in the coalition government over the merit and
20 November 2018 |
8 |
vk.com/id446425943 |
European Views |
|
Goldman Sachs |
||
|
|
specifics of these measures. Should these measures be implemented in a less |
|
|
expensive form, public debt would likely remain stable at around 2019 levels. |
|
|
Political uncertainty likely to persist with the possibility of snap elections |
|
|
in 2019 |
|
|
The two governing populist parties continue to disagree publicly over various economic |
|
|
and law and order issues. Thus far, they have always eventually found a compromise, |
|
|
but internal tensions persist. At present, the governing coalition has the support of |
|
|
around 60% of the electorate in opinion polls. Against this backdrop, the consensus |
|
|
view is that the current government will survive at least until the European elections |
|
|
next May. This assessment is based on the view that the parties in government aim at |
|
|
maximising their vote in the European elections and could seek to form an alliance with |
|
|
parties in other parts of Europe that share a similar vision of Europe so as to change the |
|
|
EU’s institutional framework in directions they see as desirable (for example, weakening |
|
|
fiscal rules, changing the mandate of the European Central Bank, tightening curbs on |
|
|
immigration). |
|
|
However, if in line with our forecast, the economy continues to weaken, Italian asset |
|
|
prices fall further and market tensions build, electoral support for the government would |
|
|
likely diminish. In that context, we think the governing parties’ political strategies would |
|
|
change. The likely outcome would be: either the parties remain in a coalition, but change |
|
|
the course of their economic policy agenda to put public debt back on a sustainable |
|
|
downward trajectory, or there could be new elections. In our view, any new government |
|
|
– whether right-of-centre or left-of-centre – would likely implement some fiscal policy |
|
|
reversal. At this stage, we do not view a technocratic or broad coalition government as a |
|
|
plausible alternative solution, as it would be unlikely to win a confidence vote in |
|
|
Parliament. |
Exhibit 16: Opinion polls show that Lega is ahead of Five Star Movement and the government coalition is at 58%…
40 |
% opinion polls |
Lega |
|
Forza Italia |
|
|
|
|
|
||
35 |
|
|
Fratelli D’Italia |
|
Five Star |
|
|
Partito Democratico |
|
|
|
|
|
|
|
|
|
30 |
|
|
|
|
|
25 |
|
|
|
|
|
20 |
|
|
|
|
|
15 |
|
|
|
|
|
10 |
|
March 4: General election |
|
|
|
|
|
|
|
||
5 |
|
|
|
|
|
0 |
|
|
|
|
|
16 Feb 18 |
17 Apr 18 |
16 Jun 18 |
15 Aug 18 |
14 Oct 18 |
|
Exhibit 17: ...while a potential right-of-centre coalition formed by Lega, Forza Italia and Fratelli D’Italia is at 44%, and a potential left-of-centre-coalition formed by Five Star, Partito Democratico and Leu is at 46%
35 % opinion polls
 Leu
Leu
30 |
|
|
|
Fratelli D’Italia |
|
|
25 |
|
|
|
Others |
|
|
|
|
|
|
|
|
|
20 |
|
|
|
Forza Italia |
|
|
|
|
|
Partito Democratico |
|
||
|
32 |
|
|
|
||
15 |
|
|
Lega |
|
|
|
|
|
|
|
|
||
26 |
|
|
|
Five Star |
|
|
10 |
|
17 |
|
|
||
|
|
|
|
|
||
|
|
|
|
|
|
|
5 |
|
|
9 |
10.00 |
|
|
0 |
|
|
|
|
3 |
3.00 |
|
|
|
|
|
|
|
Five Star |
Lega |
Partito |
Forza Italia |
Others |
Fratelli |
Leu |
|
|
Democratico |
|
|
D’Italia |
|
Source: EMG, Index, IPR, Ipsos, SWG, Demopolis, Tence, BidiMedia, ScenariPolitici, Termometro |
Source: EMG, Index, IPR, Ipsos, SWG, Demopolis, Tence, BidiMedia, ScenariPolitici, Termometro |
Politico, Goldman Sachs Investment Research |
Politico, Goldman Sachs Global Investment Research |
20 November 2018 |
9 |
vk.com/id446425943
Goldman Sachs
Risks to our outlook are to the downside
European Views
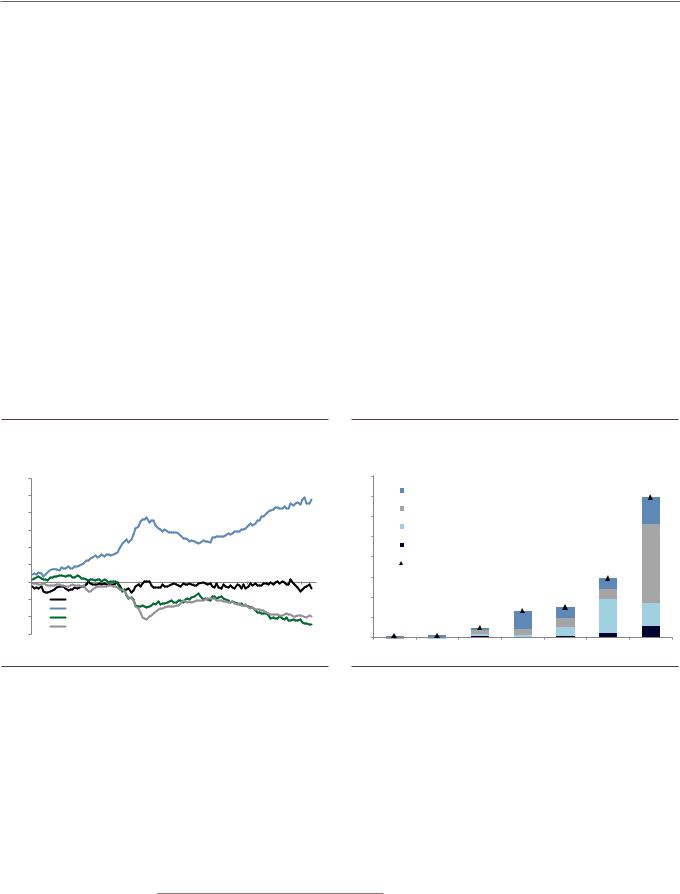
In our baseline case, more market pressure and more economic pain would be required to trigger a change in the course of and rhetoric surrounding fiscal and economic policies that are needed to bring Italian public debt back onto a downward trajectory. Such a policy change is not in sight yet. The main risk in 2019 is that Italy could reach a political impasse and / or could be locked out of financial markets before an economic policy reversal occurs, leading to a self-fulfilling market dynamic akin to what emerged in 2011-12, with non-linear consequences for asset prices and the economy.
While not on our baseline path, scenarios exist in which Italy’s weaknesses and vulnerabilities accumulate to the point that, by accident rather than by design, haircuts to BTP principals or coupon payments, or more likely a re-profiling of the maturity of public debt, can no longer be ruled out. In this self-fulfilling scenario (and given the size of the Italian bond market), the impact would not be limited to Italy but would have systemic implications for the Euro area and the global financial system. Ultimately, as we discussed here, in our view an escalating self-fulfilling crisis could only be halted by the activation of the ECB’s balance sheet as a backstop, via the Outright Monetary Transactions (OMT) scheme. This, however, is only available to countries that accept the conditionality implied by entering a macroeconomic adjustment programme and such conditionality would not be easy for a populist-led Italian government to accept2.
Exhibit 18: Italy’s TARGET 2 liabilities increased more than Spain’s |
Exhibit 19: European banks exposure to Italy is significant |
EUR bn |
% of countries GDP |
1200 |
|
|
|
|
|
16.0 |
|
|
|
|
|
13.9 |
1000 |
|
|
|
|
|
Derivatives, Guarantees extended, Credit commitments |
|
|||||
|
|
|
|
|
14.0 |
|
|
|
|
|
|
|
800 |
|
|
|
|
|
Non Banking sector |
|
|
|
|
|
|
|
|
|
|
|
12.0 |
|
|
|
|
|
|
|
|
|
|
|
|
|
|
|
|
|
|
|
|
600 |
|
|
|
|
|
Government sector |
|
|
|
|
|
|
|
|
|
|
|
10.0 |
|
|
|
|
|
|
|
|
|
|
|
|
|
|
|
|
|
|
|
|
400 |
|
|
|
|
|
Banking sector |
|
|
|
|
|
|
200 |
|
|
|
|
|
8.0 |
|
|
|
|
|
|
|
|
|
|
|
Total |
|
|
|
|
5.8 |
|
|
|
|
|
|
|
|
6.0 |
|
|
|
|
|
|
0 |
|
|
|
|
|
|
|
|
|
|
|
|
|
|
|
|
|
|
|
|
|
|
|
|
|
-200 |
France |
|
|
|
|
4.0 |
|
|
2.6 |
3.0 |
|
|
-400 |
Germany |
|
|
|
|
|
|
|
|
|
|
|
Italy |
|
|
|
|
2.0 |
0.2 |
0.9 |
|
|
|
|
|
-600 |
Spain |
|
|
|
|
0.1 |
|
|
|
|
|
|
|
|
|
|
|
0.0 |
|
|
|
|
|
|
|
May.2008 |
May.2010 |
May.2012 |
May.2014 |
May.2016 |
May.2018 |
|
|
|
|
|
|
|
Sweden |
US |
Austria |
UK |
Germany |
Spain |
France |
||||||
Source: ECB, Goldman Sachs Global Investment Research |
Source: Bank of International Settlement, Goldman Sachs Global Investment Research |
2 |
Even if difficult to mobilise for Italy itself, the OMT could be more quickly and effectively activated to shield |
|
the markets of countries already implementing economic policies in line with the European fiscal framework from contagion.
20 November 2018 |
10 |