

GS Global Macroscope_watermark
.pdfvk.com/id446425943
9 November 2018 | 6:19PM GMT
Global Macroscope
Bear Necessities; an update
nThe sharp correction in equities in October has raised concerns about the prospects of the end of the cycle and the risks of a prolonged bear market. We review some of our previous work on bear markets (see Bear Necessities; Identifying signals for the next bear market, Global Strategy Paper, 13 September 2017) to assess the risks.
nThere are reasons to be cautious about future returns: the growth/inflation mix is deteriorating and markets often have a sharp correction followed by a sharp rally prior to a more sustained bear market.
nOur Bear Market Risk Indicator (GSBLBR) is elevated and indicating high market risks. The current level is consistent historically with zero average returns over 12 months and a substantial risk of drawdowns.
nSet against this, the underlying components of our indicator do not show a consistent level of risks. Specifically, the monetary and inflation indicators remain relatively subdued.
nFurthermore, the recent sell-off has resulted in a meaningful de-rating in equities globally. To this point, there is a reasonable relationship between global growth momentum indicators (PMIs) and both aggregate equity returns and the performance of Cyclicals to Defensives. In both cases market moves seem to have overshot the existing macro data, suggesting that further growth deterioration has been priced in to some extent.
nOur economists also believe that, while growth is on course to slow - particularly in the US - the risks of recession remain low, even out to 2020.
nWithout recession it is very unusual for profits to fall and, consequently, unlikely that equity markets will enter a sustained bear phase. That said, we do think that profit growth will slow meaningfully (we are below bottom-up consensus in all regions for 2019). As QE ends and US rates rise, we see limited room for valuations to rise.
nOverall, we continue to expect a sustained period of low returns rather than a sustained bear market (see Making Cents; The cycle & the return of low returns, Global Strategy Paper, 4 September 2018).
Peter Oppenheimer
+44(20)7552-5782 | peter.oppenheimer@gs.com Goldman Sachs International
Sharon Bell, CFA
+44(20)7552-1341 | sharon.bell@gs.com Goldman Sachs International
Lilia Peytavin
+44(20)7774-8340 | lilia.peytavin@gs.com Goldman Sachs International
Guillaume Jaisson
+44(20)7552-3000 | guillaume.jaisson@gs.com Goldman Sachs International
Goldman Sachs does and seeks to do business with companies covered in its research reports. As a result, investors should be aware that the firm may have a conflict of interest that could affect the objectivity of this report. Investors should consider this report as only a single factor in making their investment decision. For Reg AC certification and other important disclosures, see the Disclosure Appendix, or go to www.gs.com/research/hedge.html. Analysts employed by non-US affiliates are not registered/qualified as research analysts with FINRA in the U.S.
vk.com/id446425943
Goldman Sachs
Where are we now?
Global Macroscope
October was a brutal month for equity markets, with many hitting the technical barrier of a 20% decline often defined as a bear market. The S&P fell on 16 of the 23 trading days and, collectively, equity markets across the world shed around $5tn of market cap. The obvious question now is whether this has marked the start of a bear market more broadly, or if it is a less entrenched, albeit sharp, correction from which markets will quickly recover.
At first sight things do not look encouraging. Three factors suggest that equities could
be about to enter a sustained bear market:
1) The growth/inflation mix is turning against equity returns
The global economy, which had seen a significant boost from record loose financial conditions in 2017 and was further buoyed (particularly in the US) by the fiscal boost, is starting to lose momentum. Our US economists’ 4Q estimate for growth has already slowed to 2.6%, well below the prior two quarters, and their current activity indicator (CAI) fell to 3.0% in October after readings of 3.5-4% over several months. The tightening of financial conditions and the prospects of diminishing support from fiscal policy is likely to result in the US economy slowing to a year-on-year rate of 1.75% by 4Q 2019.
As Exhibit 1 shows, the interest rate rises in the US economy over the past couple of years have been offset by very strong growth. As we move forward in time, the balance between growth and inflation deteriorates.
Exhibit 1: Strong growth, but poised to slow, meets rising yields and inflation
5.0 |
|
|
|
|
|
Fed Funds Rate |
4.0 |
|
|
|
|
|
|
|
|
4.5 |
|
|
|
|
|
US 10y BY |
3.5 |
|
|
|
|
|
|
|
|
4.0 |
|
|
|
|
|
Real US GDP (RHS) |
|
|
|
|
|
|
|
|
3.0 |
3.5 |
|
|
|
|
|
|
|
3.0 |
|
|
|
|
|
|
2.5 |
|
|
|
|
|
|
|
|
2.5 |
|
|
|
|
|
|
2.0 |
2.0 |
|
|
|
|
|
|
1.5 |
|
|
|
|
|
|
|
|
1.5 |
|
|
|
|
|
|
|
|
|
|
|
|
|
|
1.0 |
1.0 |
|
|
|
|
|
|
|
0.5 |
|
|
|
|
|
|
0.5 |
|
|
|
|
|
|
|
|
0.0 |
|
|
|
|
|
|
0.0 |
13 |
14 |
15 |
16 |
17 |
18 |
19 |
20 |
Source: Datastream, Haver Analytics, Goldman Sachs Global Investment Research
9 November 2018 |
2 |
vk.com/id446425943
Goldman Sachs
Global Macroscope
Coupled with tighter financial conditions, the impact of US trade tariffs and rising oil prices have slowed global growth momentum. As Exhibit 2 shows, there is a reasonable relationship between global growth momentum indicators such as PMIs and equity returns year over year. Exhibit 3 shows that there is also a close relationship between growth momentum and the performance of Cyclicals relative to Defensives.
Interestingly, in both cases the market moves would seem to have overshot the existing macro data, suggesting that further growth deterioration has been priced in to some extent.
Exhibit 2: Growth slows, market follows
MSCI World (performance, yoy) vs. Global manufacturing PMI
60% |
|
|
MSCI World (performance, yoy) |
|
|
|
|
|
61 |
||||||
|
|
Global manufacturing PMI (RHS) |
|
|
|
|
|
||||||||
50% |
|
|
|
|
|
|
|
|
|||||||
|
|
|
|
|
|
|
|
|
|
|
|
|
|
58 |
|
40% |
|
|
|
|
|
|
|
|
|
|
|
|
|
|
|
|
|
|
|
|
|
|
|
|
|
|
|
|
|
|
|
30% |
|
|
|
|
|
|
|
|
|
|
|
|
|
|
55 |
20% |
|
|
|
|
|
|
|
|
|
|
|
|
|
|
|
10% |
|
|
|
|
|
|
|
|
|
|
|
|
|
|
52 |
|
|
|
|
|
|
|
|
|
|
|
|
|
|
|
|
0% |
|
|
|
|
|
|
|
|
|
|
|
|
|
|
49 |
|
|
|
|
|
|
|
|
|
|
|
|
|
|
|
|
-10% |
|
|
|
|
|
|
|
|
|
|
|
|
|
|
|
-20% |
|
|
|
|
|
|
|
|
|
|
|
|
|
|
46 |
-30% |
|
|
|
|
|
|
|
|
|
|
|
|
|
|
43 |
-40% |
|
|
|
|
|
|
|
|
|
|
|
|
|
|
|
|
|
|
|
|
|
|
|
|
|
|
|
|
|
|
|
-50% |
|
|
|
|
|
|
|
|
|
|
|
|
|
|
40 |
88 |
90 |
92 |
94 |
96 |
98 |
00 |
02 |
04 |
06 |
08 |
10 |
12 |
14 |
16 |
18 |
Exhibit 3: Cyclicals vs. Defensives performance points to a lower level for the Global PMI
World Cyclicals vs. Defensives relative to global manufacturing PMI
40% |
|
Cyclicals vs. Defensives (yoy) |
|
Global PMI (RHS) |
60 |
|||||
30% |
|
|
|
|
|
|
|
|
|
58 |
20% |
|
|
|
|
|
|
|
|
|
56 |
|
|
|
|
|
|
|
|
|
|
|
10% |
|
|
|
|
|
|
|
|
|
54 |
|
|
|
|
|
|
|
|
|
|
|
0% |
|
|
|
|
|
|
|
|
|
52 |
|
|
|
|
|
|
|
|
|
50 |
|
|
|
|
|
|
|
|
|
|
|
|
-10% |
|
|
|
|
|
|
|
|
|
48 |
|
|
|
|
|
|
|
|
|
|
|
-20% |
|
|
|
|
|
|
|
|
|
46 |
|
|
|
|
|
|
|
|
|
|
|
-30% |
|
|
|
|
|
|
|
|
|
44 |
-40% |
|
|
|
|
|
|
|
|
|
42 |
98 |
00 |
02 |
04 |
06 |
08 |
10 |
12 |
14 |
16 |
18 |
Source: Datastream, Haver Analytics, Goldman Sachs Global Investment Research |
Source: Datastream, Haver Analytics, Goldman Sachs Global Investment Research |
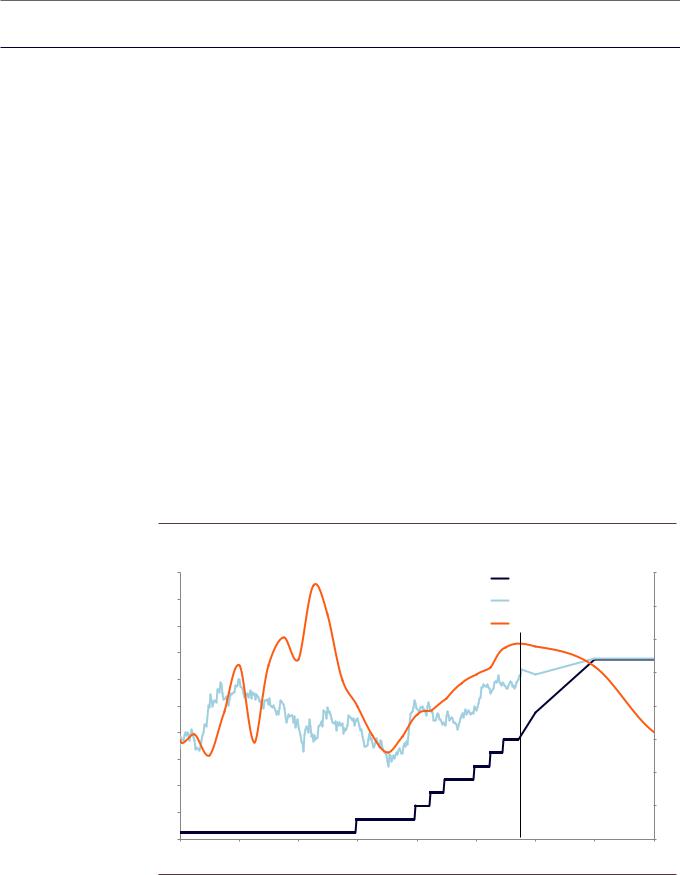
2) A sharp decline is often followed by a bounce
We often see slightly higher volatility and a peak followed by a correction, and then another peak around the top of a bull market. We have seen corrections twice this year: in January and then again in October. Bear markets do not tend to occur in straight lines. There is nearly always a bounce after the initial decline, providing investors with another opportunity to reduce risks if there are sufficient signals at the time to suggest a further decline is likely. The profile of the average bear market (starting in the post-war period and using US data) is shown in Exhibit 4.
9 November 2018 |
3 |
vk.com/id446425943
Goldman Sachs
Global Macroscope
Exhibit 4: The ‘typical’ profile of the ‘Bear Market Bounce’
Average returns and average length of US bear market (ex 1998); data start one year before the peak
150 |
|
Last year of Bull Market |
|
|
|
|
Bear Market |
|
||
|
|
|
|
|
|
|||||
|
|
|
|
|
|
|
||||
140 |
|
|
+22% |
|
|
|
|
|
-34% |
|
|
|
|
|
|
|
|
|
|
|
|
130 |
|
|
|
|
|
|
|
|
|
|
120 |
|
|
|
|
|
|
|
|
|
|
110 |
|
|
|
|
|
|
|
|
|
|
100 |
|
|
|
|
|
|
|
|
|
|
90 |
|
|
|
|
|
|
|
|
|
|
80 |
|
|
|
|
|
’volatile period’ |
|
|
|
|
|
|
|
|
|
|
|
|
|
|
|
70 |
|
|
|
|
|
-9% and +8% |
|
|
|
|
60 |
|
|
|
|
1 year |
|
|
|
|
|
50 |
|
|
|
|
|
|
|
Number of days |
||
0 |
100 |
200 |
300 |
400 |
500 |
600 |
700 |
800 |
||
Source: Bloomberg, Goldman Sachs Global Investment Research
Exhibit 4 shows an average profile, with the range of experiences in the blue shaded area. However, this is an oversimplification because the period over which the bounce occurs does vary, and sometimes the market has a correction and then a rally even before the actual peak (1987 and 2007 are examples). On most other occasions the market correction comes after the peak; this tends to be followed by a bounce as the market recovers towards the peak before reversing again. But the common factor in
all cases is that, with the exception of 1998, a correction and bounce can be clearly
observed. Exhibit 5 shows this experience for each of the US bear markets since 1960.
Exhibit 5: US bear markets tend to start with a fall, then bounce within a few months, before the dramatic final fall
Start |
|
1st Drop |
|
Bounce |
|
Subsequent drop |
|||
1st peak |
|
# Months |
% down |
|
# Months |
% up |
|
# Months |
% down |
|
from 1st peak |
from 1st peak |
|
from 1st peak |
from bottom |
|
from 1st peak |
from 1st peak |
|
Dec-61 |
1.6 |
-7% |
3.0 |
5% |
6.4 |
-28% |
|||
Feb-66 |
1.1 |
-7% |
2.3 |
6% |
7.9 |
-22% |
|||
Nov-68 |
3.5 |
-10% |
5.4 |
8% |
17.8 |
-36% |
|||
Jan-73 |
7.3 |
-16% |
9.0 |
11% |
20.7 |
-48% |
|||
Sep-76 |
1.6 |
-8% |
3.3 |
9% |
17.4 |
-19% |
|||
Nov-80 |
2.8 |
-10% |
3.8 |
8% |
20.4 |
-27% |
|||
Aug-87* |
0.9 |
-8% |
1.3 |
6% |
3.3 |
-34% |
|||
Jun-90* |
0.7 |
-4% |
1.4 |
5% |
4.2 |
-20% |
|||
Jul-98** |
- |
- |
- |
- |
- |
- |
|||
Mar-00 |
0.7 |
-11% |
5.3 |
12% |
30.5 |
-49% |
|||
Jul-07* |
0.9 |
-9% |
2.7 |
11% |
19.6 |
-56% |
|||
Median |
|
1.3 |
-9% |
|
3.2 |
8% |
|
17.6 |
-31% |
Average |
|
2.1 |
-9% |
|
3.8 |
8% |
|
14.8 |
-34% |
*This first peak is not our official 'start date' for the bear market
**There was no bear market bounce during the 1998 bear market
Source: Bloomberg, Goldman Sachs Global Investment Research
9 November 2018 |
4 |
vk.com/id446425943
Goldman Sachs
Global Macroscope
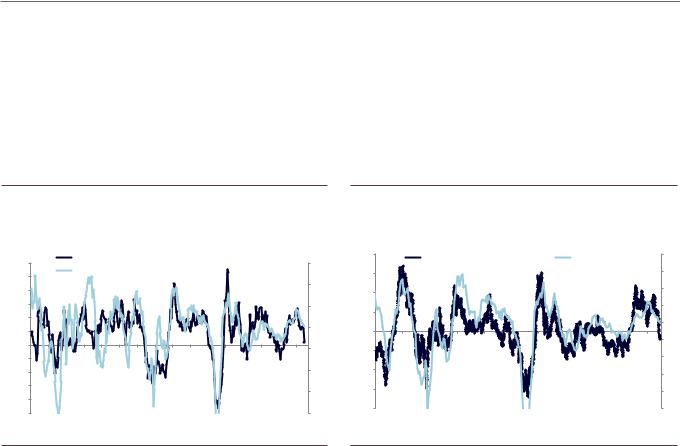
The average decline in the first correction is 9% over 2 months but the average bounce after that is almost as large over a further 2 months, before an eventual further decline of 34%. In reality, the final sharp down-leg of the bear market rarely comes in one straight line; it could also have a number of rallies along the way, although these are typically not as strong as the initial bounce and do not take the market close to previous highs. What can explain the initial bounce? There are generally two explanations:
1)Late in the bull market investors are unclear about small corrections; they often perceive them as buying opportunities and are worried about missing such opportunities to increase returns.
2)The bounce usually comes before there is any real ‘confirmation’ in the hard macro data that the initial correction is justified. When data start to confirm the justification for an initial market decline, prices tend to fall back further. Interestingly, EPS on average tends to start to fall 5 months after the peak of the market (although, as we discuss later, there is a wide variation around this).
The risk, therefore, is that from these levels the market enjoys a short-term rally
but this becomes a signal to sell rather than buy the market.
Exhibit 6: A sharp decline is often followed by a bounce
105 |
Average Bear Markets (>-20%) |
|
|
|
|
|
|
|
|
|
|||
|
|
|
|
|
|
|
|
|
|
||||
|
Average Corrections (>-10% but <-20%) |
|
|
|
|
|
|
|
|
||||
100 |
Current |
|
|
|
|
|
|
|
|
|
|
|
|
95 |
|
|
|
|
|
|
|
|
|
|
|
|
|
90 |
|
|
|
|
|
|
|
|
|
|
|
|
|
85 |
|
|
|
|
|
|
|
|
|
|
|
|
|
80 |
|
|
|
|
|
|
|
|
|
|
|
|
|
75 |
|
|
|
|
|
|
|
|
|
|
|
|
|
-52w |
-44w |
-36w |
-28w |
-20w |
-12w |
-4w |
+4w |
+12w |
+20w |
+28w |
+36w |
+44w |
+52w |
Source: Bloomberg, Goldman Sachs Global Investment Research
3) The GS Bear Market Risk Indicator is at elevated levels
In Global Strategy Paper: Bear Necessities; identifying signals for the next bear market, 13 September 2017, we constructed a bull/bear indicator based on the common pattern of a number of variables around the peak of previous bull markets. Many of the variables we looked at were unreliable as lead indicators of turning points in equity markets: either they showed no consistent pattern prior to market turning points, or they gave no lead in real time or too many false positives. Instead, we found that many bull market peaks were associated with a combination of conditions based on five factors: the
9 November 2018 |
5 |

vk.com/id446425943
Goldman Sachs
Global Macroscope
labour market, growth momentum, valuation, term structure of the yield curve
and inflation.
In summary, the very low levels of unemployment (particularly in the US) scored as a high risk in the index. This is because low unemployment is normally associated with rising wages, margin pressure and tighter monetary policy. Also, every post-war US recession has been preceded by only modest rises in unemployment from very low levels (a third of 1%). Very strong growth momentum (measured by the ISM as an example) also flags as a risk. Of course, strong economic activity is generally a good thing for equity markets. However, very strong activity is typically followed by slower growth which, when combined with other factors (in particular much higher interest rates), can weaken equity prices. The third stretched factor on many metrics was valuation. High valuations in isolation do not provide much of a timing signal for investors but, again, when combined with other factors can indicate risks of a correction or possible bear market.
To aggregate these variables in a signal indicator, we took each variable and calculated its percentile relative to its history since 1948. For the yield curve and unemployment, we took the lowest percentiles relative to history, and for the other indicators we took the highest (Exhibit 7).
Exhibit 7: Our Bear Market Risk Indicator
Current level of GS Bear Market Risk Indicator’s sub-components
|
Level |
Percentile |
Unemployment |
3.7 |
94% |
Shiller PE |
30.9 |
93% |
ISM |
57.7 |
76% |
Term Structure of Yield Curve |
0.9 |
66% |
Core Inflation |
2.2 |
36% |
|
|
|
GS Bear Market Risk Indicator |
|
73% |
* 100 percentile means these variables are at their highest level except for SYC and
Unemployment where 100% means they are at their lowest.
Source: Haver, Bloomberg, Goldman Sachs Global Investment Research
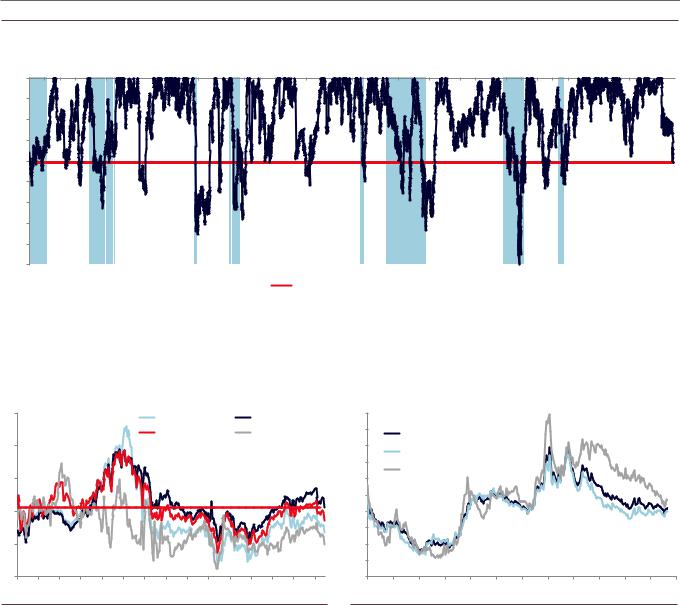
Our aggregate Bear Market Risk Indicator shows the average of these factors. Historically, when the Indicator rises above 60% it is a good signal to investors to turn cautious, or at the very least recognise that a correction followed by a rally is more likely to be followed by a bear market than when these indicators are low. By the same token, when the Indicator is very low, below 40% (as was the case in 1975, 1982 and 2009), investors should see any market weakness as an opportunity to buy.
9 November 2018 |
6 |
vk.com/id446425943
Goldman Sachs
Global Macroscope
Exhibit 8: GS Bull/Bear Market Risk Indicator
Average percentile (in US) for ISM, Slope of yield curve, core inflation, unemployment and Shiller P/E
100%
|
US Bear Market |
|
GS Bull/Bear Market Indicator |
|
|
90%
73%
80%
70%
60%
50%
40%
30%
20%
10%
0%
55 |
60 |
65 |
70 |
75 |
80 |
85 |
90 |
95 |
00 |
05 |
10 |
15 |
Source: Shiller, Haver Analytics, Datastream, Goldman Sachs Global Investment Research
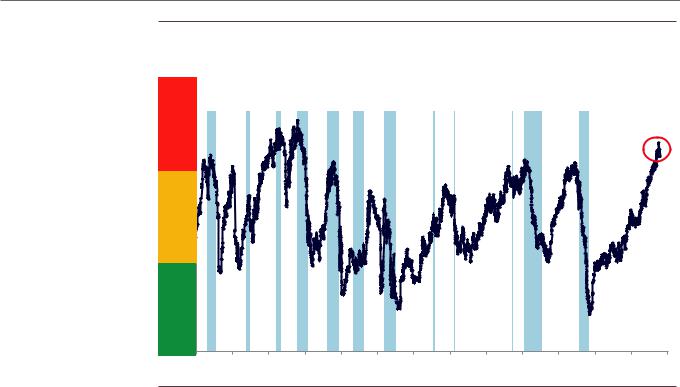
The signal is red - should we worry?
What does a high indicator mean? The average return on US equities in any 12-month period since the 1950s has been 9%. We show in Exhibit 9 what average forward returns have been conditional on the level of our Bear Market Risk Indicator.
If the indicator is very low, at <20%, then on average equities enjoy returns of
20-25% over the next 12 months. But once the indicator rises to 40-60% then the
average return becomes close to the longer-term average of c.9% over 12 months.
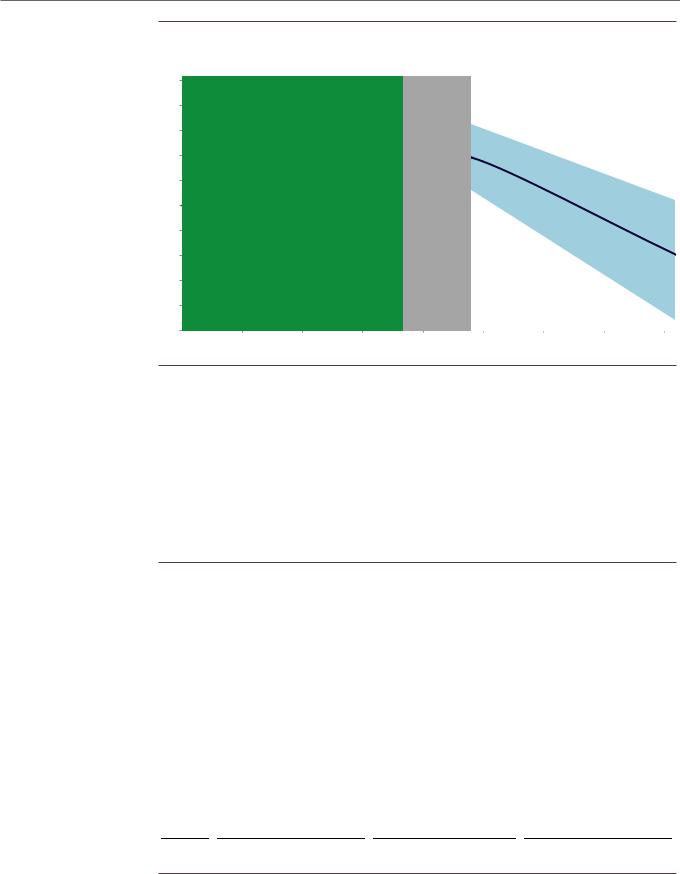
What if the indicator is high? Above 60% and 12-month subsequent returns do tend to fall. We are currently at 73% and this is consistent historically with zero average returns over the next 12 months. Of course, there is a large range around this. Moreover, this tends to give the impression of a flat market, whereas it could be anything but flat - a good deal of volatility with various drawdowns could still be consistent with zero returns over the year.
In Exhibit 10 we show the maximum drawdown over the following 2 years conditional on the starting point of our Bear Market Risk Indicator (the vertical orange lines show what the indicator would be using the US Shiller P/E as the valuation varaible or the simple P/E ratio). At the current level of our Indicator, the maximum drawdown has
been about 15% historically.
9 November 2018 |
7 |
vk.com/id446425943
Goldman Sachs
Global Macroscope
Exhibit 9: The signal is red - should we worry?
Median 12m fwd return (since 1955, median on a +/- 10% band)
Exhibit 10: The signal is red - should we worry?
Median 24m max drawdown (since 1955, median on a +/- 10% band)
25% |
|
|
|
|
Current |
|
Current |
|
|
|
|
|
|
using |
|
using |
|
20% |
|
|
|
|
LTM P/E |
|
Shiller P/E |
|
15% |
|
|
|
|
|
|
|
|
10% |
|
|
|
|
|
|
|
|
Unconditional Median |
|
|
|
|
|
|
||
5% |
|
|
|
|
|
|
|
|
0% |
|
|
|
|
|
|
|
|
-5% |
|
|
|
|
|
|
|
|
-10% |
|
|
|
|
|
|
|
|
10% |
20% |
30% |
40% |
50% |
60% |
70% |
80% |
90% |
GS Bull/Bear Market Indicator
0% |
|
|
|
|
|
Current |
|
Current |
|
-2% |
|
|
|
|
|
|
|
||
|
|
|
|
|
using |
|
using |
|
|
-4% |
|
|
|
|
|
LTM P/E |
|
Shiller P/E |
|
-6% |
|
|
|
|
|
|
|
|
|
-8% |
Unconditional Median |
|
|
|
|
|
|
||
-10% |
|
|
|
|
|
|
|
|
|
-12% |
|
|
|
|
|
|
|
|
|
-14% |
|
|
|
|
|
|
|
|
|
-16% |
|
|
|
|
|
|
|
|
|
-18% |
|
|
|
|
|
|
|
|
|
-20% |
10% |
20% |
30% |
40% |
50% |
60% |
70% |
80% |
90% |
|
|||||||||
GS Bull/Bear Market Indicator
Source: Goldman Sachs Global Investment Research |
Source: Goldman Sachs Global Investment Research |
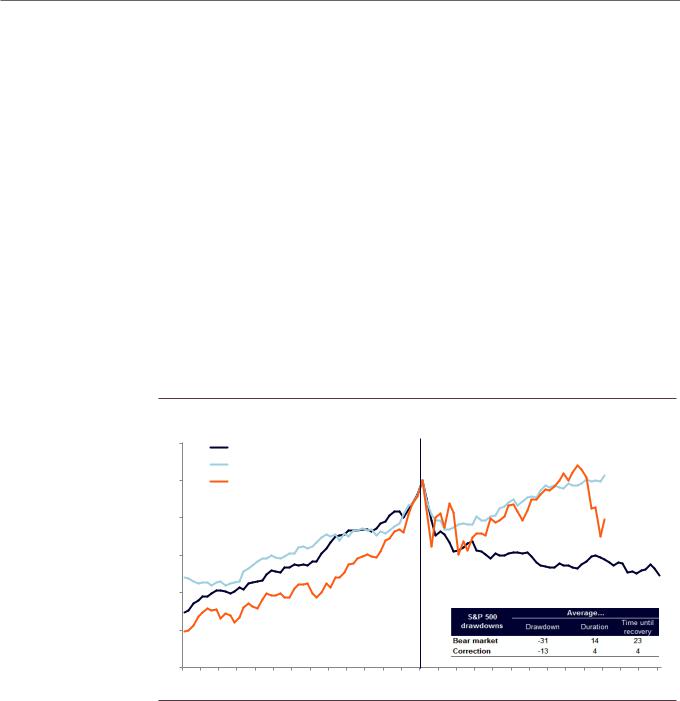
Even though the Indicator is flashing red currently (73%), there remain good reasons why this indicator has been consistent with a sharp correction rather than the start of a prolonged bear market. In our recent piece, Global Strategy Paper: Making Cents; The Cycle & the Return of Low Return, we discussed two likely scenarios from here:
nA cathartic bear market across financial markets. This has been the typical pattern when this indicator has reached such lofty levels in the past. It would most likely be triggered by rising interest rates (and higher inflation), reversing the common factor that has fuelled financial asset valuations and returns over recent years, or a sharper than expected decline in growth. Such a bear market could then ‘re-base’ valuations to a level where a new strong recovery cycle can emerge.
nA long period of relatively low returns across financial assets. This would imply a period of low returns without a clear trend in the market.
A number of factors suggest that a flatter return for longer may be more likely:
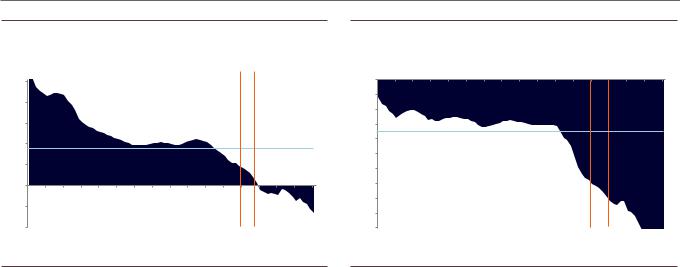
1) Valuation, measured using a Shiller P/E, is one of the most stretched factors in the Indicator – other factors such as inflation appear more reasonable. And even in the case of valuation it may not be as stretched as is widely assumed. The Shiller P/E is high but standard 12m forward P/E multiples have fallen across regions (Exhibit 11 and 12), and on a FCF yield basis valuations (even in the US) are around average. Of course, this is a little circular - if valuations have come down in anticipation of declining EPS (and this proves to be correct), the ‘cheapness’ we currently see could be an illusion.
9 November 2018 |
8 |
vk.com/id446425943
Goldman Sachs
Global Macroscope
Exhibit 11: Valuation de-rating in equities is one of the largest outside of a bear market
MSCI World NTM P/E change since last 12-month peak in valuation
0% |
|
|
|
|
|
|
|
|
|
|
|
|
|
|
|
|
|
|
|
|
|
|
|
|
|
|
|
|
|
|
|
|
|
|
|
|
|
|
|
|
|
-5% |
|
|
|
|
|
|
|
|
|
|
|
|
|
|
|
|
|
|
|
|
|
|
|
|
|
|
|
|
|
|
|
|
|
|
|
|
|
|
|
|
|
-10% |
|
|
|
|
|
|
|
|
|
|
|
|
|
|
|
|
|
|
|
|
|
|
|
|
|
|
|
|
|
|
|
|
|
|
|
|
|
|
|
|
|
-15% |
|
|
|
|
|
|
|
|
|
|
|
|
|
|
|
|
|
|
|
|
|
|
|
|
|
|
|
|
|
|
|
|
|
|
|
|
|
|
|
|
|
-20% |
|
|
|
|
|
|
|
|
|
|
|
|
|
|
|
|
|
|
|
|
|
|
|
|
|
|
|
|
|
|
|
|
|
|
|
|
|
|
|
|
|
-25% |
|
|
|
|
|
|
|
|
|
|
|
|
|
|
|
|
|
|
|
|
|
|
|
|
|
|
|
|
|
|
|
|
|
|
|
|
|
|
|
|
|
-30% |
|
|
|
|
|
|
|
|
|
|
|
|
|
|
|
|
|
|
|
|
|
|
|
|
|
|
|
|
|
|
|
|
|
|
|
|
|
|
|
|
|
-35% |
|
|
|
|
|
|
|
|
|
|
|
|
|
|
|
|
|
|
|
|
|
|
|
|
|
|
|
|
|
|
|
|
|
|
|
|
|
|
|
|
|
-40% |
|
|
|
|
|
|
|
|
|
|
|
|
|
|
|
|
|
|
|
|
|
|
|
|
|
|
|
|
|
|
|
|
|
|
|
|
|
|
|
|
|
-45% |
|
|
|
|
|
|
|
|
|
|
|
|
|
|
|
|
|
|
|
|
|
|
|
|
|
|
|
|
|
|
|
|
|
|
|
|
|
|
|
|
|
77 |
78 |
79 |
80 |
81 |
82 |
83 |
84 |
85 |
86 |
87 |
88 |
89 |
90 |
91 |
92 |
93 |
94 |
95 |
96 |
97 |
98 |
99 |
00 |
01 |
02 |
03 |
04 |
05 |
06 |
07 |
08 |
09 |
10 |
11 |
12 |
13 |
14 |
15 |
16 |
17 |
18 |
|
|
Bear market (correction >20%) |
Current valuation reset |
|
Valuation reset since last 12m high |
||
|
|
|
|||||
Note: NTM P/E based on S&P 500 data before 1988 |
|
|
|
|
|
||
|
|
|
|
|
|
||
Source: I/B/E/S, Datastream, Goldman Sachs Global Investment Research |
|
|
|
|
|
||
|
|
|
|
||||
Exhibit 12: Equities are adjusting to ‘normal’ levels |
|
Exhibit 13: US Tech FCF Yield is in line with S&P 500 |
|||||
12-month forward P/E |
|
FCF yield of S&P and Tech since 1990 |
|||||
30 |
|
|
|
|
|
|
EURO STOXX 50 |
|
S&P 500 |
|
10 |
|||
|
|
|
|
|
|
|
|
|
|
|||||
|
|
|
|
|
|
|
MSCI AC World |
|
MSCI EM |
|
9 |
|||
25 |
|
|
|
|
|
|
|
|
|
|
|
|
|
8 |
|
|
|
|
|
|
|
|
|
|
|
|
|
|
7 |
20 |
|
|
|
|
|
|
|
|
|
|
|
|
|
6 |
|
|
|
|
|
|
|
|
|
|
|
|
|
|
5 |
15 |
|
|
|
|
|
|
|
|
|
|
|
|
|
4 |
|
|
|
|
|
|
|
|
|
|
|
|
|
|
3 |
10 |
|
|
|
|
|
|
|
|
|
|
|
|
|
2 |
|
|
|
|
|
|
|
|
|
|
|
|
|
|
1 |
5 |
|
|
|
|
|
|
|
|
|
|
|
|
|
0 |
90 |
92 |
94 |
96 |
98 |
00 |
02 |
04 |
06 |
08 |
10 |
12 |
14 |
16 |
18 |
|
|
|
|
|
FCF Yield |
|
|
|
|
|
|
|
|
S&P 500 |
|
|
|
|
|
|
|
|
|
|
|
S&P ex Info Tech |
|
|
|
|
|
|
|
||
|
|
Info Tech |
|
|
|
|
|
|
|
|
|
95 |
97 |
99 |
01 |
03 |
05 |
07 |
09 |
11 |
13 |
15 |
17 |
Source: Datastream, Worldscope, Goldman Sachs Global Investment Research |
Source: Datastream, Goldman Sachs Global Investment Research |
2) We expect growth to slow - but do not forecast a recession
This really is the crux of the issue. While this has been a very weak economic cycle
compared with history, it is likely to be a prolonged one.
For recessions to occur we would likely either need a sharp rise in inflation and
therefore interest rates, and/or a significant private sector deleveraging cycle.
While our US economists expect policy rates to rise five times between now and end-2019, well above the forwards, this would not be enough in their view to trigger a recession. Instead, it would result in a necessary slowdown of growth to limit the risks of an inflation overshoot given the tight labour market.
As a consequence of low inflation, there has been a trend lower in volatility and
longer expansion phases in economic cycles since the 1980s.
9 November 2018 |
9 |
vk.com/id446425943
Goldman Sachs
Global Macroscope
Exhibit 14: Recession probability rises from low levels |
Exhibit 15: Volatility of US GDP growth, inflation and unemployment |
United States Recession Risk |
rates has declined, especially since the 1980s |
|
5-year rolling volatility |
100 |
|
|
|
|
|
|
|
100 |
14 |
|
|
|
|
|
|
Inflation |
|
|
|
8 |
|
|
|
|
|
|
|
% |
|
|
|
|
|
|
|
|
|
|
|
||||
% |
|
|
|
|
|
|
|
|
|
|
|
|
|
|
|
|
|
|
|
7 |
|
90 |
|
|
|
|
|
|
|
90 |
12 |
|
|
|
|
|
|
GDP growth |
|
|
|||
|
|
|
|
|
|
Current |
|
|
|
|
|
|
|
|
|
||||||
80 |
|
|
|
|
|
|
80 |
|
|
|
|
|
|
|
Unemployment rate (RHS) |
6 |
|||||
|
|
|
|
|
|
1 Year |
10 |
|
|
|
|
|
|
||||||||
70 |
|
|
|
|
|
|
70 |
|
|
|
|
|
|
|
|
|
|
|
|
||
|
|
|
|
|
|
2 Year |
|
|
|
|
|
|
|
|
|
|
|
|
5 |
||
60 |
|
|
|
|
|
|
60 |
8 |
|
|
|
|
|
|
|
|
|
|
|
||
|
|
|
|
|
|
|
|
|
|
|
|
|
|
|
|
|
|
|
|||
|
|
|
|
|
|
|
|
|
|
|
|
|
|
|
|
|
|
|
|
|
|
50 |
|
|
|
|
|
|
|
50 |
|
|
|
|
|
|
|
|
|
|
|
|
4 |
40 |
|
|
|
|
|
|
|
40 |
6 |
|
|
|
|
|
|
|
|
|
|
|
3 |
|
|
|
|
|
|
|
|
|
|
|
|
|
|
|
|
|
|
|
|||
30 |
|
|
|
|
|
|
|
30 |
|
|
|
|
|
|
|
|
|
|
|
|
|
|
|
|
|
|
|
|
4 |
|
|
|
|
|
|
|
|
|
|
|
|
||
20 |
|
|
|
|
|
|
|
20 |
|
|
|
|
|
|
|
|
|
|
|
2 |
|
|
|
|
|
|
|
|
|
|
|
|
|
|
|
|
|
|
|
|
|||
|
|
|
|
|
|
|
|
|
|
|
|
|
|
|
|
|
|
|
|
||
10 |
|
|
|
|
|
|
|
10 |
2 |
|
|
|
|
|
|
|
|
|
|
|
1 |
|
|
|
|
|
|
|
|
|
|
|
|
|
|
|
|
|
|
|
|
|
|
0 |
|
|
|
|
|
|
|
0 |
|
|
|
|
|
|
|
|
|
|
|
|
|
1986 |
1990 |
1994 |
1998 |
2002 |
2006 |
2010 |
2014 |
2018 |
0 |
|
|
|
|
|
|
|
|
|
|
|
0 |
|
|
|
|
|
|
|
|
|
1900 |
1910 |
1920 |
1930 |
1940 |
1950 |
1960 |
1970 |
1980 |
1990 |
2000 |
2010 |
|
Source: Haver Analytics, Bloomberg, Goldman Sachs Global Investment Research |
Source: GFD, Jorda-Schularick-Taylor Macrohistory Database, Goldman Sachs Global Investment |
Research
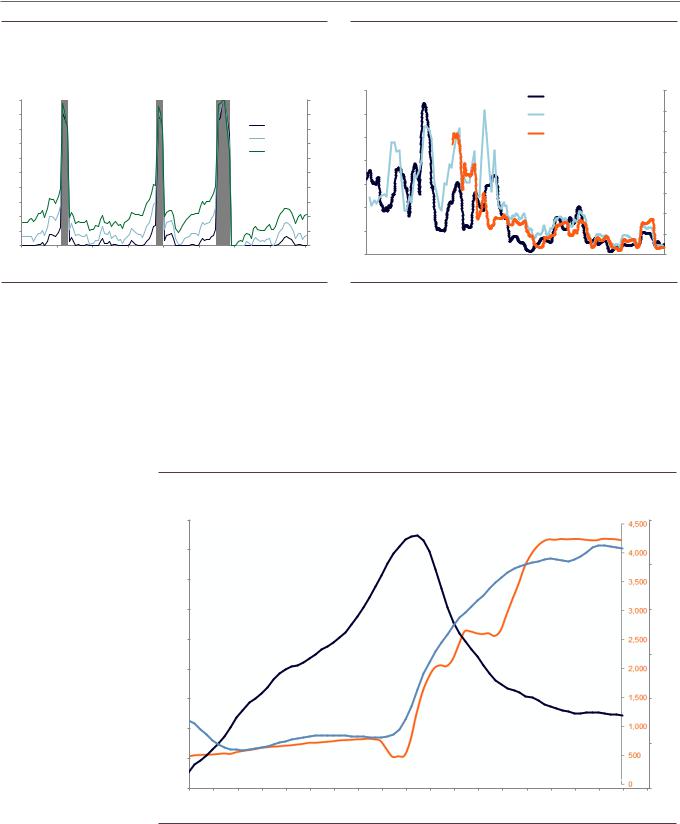
Furthermore, we do not see problematic financial imbalances. Rather encouragingly, as a result of policy intervention, much of these imbalances have moderated. While elevated debt levels have not disappeared, in general they have largely shifted away from the private sector into the official sector, to central banks’ balance sheets and to governments, where the risk of a disorderly unwind seem more remote (see US Economics Analyst: Recession Risk Report: A Narrow Runway for a Soft Landing, 13 July 2018).
Exhibit 16: Imbalances have shifted from the private sector to the public sector and central banks
270% |
|
|
|
|
|
|
|
|
|
|
|
Total Fed Holdings - USD bn |
|
|
90% |
||||
|
US Households and Corporations |
|
|
|
|
|
|
|
|||||||||||
|
|
|
|
|
(RHS) |
|
|
|
|
|
|
|
|||||||
260% |
(including Financials) Debt / GDP |
|
|
|
|
|
|
|
|
|
|
|
|
||||||
|
|
|
|
|
|
|
|
|
|
|
|
|
|
|
|
|
|
|
|
|
|
|
|
|
|
|
|
|
|
|
|
|
|
|
|
|
|
|
80% |
250% |
|
|
|
|
|
|
|
|
|
|
|
|
|
|
|
|
|
|
|
240% |
|
|
|
|
|
|
|
|
|
|
|
|
|
|
|
|
|
|
70% |
230% |
|
|
|
|
|
|
|
|
|
|
|
|
|
|
|
|
|
|
|
|
|
|
|
|
|
|
|
|
|
|
|
|
|
|
|
|
|
|
60% |
220% |
|
|
|
|
|
|
|
|
|
|
|
|
|
|
|
|
|
|
|
210% |
|
|
US Government Debt / GDP (RHS) |
|
|
|
|
|
|
|
|
|
50% |
||||||
200% |
|
|
|
|
|
|
|
|
|
|
|
|
|
|
|
|
|
|
|
|
|
|
|
|
|
|
|
|
|
|
|
|
|
|
|
|
|
|
40% |
190% |
|
|
|
|
|
|
|
|
|
|
|
|
|
|
|
|
|
|
|
180% |
|
|
|
|
|
|
|
|
|
|
|
|
|
|
|
|
|
|
30% |
00 |
01 |
02 |
03 |
04 |
05 |
06 |
07 |
08 |
09 |
10 |
11 |
12 |
13 |
14 |
15 |
16 |
17 |
18 |
19 |
Source: Haver Analytics, Goldman Sachs Global Investment Research
Without a recession, low returns are more likely than a sustained bear market
Our view about the prospects for low returns is based on the idea that, without a recession, a bear market is not very likely. As we discussed in our ‘Making Cents’
9 November 2018 |
10 |