

GS Metals Monitor_watermark
.pdfvk.com/id446425943
5 November 2018 | 3:43PM EST
Metals Monitor
Flicker of hope
Metals higher on trade news
Trade tensions have been the predominant driver of the metals market this year. On Friday, news about President Trump having a “long and very good call” with President Xi lifted market sentiment and copper prices jumped 3% on the day. Our economists think US-China trade disputes are difficult to resolve quickly. Recent experience of trade talks with the European Union, Canada, and Mexico also suggest that tariffs are likely to stay even with progress in trade negotiations. That said, we think trade tensions impact asset prices more because of heightened uncertainties than tariffs per se. To the extent that positive headlines on the US-China relationship improve market sentiment, we see metals prices being driven higher.
China slowing and easing coming
The October official manufacturing PMI fell to the lowest level since July 2016. September auto sales fell 12% year-over-year. Our China Metals Consumption Index (MCI) dropped to 0%. As we have discussed before, Westerners tend to react to hard data while onshore investors are more forward looking. Recent price weakness partially reflects Westerners “catching down” to onshore sentiment. However, we think this may be too much of “looking into
the rear-view mirror”. Our client conversations suggest onshore sentiment improving on the margin in light of the latest policy easing announcements. Our economists expect more infrastructure investment in 2019 to offset weakness in consumption and exports.
A month of convergence trades
This month’s market movements can be characterized as “convergence trades” on multiple fronts. US stocks, which had beaten other equity markets in returns, fell c.10% in October. Energy commodities, which had outshone other commodities, became the worst-performing sector. Within metals, aluminum and nickel, which had held up better than copper and zinc, underperformed.
Iron ore premium fell
After posting all-time highs, both high-grade premium and pellet premium fell notably in October. This is consistent with our model prediction. We add a page on grade and product premiums (page 26).
Hui Shan
+1(212)902-4447 | hui.shan@gs.com Goldman Sachs & Co. LLC
Anna Zandi
+44(20)7552-9350 | anna.zandi@gs.com Goldman Sachs International
Mikhail Sprogis
+44(20)7774-2535 | mikhail.sprogis@gs.com Goldman Sachs International
Jeffrey Currie
+1(212)357-6801 | jeffrey.currie@gs.com Goldman Sachs & Co. LLC
Investors should consider this report as only a single factor in making their investment decision. For Reg AC certification and other important disclosures, see the Disclosure Appendix, or go to www.gs.com/research/hedge.html.

vk.com/id446425943
Goldman Sachs
Metals Views: Metals are oversold
Metals Monitor
Copper:Too much pessimism baked in the price (3/6/12-month forecasts of $6500/7000/7000/t): Copper fundamentals remain solid. Despite the recent softness in the Yangshan copper premium and the loosening of the China scrap market, Chinese demand is healthy and inventory continues to fall globally. The micro and macro divergence that drove the copper market this year still rings true. Recently, copper prices moved sharply on US-China trade negotiation news. In our view, the $5800-6300/t range we saw in the past three months reflects too bearish a view on the macro front. Much of the market concerns, whether a potential China slowdown, continued USD strength, or escalating trade tensions, were mostly priced in. While our supply and demand estimates point to a balanced market in 2019, we expect copper prices to move higher from the spot as the macro worries lessen.
Aluminum: Market too relaxed about supply risks (3/6/12-month forecasts of $2200/2100/2000/t): Even with Alunorte still running at 50% capacity, Rusal sanctions, and China winter cuts beginning, the market is not pricing in any supply risks. Most recently, prices fell to c.$1950/t and our margins tracker suggests poor profitability for smelters in and outside of China. In fact, closure announcements for high-cost smelters are emerging (e.g., 300ktpa capacity in Spain and 400ktpa capacity in Gansu and Shanxi). While demand has been weaker than expected, the market is clearly in deficit and inventory continues to draw. In addition, money managers have significantly reduced long positions for aluminum. Overall, we see risks to aluminum prices skewed to the upside in the near term although our 12-month forecast is still anchored at $2000/t on China new capacity ramping up in Yunnan, Guangxi and Inner Mongolia.
Zinc: Still a very tight market (3/6/12-month forecasts of $3300/3000/2800/t): While the consensus is that zinc mine supply is on the rise and zinc prices should be falling over the next few years from its early-2018 high of $3500/t, there is much disagreement on both the degree and timing. On the bullish side, inventory is low and the forward curve is backwardated. On the bearish side, treatment charges (TC) are increasing. We expect higher zinc prices for three reasons. First, we put more emphasis on inventory than TC because higher TCs are related to smelter maintenance in China. Second, although mine supply is almost sure to climb, smelting capacity may be the next bottleneck. Higher zinc prices are needed to incentivize construction of new smelters. Third, sentiment on the macro picture has been quite bearish and improvements on this front should propel zinc higher.
Nickel: All eyes on Tsingshan HPAL (3/6/12-month forecasts of $15000/16000/18000/t): Fundamentals of nickel improved somewhat over the past few months. Production of 300-series stainless steel in China and Indonesia picked up in Q3. Stainless steel inventory in Wuxi and Foshan, while still elevated, is off the highs of early 2018. However, nickel prices fell c.25% in Q3, from close to $16000/t in June to below $12000/t now. The difference, in our view, is the prospect of new HPAL projects in Indonesia converting laterite ore into battery grade material. Already a number of companies, including
5 November 2018 |
2 |
vk.com/id446425943
Goldman Sachs
Metals Monitor
Tsingshan in collaboration with battery producers, have announced plans to build or expand HPAL facilities. These projects appear to be going forward even at current nickel prices, signaling potentially much lower costs than the market was expecting. While we agree that, if successful, these projects may be a game changer for EV battery and nickel prices, it is too early to price it in as the market currently does.
Iron ore: Policy-driven volatility (3/6/12-month forecasts of $70/60/60/t): After staying range-bound between $60/t and $70/t for six months, the 62% Fe iron ore price broke above $75/t in October. In our view, most of this is from policy-driven demand increases. The market interpreted the government announced that winter cuts will not be “one-size fits all” as a relaxation to steel production curtailment. Subsequently, the steel mill utilization rate increased and restocking demand drove iron ore prices higher. As the winter cuts officially begin in November, we expect prices to move lower. More specifically, a combination of rising supply and falling demand should take iron ore price below $70/t in Q4.
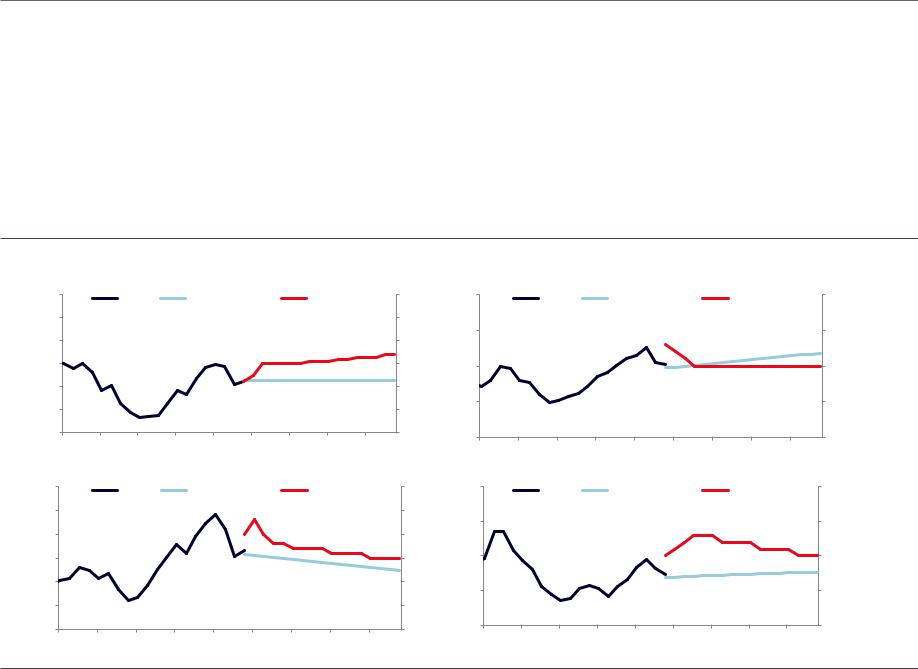
Exhibit 1: Base metals forecasts
$/t |
|
|
LME Copper Price |
|
|
$/t |
$/t |
|
|
LME Aluminum Price |
|
|
$/t |
||||||
10,000 |
|
Actual |
Forwards (Nov 2) |
|
GS Forecast |
10,000 |
3,000 |
|
Actual |
|
Forwards (Nov 2) |
|
GS Forecast |
3,000 |
|||||
9,000 |
|
|
|
|
|
|
|
|
9,000 |
2,500 |
|
|
|
|
|
|
|
|
2,500 |
8,000 |
|
|
|
|
|
|
|
|
8,000 |
|
|
|
|
|
|
|
|
||
|
|
|
|
|
|
|
|
|
|
|
|
|
|
|
|
|
|
||
7,000 |
|
|
|
|
|
|
|
|
7,000 |
2,000 |
|
|
|
|
|
|
|
|
2,000 |
6,000 |
|
|
|
|
|
|
|
|
6,000 |
|
|
|
|
|
|
|
|
|
|
5,000 |
|
|
|
|
|
|
|
|
5,000 |
1,500 |
|
|
|
|
|
|
|
|
1,500 |
|
|
|
|
|
|
|
|
|
|
|
|
|
|
|
|
|
|
||
4,000 |
|
|
|
|
|
|
|
|
4,000 |
1,000 |
|
|
|
|
|
|
|
|
1,000 |
2014 |
2015 |
2016 |
2017 |
2018 |
2019 |
2020 |
2021 |
2022 |
|
|
|
|
|
|
|
|
|
||
|
2014 |
2015 |
2016 |
2017 |
2018 |
2019 |
2020 |
2021 |
2022 |
|
|||||||||
|
|
|
|
|
|
|
|
|
|
|
|||||||||
$/t |
|
|
|
LME Zinc Price |
|
|
$/t |
$/t |
|
|
LME Nickel Price |
|
|
$/t |
|||||
4,000 |
|
Actual |
|
Forwards (Nov 2) |
|
GS Forecast |
4,000 |
25,000 |
|
Actual |
Forwards (Nov 2) |
|
GS Forecast |
25,000 |
|||||
|
|
|
|
|
|
|
|
|
|||||||||||
3,500 |
|
|
|
|
|
|
|
|
3,500 |
20,000 |
|
|
|
|
|
|
|
|
20,000 |
3,000 |
|
|
|
|
|
|
|
|
3,000 |
|
|
|
|
|
|
|
|
||
|
|
|
|
|
|
|
|
|
|
|
|
|
|
|
|
|
|
||
2,500 |
|
|
|
|
|
|
|
|
2,500 |
15,000 |
|
|
|
|
|
|
|
|
15,000 |
2,000 |
|
|
|
|
|
|
|
|
2,000 |
10,000 |
|
|
|
|
|
|
|
|
10,000 |
1,500 |
|
|
|
|
|
|
|
|
1,500 |
|
|
|
|
|
|
|
|
|
|
1,000 |
|
|
|
|
|
|
|
|
1,000 |
5,000 |
2015 |
2016 |
2017 |
2018 |
2019 |
2020 |
2021 |
2022 |
5,000 |
2014 |
2015 |
2016 |
2017 |
2018 |
2019 |
2020 |
2021 |
2022 |
|
2014 |
|
||||||||
|
|
|
|
|
|
|
|
|
|
|
|||||||||
Source: Goldman Sachs Global Investment Research
5 November 2018 |
3 |
vk.com/id446425943
Goldman Sachs
Metals Monitor
Markets Charts
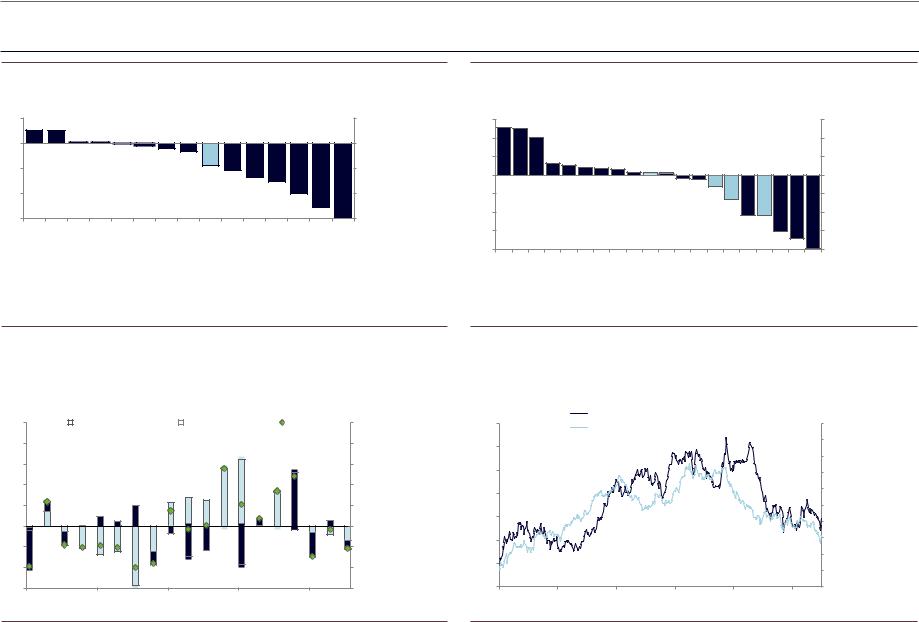
Exhibit 2: Cross-asset performance
% |
Month-over-month total returns by assets |
% |
5 |
|
5 |
0 |
|
|
|
|
|
|
|
|
|
|
|
|
|
0 |
-5 |
|
|
|
|
|
|
|
|
|
|
|
|
|
-5 |
-10 |
|
|
|
|
|
|
|
|
|
|
|
|
|
-10 |
-15 |
|
UST 5yr |
UST 2yr |
UST 10yr |
GSCI Live Stocks |
Corp IG |
Corp HY |
GSCI Industrial Metals |
|
|
|
GSCI |
S&P 500 Energy |
-15 |
GSCI Precious |
GSCI Agriculture |
S&P 500 Financials |
S&P 500 |
S&P 500 Materials |
GSCI Energy |
Exhibit 3: Cross-commodity performance
% |
Month-over-month total returns by commodity |
% |
|
|
15 |
|
|
|
|
|
|
|
|
|
|
|
|
|
|
|
|
|
|
15 |
10 |
|
|
|
|
|
|
|
|
|
|
|
|
|
|
|
|
|
|
10 |
5 |
|
|
|
|
|
|
|
|
|
|
|
|
|
|
|
|
|
|
5 |
0 |
|
|
|
|
|
|
|
|
|
|
|
|
|
|
|
|
|
|
0 |
-5 |
|
|
|
|
|
|
|
|
|
|
|
|
|
|
|
|
|
|
-5 |
-10 |
|
|
|
|
|
|
|
|
|
|
|
|
|
|
|
|
|
|
-10 |
-15 |
|
|
|
|
|
|
|
|
|
|
|
|
|
|
|
|
|
|
-15 |
-20 |
Cocoa |
|
|
Gold |
|
|
|
Silver |
|
|
|
Wheat |
|
|
|
|
|
WTI |
-20 |
Coffee |
Sugar |
Cotton |
Corn |
Lean Hogs |
Soybean |
Copper |
Nat Gas |
Live Cattle |
Zinc |
Nickel |
Heating Oil |
Aluminum |
Brent |
RBOB |
Source: Goldman Sachs Global Investment Research |
|
Source: Goldman Sachs Global Investment Research |
|
|
|
Exhibit 4: Supply demand decomposition of copper price changes |
|
Exhibit 5: Trade-weighted US Dollar index and S&P GSCI Industrial Metals price index |
% |
|
Decomposition of Daily Change in Copper Prices |
% |
|||
|
|
|
||||
25 |
|
Macro/Demand |
|
Micro/Supply |
Total |
25 |
|
|
|||||
|
|
|||||
20 |
|
|
|
20 |
15 |
|
|
|
15 |
10 |
|
|
|
10 |
5 |
|
|
|
5 |
0 |
|
|
|
0 |
-5 |
|
|
|
-5 |
-10 |
|
|
|
-10 |
-15 |
|
|
|
-15 |
2014 |
2015 |
2016 |
2017 |
2018 |
Index
S&P GSCI Industrial Metals Price
420 |
Trade-Weighted US Dollar (right, inverted) |
|
|
400 |
|
380 |
|
360 |
|
340 |
|
320 |
|
300 |
|
280 |
|
Jan-17 May-17 Sep-17 Jan-18 May-18 Sep-18
Index
100
102
104
106
108
110
112
114
116
118
120
Source: Goldman Sachs Global Investment Research |
Source: Goldman Sachs Global Investment Research |
5 November 2018 |
4 |
vk.com/id446425943
Goldman Sachs
Global Macro Charts
Metals Monitor
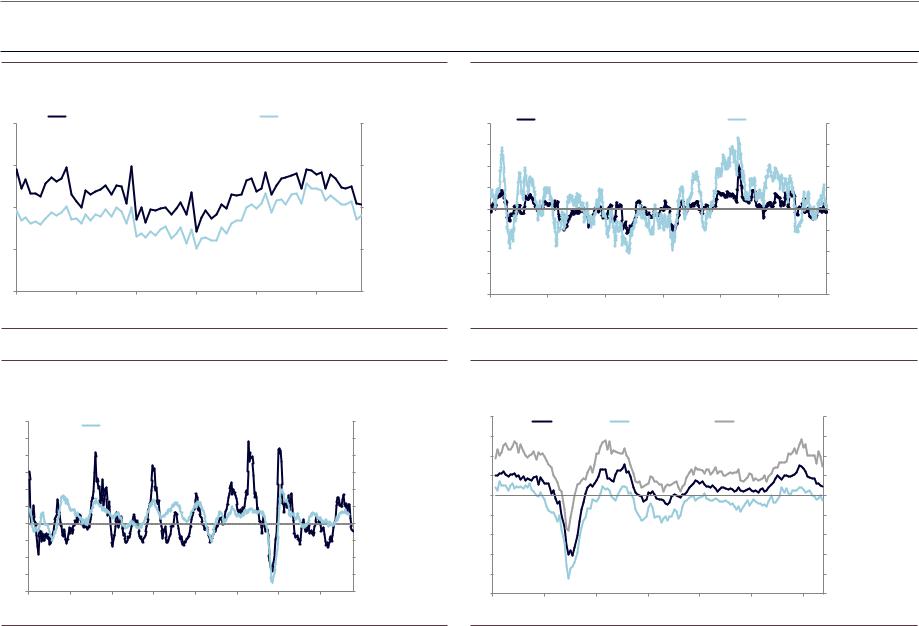
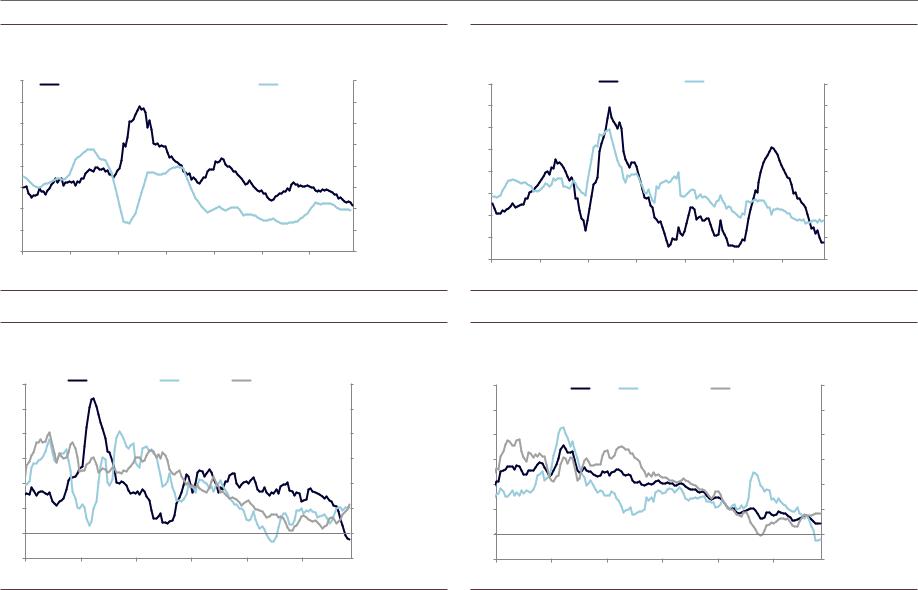
Exhibit 6: Global CAI and copper consumption weighted global CAI
% |
Copper Consumption Weighted Global CAI |
|
Global CAI |
% |
||
8 |
|
8 |
||||
|
|
|
|
|
||
6 |
|
|
|
|
|
6 |
4 |
|
|
|
|
|
4 |
2 |
|
|
|
|
|
2 |
0 |
|
|
|
|
|
0 |
2013 |
2014 |
2015 |
2016 |
2017 |
2018 |
|
Source: Goldman Sachs Global Investment Research
Exhibit 8: Global IP and S&P GSCI Industrial Metals
% |
|
YoY Pct Chg in GSCI Industrial Metals Prices (left) |
% |
|
|
|
120 |
|
Global IP Growth (right) |
|
|
30 |
||
|
|
|
|
|
|||
100 |
|
|
|
|
|
|
25 |
80 |
|
|
|
|
|
|
20 |
60 |
|
|
|
|
|
|
15 |
40 |
|
|
|
|
|
|
10 |
20 |
|
|
|
|
|
|
5 |
0 |
|
|
|
|
|
|
0 |
-20 |
|
|
|
|
|
|
-5 |
-40 |
|
|
|
|
|
|
-10 |
-60 |
|
|
|
|
|
|
-15 |
-80 |
|
|
|
|
|
|
-20 |
1980 |
1985 |
1990 |
1995 |
2000 |
2005 |
2010 |
2015 |
Exhibit 7: Global MAP and copper consumption weighted global MAP
Index |
Copper Consumption Weighted Global MAP |
Global MAP |
Index |
||||
4 |
4 |
||||||
|
|
|
|
|
|||
3 |
|
|
|
|
|
3 |
|
2 |
|
|
|
|
|
2 |
|
1 |
|
|
|
|
|
1 |
|
0 |
|
|
|
|
|
0 |
|
-1 |
|
|
|
|
|
-1 |
|
-2 |
|
|
|
|
|
-2 |
|
-3 |
|
|
|
|
|
-3 |
|
-4 |
|
|
|
|
|
-4 |
|
2013 |
2014 |
2015 |
2016 |
2017 |
2018 |
|
|
Source: Goldman Sachs Global Investment Research
Exhibit 9: Distribution of PMIs from 21 countries and regions
Index |
|
Distribution of Regional PMIs |
|
Index |
||
70 |
Median |
|
10ᵗʰ Percentile |
|
90ᵗʰ Percentile |
70 |
|
|
|
|
|||
65 |
|
|
|
|
|
65 |
60 |
|
|
|
|
|
60 |
55 |
|
|
|
|
|
55 |
50 |
|
|
|
|
|
50 |
45 |
|
|
|
|
|
45 |
40 |
|
|
|
|
|
40 |
35 |
|
|
|
|
|
35 |
30 |
|
|
|
|
|
30 |
25 |
|
|
|
|
|
25 |
2006 |
2008 |
2010 |
2012 |
2014 |
2016 |
2018 |
Source: Haver Analytics, Goldman Sachs Global Investment Research |
Source: Haver Analytics, Goldman Sachs Global Investment Research |
5 November 2018 |
5 |
vk.com/id446425943
Goldman Sachs
China Charts
Metals Monitor
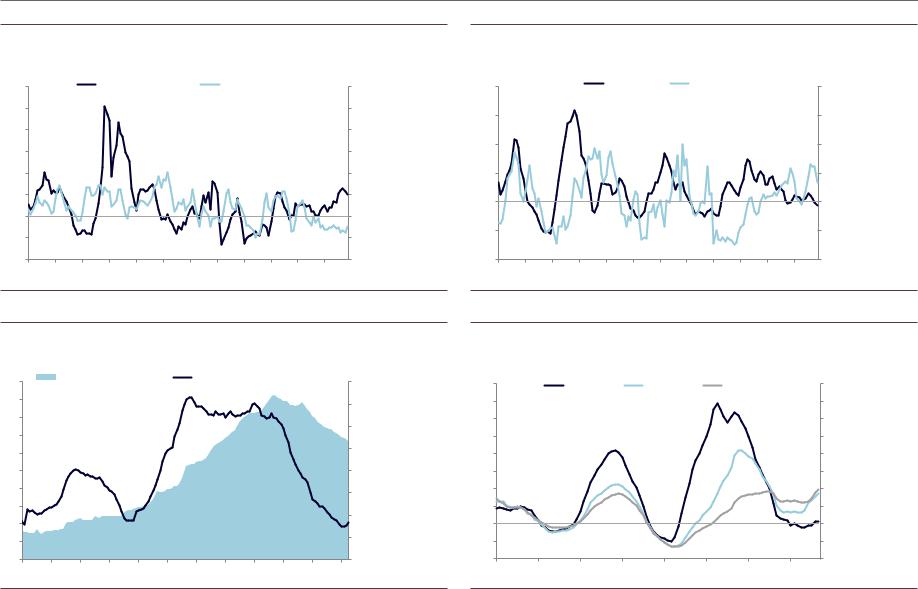
Exhibit 10: China GDP and Current Activity Indicator
% |
|
|
|
|
|
% |
16 |
|
Real GDP |
|
GS Current Activity Indicator |
||
|
|
|
|
|
16 |
|
14 |
|
|
|
|
|
14 |
12 |
|
|
|
|
|
12 |
10 |
|
|
|
|
|
10 |
8 |
|
|
|
|
|
8 |
6 |
|
|
|
|
|
6 |
4 |
|
|
|
|
|
4 |
2 |
|
|
|
|
|
2 |
0 |
|
|
|
|
|
0 |
2005 |
2007 |
2009 |
2011 |
2013 |
2015 |
2017 |
Source: Haver Analytics, Goldman Sachs Global Investment Research
Exhibit 12: China PMIs
Index |
|
|
|
|
Index |
58 |
NBS Manufacturing PMI |
|
NBS Non-Manufacturing PMI |
||
|
|
|
|
58 |
|
|
Caixin Manufacturing PMI |
|
Caixin Service PMI |
||
56 |
|
|
|
|
56 |
54 |
|
|
|
|
54 |
52 |
|
|
|
|
52 |
50 |
|
|
|
|
50 |
48 |
|
|
|
|
48 |
46 |
|
|
|
|
46 |
2013 |
2014 |
2015 |
2016 |
2017 |
2018 |
Exhibit 11: Year-over-year growth in Consumer Price Index and Producer Price Index
% |
|
|
CPI |
|
PPI |
% |
15 |
|
|
|
15 |
||
|
|
|
|
|
||
10 |
|
|
|
|
|
10 |
5 |
|
|
|
|
|
5 |
0 |
|
|
|
|
|
0 |
-5 |
|
|
|
|
|
-5 |
-10 |
|
|
|
|
|
-10 |
2005 |
2007 |
2009 |
2011 |
2013 |
2015 |
2017 |
Source: Haver Analytics, Goldman Sachs Global Investment Research
Exhibit 13: Year-over-year growth in imports and exports
% |
Chinese Imports and Exports (yoy growth rate) |
% |
|
|
70 |
|
|
Imports |
Exports |
70 |
60 |
|
|
|
|
60 |
50 |
|
|
|
|
50 |
40 |
|
|
|
|
40 |
30 |
|
|
|
|
30 |
20 |
|
|
|
|
20 |
10 |
|
|
|
|
10 |
0 |
|
|
|
|
0 |
-10 |
|
|
|
|
-10 |
-20 |
|
|
|
|
-20 |
-30 |
|
|
|
|
-30 |
2007 |
2009 |
2011 |
2013 |
2015 |
2017 |
Source: Haver Analytics, Goldman Sachs Global Investment Research |
Source: Haver Analytics, Goldman Sachs Global Investment Research |
5 November 2018 |
6 |
vk.com/id446425943
Goldman Sachs
Metals Monitor
Exhibit 14: Credit growth versus GDP growth |
Exhibit 15: Year-over-year growth in money supply |
% |
|
|
YoY Percent Change |
|
|
% |
|
|
|
|
|
|
|
||
40 |
TSF (adjusted for local gov bond and equity) |
|
Nominal GDP |
40 |
|||
|
|
|
|||||
35 |
|
|
|
|
|
|
35 |
30 |
|
|
|
|
|
|
30 |
25 |
|
|
|
|
|
|
25 |
20 |
|
|
|
|
|
|
20 |
15 |
|
|
|
|
|
|
15 |
10 |
|
|
|
|
|
|
10 |
5 |
|
|
|
|
|
|
5 |
0 |
|
|
|
|
|
|
0 |
2005 |
2007 |
2009 |
2011 |
2013 |
2015 |
2017 |
|
% |
|
Year-over-Year Growth in Money Supply |
% |
|||
40 |
|
|
M1 |
|
M2 |
40 |
35 |
|
|
|
|
|
35 |
30 |
|
|
|
|
|
30 |
25 |
|
|
|
|
|
25 |
20 |
|
|
|
|
|
20 |
15 |
|
|
|
|
|
15 |
10 |
|
|
|
|
|
10 |
5 |
|
|
|
|
|
5 |
0 |
|
|
|
|
|
0 |
2005 |
2007 |
2009 |
2011 |
2013 |
2015 |
2017 |
Source: Haver Analytics, Goldman Sachs Global Investment Research
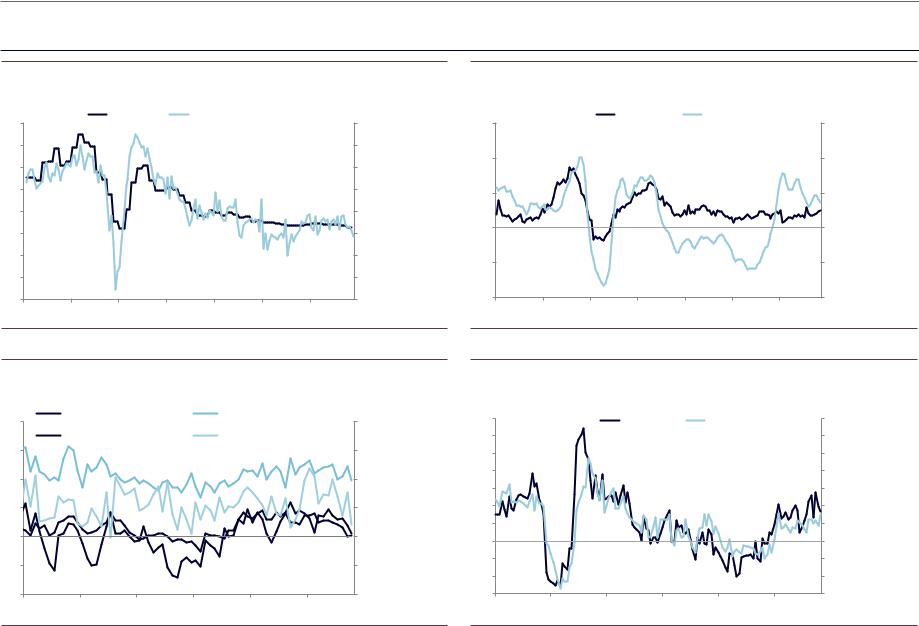
Exhibit 16: Fixed asset investment by sector
% |
YoY Growth in FAI by Sector (3mma) |
% |
60 |
Infrastructure |
Property |
Manufacturing |
60 |
||
|
|
|
|
|
||
50 |
|
|
|
|
|
50 |
40 |
|
|
|
|
|
40 |
30 |
|
|
|
|
|
30 |
20 |
|
|
|
|
|
20 |
10 |
|
|
|
|
|
10 |
0 |
|
|
|
|
|
0 |
-10 |
|
|
|
|
|
-10 |
2007 |
2009 |
2011 |
2013 |
2015 |
2017 |
|
Source: Haver Analytics, Goldman Sachs Global Investment Research
Exhibit 17: Fixed asset investment by ownership
% |
|
YoY Growth in FAI by Ownership (3mma) |
% |
||
|
|
|
|||
60 |
|
All |
State-Owned |
Private |
60 |
|
|
|
|||
50 |
|
|
|
|
50 |
40 |
|
|
|
|
40 |
30 |
|
|
|
|
30 |
20 |
|
|
|
|
20 |
10 |
|
|
|
|
10 |
0 |
|
|
|
|
0 |
-10 |
|
|
|
|
-10 |
2007 |
2009 |
2011 |
2013 |
2015 |
2017 |
Source: Haver Analytics, Goldman Sachs Global Investment Research |
Source: Haver Analytics, Goldman Sachs Global Investment Research |
5 November 2018 |
7 |
vk.com/id446425943
Goldman Sachs
Metals Monitor
Exhibit 18: Housing starts and completions
% |
|
|
|
YoY Percent Change (3mma) |
|
|
% |
||||
120 |
|
|
Housing Starts |
|
Housing Completions |
120 |
|||||
100 |
|
|
|
|
|
|
|
|
|
|
100 |
80 |
|
|
|
|
|
|
|
|
|
|
80 |
60 |
|
|
|
|
|
|
|
|
|
|
60 |
40 |
|
|
|
|
|
|
|
|
|
|
40 |
20 |
|
|
|
|
|
|
|
|
|
|
20 |
0 |
|
|
|
|
|
|
|
|
|
|
0 |
-20 |
|
|
|
|
|
|
|
|
|
|
-20 |
-40 |
|
|
|
|
|
|
|
|
|
|
-40 |
2007 |
2008 |
2009 |
2010 |
2011 |
2012 |
2013 |
2014 |
2015 |
2016 |
2017 |
2018 |
Source: Haver Analytics, Goldman Sachs Global Investment Research
Exhibit 20: Housing inventory
Months |
|
|
|
|
|
|
|
|
|
|
Mil SqM |
|
20 |
Reported Vacant for Sale |
Imputed Inventory Months Supply |
800 |
|||||||||
|
|
|
|
|
|
|
|
|
|
|
||
18 |
|
|
|
|
|
|
|
|
|
|
|
700 |
|
|
|
|
|
|
|
|
|
|
|
|
|
16 |
|
|
|
|
|
|
|
|
|
|
|
600 |
14 |
|
|
|
|
|
|
|
|
|
|
|
|
|
|
|
|
|
|
|
|
|
|
|
|
|
12 |
|
|
|
|
|
|
|
|
|
|
|
500 |
|
|
|
|
|
|
|
|
|
|
|
|
|
10 |
|
|
|
|
|
|
|
|
|
|
|
400 |
8 |
|
|
|
|
|
|
|
|
|
|
|
300 |
|
|
|
|
|
|
|
|
|
|
|
|
|
6 |
|
|
|
|
|
|
|
|
|
|
|
200 |
4 |
|
|
|
|
|
|
|
|
|
|
|
|
|
|
|
|
|
|
|
|
|
|
|
|
|
2 |
|
|
|
|
|
|
|
|
|
|
|
100 |
|
|
|
|
|
|
|
|
|
|
|
|
|
0 |
|
|
|
|
|
|
|
|
|
|
|
0 |
2007 |
2008 |
2009 |
2010 |
2011 |
2012 |
2013 |
2014 |
2015 |
2016 |
2017 |
2018 |
|
Exhibit 19: Home sales and land acquisition
% |
|
|
|
YoY Percent Change (3mma) |
|
% |
|||||
|
|
|
|
|
|
||||||
100 |
|
|
|
Home Sales |
Land Acquisition |
100 |
|||||
75 |
|
|
|
|
|
|
|
|
|
|
75 |
50 |
|
|
|
|
|
|
|
|
|
|
50 |
25 |
|
|
|
|
|
|
|
|
|
|
25 |
0 |
|
|
|
|
|
|
|
|
|
|
0 |
-25 |
|
|
|
|
|
|
|
|
|
|
-25 |
-50 |
|
|
|
|
|
|
|
|
|
|
-50 |
2007 |
2008 |
2009 |
2010 |
2011 |
2012 |
2013 |
2014 |
2015 |
2016 |
2017 |
2018 |
Source: Haver Analytics, Goldman Sachs Global Investment Research
Exhibit 21: Year-over-year house price appreciation rate
% |
YoY HPA of Newly Constructed Residential Buildings |
% |
|||||||
40 |
40 |
||||||||
|
Tier 1 |
|
Tier 2 |
|
Tier 3 and 4 |
|
|||
35 |
|
|
|
|
|
|
|
35 |
|
30 |
|
|
|
|
|
|
|
30 |
|
25 |
|
|
|
|
|
|
|
25 |
|
20 |
|
|
|
|
|
|
|
20 |
|
15 |
|
|
|
|
|
|
|
15 |
|
10 |
|
|
|
|
|
|
|
10 |
|
5 |
|
|
|
|
|
|
|
5 |
|
0 |
|
|
|
|
|
|
|
0 |
|
-5 |
|
|
|
|
|
|
|
-5 |
|
-10 |
|
|
|
|
|
|
|
-10 |
|
2011 |
2012 |
2013 |
2014 |
2015 |
2016 |
2017 |
2018 |
|
|
Source: Haver Analytics, Goldman Sachs Global Investment Research |
Source: Haver Analytics, Goldman Sachs Global Investment Research |
5 November 2018 |
8 |
vk.com/id446425943
Goldman Sachs
Metals Monitor
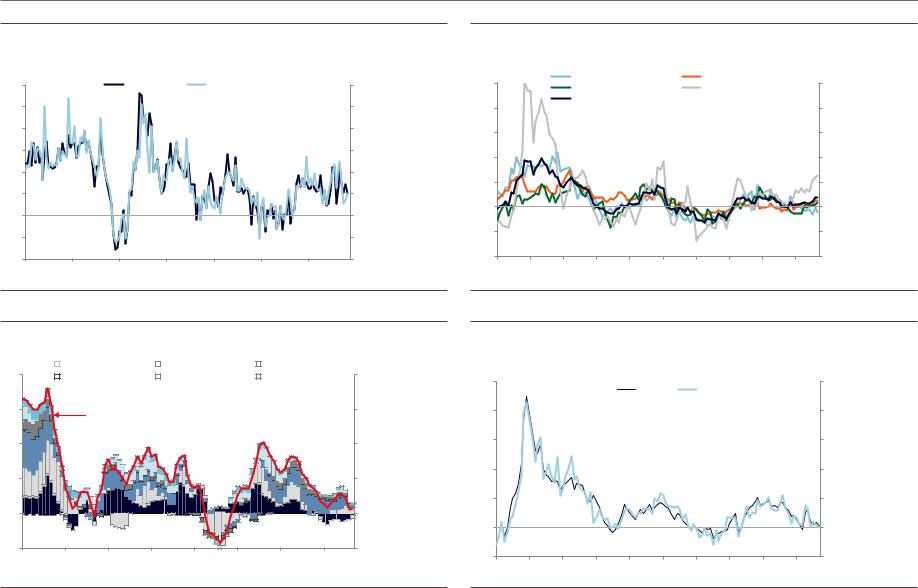
Exhibit 22: China electricity production
% |
|
YoY Growth in Electricity Production: |
|
% |
|||
|
|
|
|
||||
30 |
|
Unadjusted |
Temperature Adjusted |
30 |
|||
25 |
|
|
|
|
|
|
25 |
20 |
|
|
|
|
|
|
20 |
15 |
|
|
|
|
|
|
15 |
10 |
|
|
|
|
|
|
10 |
5 |
|
|
|
|
|
|
5 |
0 |
|
|
|
|
|
|
0 |
-5 |
|
|
|
|
|
|
-5 |
-10 |
|
|
|
|
|
|
-10 |
2005 |
2007 |
2009 |
2011 |
2013 |
2015 |
2017 |
|
Source: Haver Analytics, Goldman Sachs Global Investment Research
Exhibit 24: China Copper Demand Indicator
% |
|
|
Electricity Network |
|
Construction |
|
Appliance |
% |
|
|
|
|
|||||
20 |
|
|
|
|
20 |
|||
|
|
Machinery |
|
Transport |
|
Other |
||
|
|
|
|
|||||
|
|
|
|
|||||
|
|
|
|
|
|
|
|
|
|
|
|
|
|
|
|
|
|
15 |
|
China Copper Demand Indicator |
|
|
15 |
||
|
|
|
|
|
|||
10 |
|
|
|
|
|
|
10 |
5 |
|
|
|
|
|
|
5 |
0 |
|
|
|
|
|
|
0 |
-5 |
|
|
|
|
|
|
-5 |
2011 |
2012 |
2013 |
2014 |
2015 |
2016 |
2017 |
2018 |
Exhibit 23: China construction activity tracker
% |
|
|
|
YoY Growth in |
Cement Production |
% |
||||
100 |
|
Excavator Hours |
|
|
100 |
|||||
|
Glass Production |
|
|
Housing Starts |
||||||
|
|
|
|
|
||||||
80 |
|
Construction Tracker |
|
|
|
|
80 |
|||
|
|
|
|
|
|
|
|
|
||
60 |
|
|
|
|
|
|
|
|
|
60 |
40 |
|
|
|
|
|
|
|
|
|
40 |
20 |
|
|
|
|
|
|
|
|
|
20 |
0 |
|
|
|
|
|
|
|
|
|
0 |
-20 |
|
|
|
|
|
|
|
|
|
-20 |
-40 |
|
|
|
|
|
|
|
|
|
-40 |
2009 |
2010 |
2011 |
2012 |
2013 |
2014 |
2015 |
2016 |
2017 |
2018 |
|
Source: Komatsu, Haver Analytics, Goldman Sachs Global Investment Research
Exhibit 25: China Metal Consumption Index
% |
China Metal Consumption Index |
% |
|
|
50 |
|
|
|
PCA |
Median |
|
50 |
||
|
|
|
|
|
|
||||
40 |
|
|
|
|
|
|
|
|
40 |
30 |
|
|
|
|
|
|
|
|
30 |
20 |
|
|
|
|
|
|
|
|
20 |
10 |
|
|
|
|
|
|
|
|
10 |
0 |
|
|
|
|
|
|
|
|
0 |
-10 |
|
|
|
|
|
|
|
|
-10 |
2009 |
2010 |
2011 |
2012 |
2013 |
2014 |
2015 |
2016 |
2017 |
2018 |
Source: CEIC, Haver Analytics, Goldman Sachs Global Investment Research |
Source: Haver Analytics, Goldman Sachs Global Investment Research |
5 November 2018 |
9 |
vk.com/id446425943
Goldman Sachs
Metals Monitor
Base Metals Charts
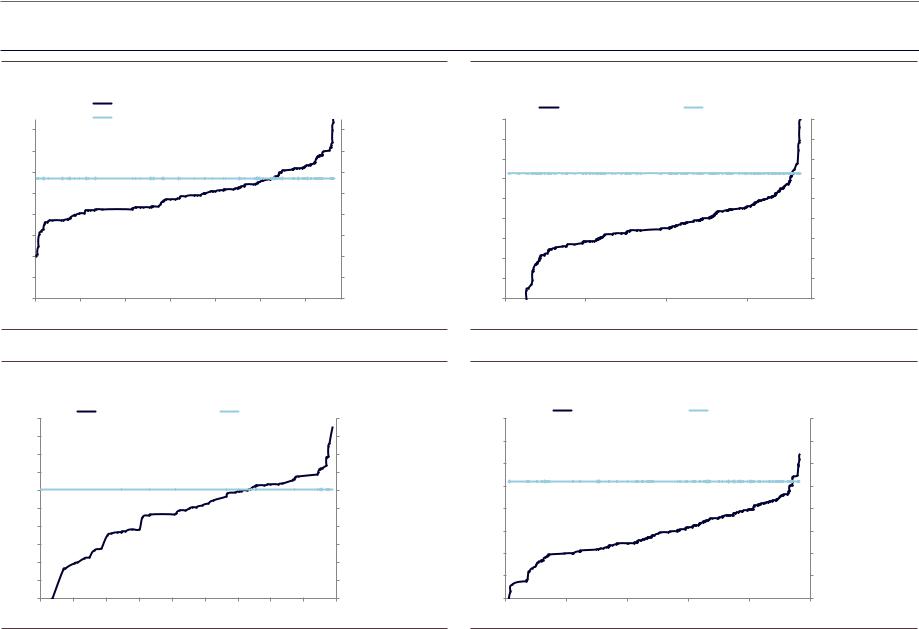
Exhibit 26: Aluminum cost curve and current price
$/t |
|
Aluminum C1 costs |
|
|
$/t |
|
|
|
Aluminum spot price plus European Premia |
||||
2,600 |
|
|
|
|
|
2,600 |
2,400 |
|
|
|
|
|
2,400 |
2,200 |
|
|
|
|
|
2,200 |
2,000 |
|
|
|
|
|
2,000 |
1,800 |
|
|
|
|
|
1,800 |
1,600 |
|
|
|
|
|
1,600 |
1,400 |
|
|
|
|
|
1,400 |
1,200 |
|
|
|
|
|
1,200 |
1,000 |
|
|
|
|
|
1,000 |
0 |
10,000 |
20,000 |
30,000 |
40,000 |
50,000 |
60,000 |
Exhibit 27: Copper cost curve and current price
$/t |
Copper total cash costs |
Copper spot price |
$/t |
||
9,000 |
9,000 |
||||
|
|
|
|||
8,000 |
|
|
|
8,000 |
|
7,000 |
|
|
|
7,000 |
|
6,000 |
|
|
|
6,000 |
|
5,000 |
|
|
|
5,000 |
|
4,000 |
|
|
|
4,000 |
|
3,000 |
|
|
|
3,000 |
|
2,000 |
|
|
|
2,000 |
|
1,000 |
|
|
|
1,000 |
|
0 |
|
|
|
0 |
|
0 |
5,000 |
10,000 |
15,000 |
|
|
Source: Wood Mackenzie, Bloomberg, Goldman Sachs Global Investment Research |
Source: Wood Mackenzie, Bloomberg, Goldman Sachs Global Investment Research |
Exhibit 28: Nickel cost curve and current price
$/t |
|
Nickel total cash costs |
|
Nickel spot price |
$/t |
||||
20,000 |
|
|
20,000 |
||||||
|
|
|
|
|
|
|
|
||
18,000 |
|
|
|
|
|
|
|
|
18,000 |
16,000 |
|
|
|
|
|
|
|
|
16,000 |
14,000 |
|
|
|
|
|
|
|
|
14,000 |
12,000 |
|
|
|
|
|
|
|
|
12,000 |
10,000 |
|
|
|
|
|
|
|
|
10,000 |
8,000 |
|
|
|
|
|
|
|
|
8,000 |
6,000 |
|
|
|
|
|
|
|
|
6,000 |
4,000 |
|
|
|
|
|
|
|
|
4,000 |
2,000 |
|
|
|
|
|
|
|
|
2,000 |
0 |
|
|
|
|
|
|
|
|
0 |
200 |
400 |
600 |
800 |
1,000 |
1,200 |
1,400 |
1,600 |
1,800 |
2,000 |
Exhibit 29: Zinc cost curve and current price
$/t |
Zinc total cash costs |
|
Zinc spot price |
$/t |
|
4,000 |
|
4,000 |
|||
|
|
|
|
||
3,500 |
|
|
|
|
3,500 |
3,000 |
|
|
|
|
3,000 |
2,500 |
|
|
|
|
2,500 |
2,000 |
|
|
|
|
2,000 |
1,500 |
|
|
|
|
1,500 |
1,000 |
|
|
|
|
1,000 |
500 |
|
|
|
|
500 |
0 |
|
|
|
|
0 |
0 |
2,000 |
4,000 |
6,000 |
8,000 |
10,000 |
Source: Wood Mackenzie, Bloomberg, Goldman Sachs Global Investment Research |
Source: Wood Mackenzie, Bloomberg, Goldman Sachs Global Investment Research |
5 November 2018 |
<0 |