

GS Top Ten Market Themes for 2019_watermark
.pdfvk.com/id446425943
15 November 2018 | 7:39AM EST
Global Markets Analyst Top Ten Market Themes for 2019: Down but Not Out
Charles P. Himmelberg
+1(917)343-3218 | charles.himmelberg@gs.com Goldman Sachs & Co. LLC
See all our year-ahead forecasts in one place. Visit the page.
Following on from our Global Economics outlook, here we lay out the top macro and
market themes that we expect to dominate the investment landscape in 2019. Our
modestly constructive though incrementally cautious, macro view argues for
remaining invested in risky assets, but moving up in quality and looking for portfolio
hedges where appropriate.
1.Growth and Risk: Stay Invested, Move Up in Quality …
2.Consider the Downside: … And Utilize Macro Hedges
3.Fed Tightening: Trading the Tail End
4.Corporate Profits: Late-Cycle Margin Headwinds
5.United States: Households Offer Better Balance Sheets
6.Europe: Italy Casts a Dark Cloud
7.Small Open Economies: Tightening With Imbalances
8.China: A Controlled Easing
9.Emerging Markets: Narrow Path to Performance
10.Commodities: Asynchronous Supply Cycles
Lotfi Karoui
+1(917)343-1548 | lotfi.karoui@gs.com Goldman Sachs & Co. LLC
Zach Pandl
+1(212)902-5699 | zach.pandl@gs.com Goldman Sachs & Co. LLC
Kamakshya Trivedi
+44(20)7051-4005 | kamakshya.trivedi@gs.com Goldman Sachs International
Kenneth Ho
+852-2978-7468 | kenneth.ho@gs.com Goldman Sachs (Asia) L.L.C.
Praveen Korapaty
+1(212)357-0413 | praveen.korapaty@gs.com Goldman Sachs & Co. LLC
Caesar Maasry
+1(212)902-8763 | caesar.maasry@gs.com Goldman Sachs & Co. LLC
Investors should consider this report as only a single factor in making their investment decision. For Reg AC certification and other important disclosures, see the Disclosure Appendix, or go to www.gs.com/research/hedge.html.

vk.com/id446425943
Goldman Sachs
Global Markets Analyst
Top Ten Market Themes for 2019: Down but Not Out
Equity markets continue to struggle following their October rout, and many investors appear to be questioning whether risk assets will find their footing in 2019. Most importantly, the US economic outlook appears to be turning increasingly less friendly: after more than eight years of growth the business cycle has matured; domestic activity looks quite likely to slow next year as the effect of 2017’s tax cuts wanes and tighter financial conditions begin to bite; and the Federal Reserve seems intent on steadily raising interest rates due to tight labor markets and growing inflation pressures. Add to this list an ongoing (and possibly escalating) trade conflict between the US and China, the budget tensions in Italy, and fragile growth in a number of emerging market economies, and it is not hard to understand market concerns about a challenging investing climate over the next 12 months.
Yet despite the uncertainties, we think it is too soon to head for the risk bunker. While some incremental caution is likely warranted in 2019, our view is that portfolios should maintain a modestly pro-risk tilt, for a few reasons. First, our economists expect global growth to hold up reasonably well, and for activity outside the US to accelerate moderately on a sequential basis. This mostly reflects a rebound in several medium-sized emerging markets which struggled this year—Turkey, Argentina, Russia, South Africa and Brazil—and roughly steady growth in the rest of the world. Moreover, outside the US and a handful of smaller developed market economies, the level of real activity and employment still appears low compared with long-run norms—suggesting room for above-trend growth alongside benign inflation. And even in the US, while growth should shift down a gear, recession risks still appear relatively low.
Second, activity in China is likely approaching levels that are intolerably low for the government, and there is a good chance that growth momentum may bottom over the next few months on the back of more determined policy support. The current five-year plan underlying much economic decision-making in China includes a goal to double real GDP between 2010 and 2020. Based on growth since 2010, reaching this target implies a growth “floor” for the next two years of about 6.1%. As of the most recent data, growth appears to have slipped slightly below that level: our economists estimate that Q3 GDP grew at an annualized pace of 6.0%, and our proprietary Current Activity Indicator (CAI) fell to 5.9% in the preliminary October reading. We do not expect large-scale stimulus that would send Chinese growth on a meaningfully higher trajectory, because policymakers will likely balance near-term activity with medium-run concerns related to pollution, financial sector reform, and other issues. But we do think growth objectives are sufficiently important that officials will take steps to prevent the economy from slowing any further. Therefore, Chinese growth—and the many assets affected by its slowing in 2018—may be bottoming.
Third, we do not think additional Fed tightening presents insurmountable risks to
markets. For instance, while we expect two more rate increases in 2019 than currently
discounted by markets, 11 of the 13 hikes we expect from the Fed this cycle have
already occurred or are priced in. Therefore, financial markets have arguably “paid the
15 November 2018 |
2 |

vk.com/id446425943
Goldman Sachs
Global Markets Analyst
price” of Fed hiking to a significant degree: since the end of 2015, US Treasuries have delivered sizable negative excess returns, global equity multiples have declined, and the currencies of emerging market economies with the largest foreign capital needs (e.g., Turkey and Argentina) have already depreciated sharply. Moreover, US inflation remains moderate enough that the FOMC still has room to pause if financial conditions were to tighten too abruptly. So, while we expect the committee to keep moving, they will not be hiking with blinders on—signs of a hard landing for the economy coming from markets and/or the incoming data would likely result in a Fed pause.
This moderately constructive, though incrementally cautious, macro view runs through many of our Top Ten Market Themes for 2019, as well as our refreshed trade ideas. We think investors should remain long risky assets, though shift up in quality
in both equities and credit, and look for portfolio hedges where possible. As long as spillovers from slowing US growth remain limited, our economic outlook also likely points to respectable returns for non-US assets—although our confidence about Europe specifically will remain low until the Italian fiscal standoff is resolved. Lastly, while the backdrop for broad market betas may be more challenging, we see alpha opportunities for macro investors across the globe due to asynchronous monetary policy tightening, differing economic reform trajectories, varying political calendars, and exposures to divergent trends in commodity markets.
1. Growth and Risk: Stay Invested, Move Up in Quality…
nOur global economic forecasts are historically consistent with low but positive returns for risk assets.
nGiven uncertainties, we recommend a move up in quality within asset classes.
For all the details in our 2019 macro outlook, one feature is most important: we expect the global economy to continue to expand at a respectable pace. In this type of environment it would be unusual for risky assets to deliver negative excess returns for a 12-month horizon. Using the MSCI All Country World Index, for example, 12-month returns have only been negative in the last 20+ years during periods of below-trend global growth or severe macroeconomic stress in certain regions (e.g., the Asian Financial Crisis and European Sovereign Debt Crisis). Therefore, while volatility may increase, the economic outlook we expect would historically be consistent with mid-to-low single-digit excess returns for global equities (Exhibit 1). Particularly after the drawdown in October, we therefore see a modestly positive outlook for risky assets in general, as long as global growth stabilizes as expected.
15 November 2018 |
3 |
vk.com/id446425943
Goldman Sachs
Global Markets Analyst
Exhibit 1: Above-Trend Growth Consistent With Positive Risk Asset Returns
% y-o-y |
|
|
|
|
Global GDP Growth Less 10y Avg |
|
|
Global Equity Returns* (RHS) |
|
|
%y-o-y |
||||||||
6 |
|
|
|
|
|
|
|
|
60 |
||||||||||
|
|
|
|
|
|
|
|
|
|
|
|
|
|
|
|
|
|
||
4 |
|
|
|
|
|
|
|
|
|
|
|
|
|
|
|
|
|
|
40 |
2 |
|
|
|
|
|
|
|
|
|
|
|
|
|
|
|
|
|
|
20 |
0 |
|
|
|
|
|
|
|
|
|
|
|
|
|
|
|
|
|
|
0 |
-2 |
|
|
|
|
|
|
|
|
|
|
|
|
|
|
|
|
|
|
-20 |
-4 |
|
|
|
|
|
|
|
|
|
|
|
|
|
|
|
|
|
|
-40 |
|
|
|
US Recessions |
|
|
|
|
|
|
|
|
|
|
|
|
|
|
||
-6 |
|
|
|
|
|
|
|
|
|
|
|
|
|
|
|
|
|
|
-60 |
80 |
82 |
84 |
86 |
88 |
90 |
92 |
94 |
96 |
98 |
00 |
02 |
04 |
06 |
08 |
10 |
12 |
14 |
16 |
18 |
*MSCI All Country World Index, MSCI World prior to 1988.
Source: Goldman Sachs Global Investment Research
That said, in light of some of the risks and uncertainties articulated above, we see reason to move up in quality within asset classes. For instance, our colleagues in US portfolio strategy recommend investors focus on stocks with stable, secular growth that should be insulated from a decelerating economy as well as defensive, higher “quality” attributes such as strong balance sheets and higher pricing power. At the sector level, the information technology sector (and particularly the software & services industry group) captures most of these attributes. We also recommend investors overweight the defensive utilities sector, which typically outperforms as economic growth slows, and the communication services sector, which has both “quality” and defensive constituents. The same goes for US Dollar corporate markets, where we favor investment grade (IG) over high yield (HY) issuers, and a similar theme is applicable more selectively in EM sovereign markets (see Theme 4).
2. Consider the Downside: … And Utilize Macro Hedges
nWe are still negative US duration, but Treasuries have become more attractive as a portfolio hedge.
nThe Yen could also protect against a large pullback in risky assets.
In addition to leaning towards higher quality segments of risk markets, investors should consider paying for outright portfolio hedges. Given the stage of the cycle, there are a few macro assets where asymmetries create attractive hedges, even if the most likely outcome is for mildly negative total returns. The first would be US duration (i.e., rates/Treasuries). Under our base case of steady Fed rate increases and a reasonably healthy global economy, we forecast that US 10-year yields will rise to 3.50% next year, resulting in negative returns of around 25 basis points (bp) (per unit of duration). However, in a downside scenario where the Federal Reserve stops hiking after
15 November 2018 |
4 |
vk.com/id446425943
Goldman Sachs
Global Markets Analyst
December—say in response to a small recession scare—yields could perhaps fall to 2.50-2.75%, resulting in positive returns of 45-70bp. Although US government bond yields remain moderate in a longer-term sense, with rates significantly off their lows and the US business cycle maturing, duration has become more attractive for portfolio diversification than at any point since 2012, in our view. We see a similar message in options markets, where the premium for high-strike payers has diminished (Exhibit 2).
Exhibit 2: More Symmetric Distribution for US Rates
%/pp |
US Rates and Payer Skew |
%/pp |
|
|
3.5 |
|
|
Payer Skew* |
10y Swap Rate |
|
3.5 |
3.0 |
|
|
|
|
|
3.0 |
2.5 |
|
|
|
|
|
2.5 |
2.0 |
|
|
|
|
|
2.0 |
1.5 |
|
|
|
|
|
1.5 |
1.0 |
|
|
|
|
|
1.0 |
0.5 |
Positive skew indicates higher |
|
|
|
0.5 |
|
price to protect against rising rates |
|
|
||||
|
|
|
|
|||
0.0 |
|
|
|
|
|
0.0 |
-0.5 |
|
|
|
|
|
-0.5 |
2012 |
2013 |
2014 |
2015 |
2016 |
2017 |
2018 |
*Implied vol on 100bp-high strikes less 100bp-low strikes.
Source: Bloomberg, Goldman Sachs Global Investment Research
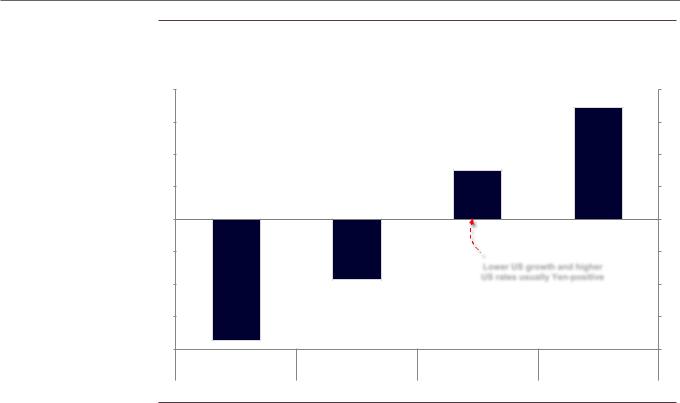
The second asset to consider in this context is the Japanese Yen. For several years the Bank of Japan (BoJ) has pursued a monetary policy stance designed in part to foster currency depreciation, generate import price pressures, and thereby help achieve the Central Bank’s inflation target. Largely for this reason, the Yen has remained relatively cheap over this period. But several factors have now changed. First, lower US growth and higher market volatility tend to benefit the Yen—a traditional safe haven currency— even when the Federal Reserve raises rates faster than expected (Exhibit 3). Second, the BoJ has begun tweaking aspects of its easing program such that higher US rates may not pass through fully into the Yen—they are instead likely to result in higher Japanese yields first, which are still below the upper bound of the BoJ’s tolerance range. Third, the White House has discussed entering trade negotiations with Japan. If earlier negotiations are any guide, the US will likely consider currency matters in these talks. We therefore see more downside than upside to USD/JPY, and think the Yen could be an effective hedge for otherwise pro-risk portfolios.
15 November 2018 |
5 |
vk.com/id446425943
Goldman Sachs
Global Markets Analyst
Exhibit 3: Yen Tends to Perform Well When US Growth Slows
% ar |
Yen Returns vs Dollar |
% ar |
8 |
by Changes in US Growth and US Rate Expectations |
8 |
|
6 |
6 |
4 |
4 |
2 |
2 |
0 |
0 |
-2 |
-2 |
|
Lower US growth and higher |
-4 |
US rates usually Yen-positive |
-4 |
|
-6 |
-6 |
-8 |
-8 |
Higher Rates |
Lower Rates |
Higher Rates |
Lower Rates |
Higher Growth |
Higher Growth |
Lower Growth |
Lower Growth |
Source: Goldman Sachs Global Investment Research
3. Fed Tightening: Trading the Tail End
nThe US yield curve should continue flattening as the Fed carries on hiking.
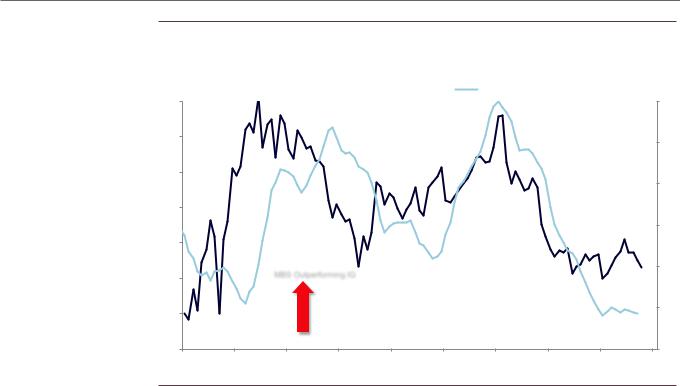
nSlower growth and low rate vol will likely allow agency MBS to outperform IG corporate credit.
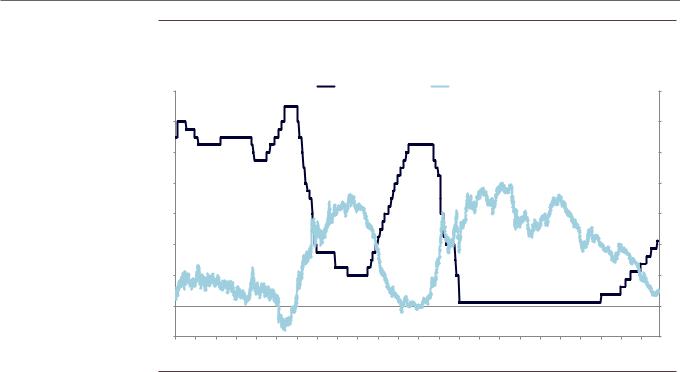
The Federal Reserve looks on track to raise rates at its meeting next month, and our economists expect the once-per-quarter pace of tightening from 2017-18 to carry over into next year as well. A relatively steady Fed—even in the face of slowing growth and possibly more volatile markets—would likely result in additional yield curve flattening in the US, as the FOMC pushes up front-end rates but bond yields remain anchored to medium-term economic fundamentals. Given current levels as well as carry/roll considerations, we favor expressing this view in the 2y30y Treasury curve. The 2y30y curve has steepened to +50bp after reaching a local low in August, but should trend toward zero as the Fed brings rates closer to levels consistent with (or slightly above) market perceptions of neutral rates (Exhibit 4). Although forward-starting steepeners (e.g., 2y-forward 2y10y) have become increasingly popular among investors, with the Fed unlikely to pause any time soon these structures are premature, in our view. As the US moves into late cycle we also expect firmer domestic inflation, which should result in outperformance of inflation breakevens.
15 November 2018 |
6 |
vk.com/id446425943
Goldman Sachs
Global Markets Analyst
Exhibit 4: More Fed Hikes Implies Flatter Curve
%/pp |
Funds Rate vs Treasury Curve |
%/pp |
7 |
|
|
|
|
|
|
|
Funds Rate Target |
|
|
2y30y Treasury Curve |
|
|
|
|
|
7 |
||||||
|
|
|
|
|
|
|
|
|
|
|
|
|
|
|
|
|
|
|
|
|
|
||
6 |
|
|
|
|
|
|
|
|
|
|
|
|
|
|
|
|
|
|
|
|
|
|
6 |
5 |
|
|
|
|
|
|
|
|
|
|
|
|
|
|
|
|
|
|
|
|
|
|
5 |
4 |
|
|
|
|
|
|
|
|
|
|
|
|
|
|
|
|
|
|
|
|
|
|
4 |
3 |
|
|
|
|
|
|
|
|
|
|
|
|
|
|
|
|
|
|
|
|
|
|
3 |
2 |
|
|
|
|
|
|
|
|
|
|
|
|
|
|
|
|
|
|
|
|
|
|
2 |
1 |
|
|
|
|
|
|
|
|
|
|
|
|
|
|
|
|
|
|
|
|
|
|
1 |
0 |
|
|
|
|
|
|
|
|
|
|
|
|
|
|
|
|
|
|
|
|
|
|
0 |
-1 |
|
|
|
|
|
|
|
|
|
|
|
|
|
|
|
|
|
|
|
|
|
|
-1 |
95 |
96 |
97 |
98 |
99 |
00 |
01 |
02 |
03 |
04 |
05 |
06 |
07 |
08 |
09 |
10 |
11 |
12 |
13 |
14 |
15 |
16 |
17 |
18 |
Source: Bloomberg, Goldman Sachs Global Investment Research
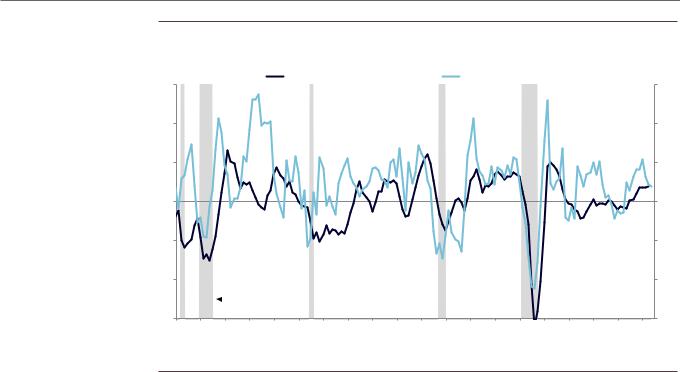
Separately, we think slower growth, low recession risk and a relatively narrow range of outcomes for the Fed—consistent with low interest rate volatility—will likely allow agency MBS to outperform IG corporate bonds on a risk-adjusted basis. The combined weight of the two asset classes is over 50% of the fixed income index, making successful relative allocations a key ingredient for outperformance. The historical evidence suggests Agency MBS tend to outperform in periods of stress, low rates volatility, and decelerating growth (Exhibit 5). IG, by contrast, tends to outperform in benign economic periods (e.g., 1992-1997 and 2016-2017), and also in periods such as 2003, when realized interest rate volatility is high and the negative convexity of mortgages becomes salient. We acknowledge that supply/demand technicals will likely remain challenging for the Agency MBS market, as the Federal Reserve’s portfolio holdings continue to run off. But we expect macro fundamentals will likely dominate supply/demand technicals as drivers of relative performance.
15 November 2018 |
7 |
vk.com/id446425943
Goldman Sachs
Global Markets Analyst
Exhibit 5: Slower Growth Typically Bodes Well for the Performance of Agency MBS vs. IG Corporate Bonds
Cumulative excess returns on long leveraged Agency MBS vs. IG corporate bonds (01/2010 = 100)
Index |
|
Leveraged agency MBS vs. IG corporate credit |
ISM Mfg 3mma ( inverse scale, RHS) |
Index |
|
|
|
112 |
|
|
|
|
|
|
|
|
49 |
110 |
|
|
|
|
|
|
|
|
51 |
|
|
|
|
|
|
|
|
|
|
108 |
|
|
|
|
|
|
|
|
|
|
|
|
|
|
|
|
|
|
53 |
106 |
|
|
|
|
|
|
|
|
|
|
|
|
|
|
|
|
|
|
55 |
104 |
|
|
|
|
|
|
|
|
|
|
|
MBS Outperforming IG |
|
|
|
|
|
57 |
|
102 |
|
|
|
|
|
|
|
||
|
|
|
|
|
|
|
|
|
|
100 |
|
|
|
|
|
|
|
|
59 |
|
|
|
|
|
|
|
|
|
|
98 |
|
|
|
|
|
|
|
|
61 |
2010 |
2011 |
2012 |
2013 |
2014 |
2015 |
2016 |
2017 |
2018 |
2019 |
Source: Bloomberg-Barclays, Goldman Sachs Global Investment Research
The US Dollar will likely benefit from additional Fed rate increases, but this may be offset by improving non-US growth, moderately favorable risk asset conditions and, late in the year, a move toward policy normalization by the ECB. Because of these cross-currents, over the near term we prefer expressing Dollar-downside views against
(i) currencies where central bank repricing could catch up to the Fed (e.g., Canadian Dollar), (ii) crosses with favorable exposure to more stability in China (e.g., Australian and New Zealand Dollars and the Chilean Peso), and (iii) EM currencies with the right combination of carry, valuation, and steady-to-improving domestic fundamentals (e.g. the Philippine Peso, South African Rand, and Colombian Peso). Because of firm US growth momentum and few signs of a pause from Fed officials, we see better prospects for Dollar weakness in the second half of 2019.
4. Corporate Profits: Late-Cycle Margin Headwinds
nLate-cycle headwinds will likely put pressure on margins and cause more dispersion across sectors and firms.
nThis outlook reinforces our preference for the “up in quality” theme, in both the credit and equity markets.
While the risk of a payment shock stemming from higher rates is a common concern among investors, a bigger risk, in our view, is another leg of corporate balance sheet deterioration, fueled by weak earnings growth. As the cycle ages, the outlook for margins will become increasingly challenging. In addition to “textbook” late-cycle headwinds, such as higher raw materials costs, increased freight and logistics expenses, and accelerating wage inflation, tariffs could also potentially add some downward pressure. For the universe of S&P 500 companies, our colleagues in the US
15 November 2018 |
8 |
vk.com/id446425943
Goldman Sachs
Global Markets Analyst
portfolio strategy team expect EPS growth to decline to 6% in 2019 and 4% in 2020, from 23% in 2018. They also expect margins to plateau at 11.2% through 2020.
As margins settle down in a steady state and the boost from tax reform fades, winners and losers at the sector and firm levels will continue to emerge, creating more dispersion in the cross-section of returns. One theme we expect to be a key driver of “alpha” is pricing power—the ability of firms to withstand headwinds from rising input costs and wage inflation. As our US portfolio strategists have recently discussed, the empirical evidence suggests high-margin firms tend to outperform when the outlook for profitability deteriorates. Recent price action in both the equity and corporate bond markets shows the trend is already visible, with credit and equity investors rewarding companies with strong and stable margins over those with weak and variable margins. We expect firms with high and stable margins to continue to outperform.
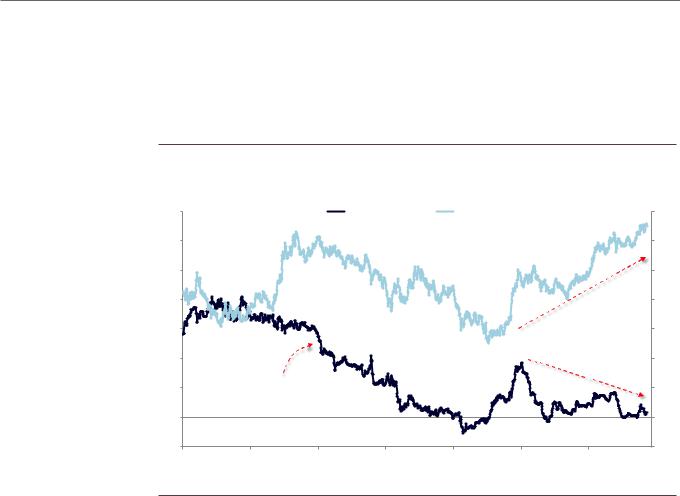
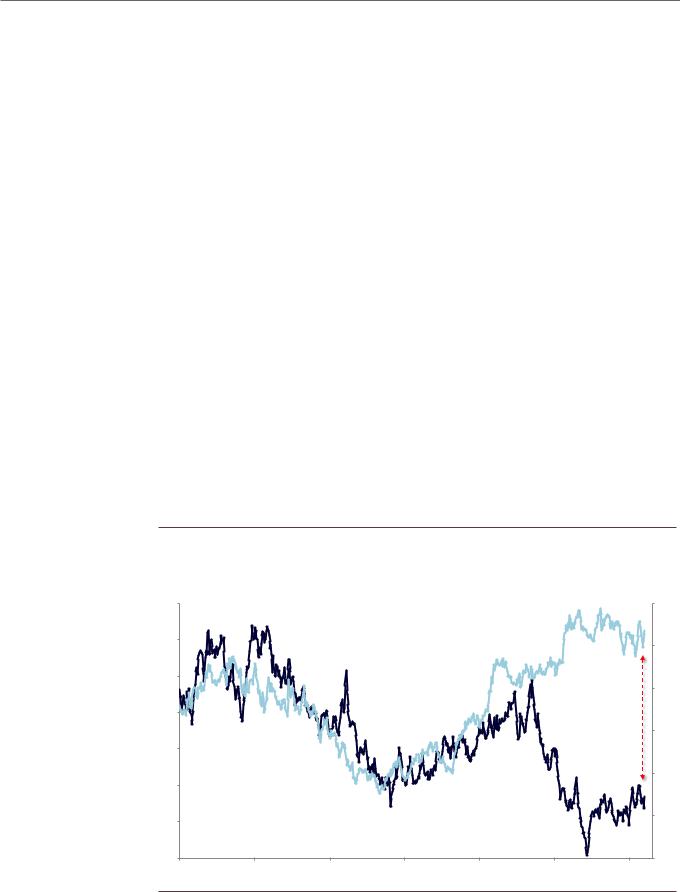
The prospect of a more challenging outlook for margins reinforces our preference for the “up in quality” theme. In credit, the larger financial cushions available to IG-rated companies leave them better positioned to resist margin headwinds than their HY-rated counterparts, which should fuel decompression between IG and HY spreads. Interestingly, the performance of the “IG/HY” spread decompression and the equity “quality” themes, which typically strongly co-move, has diverged this year, especially in H1 (Exhibit 6). As we have discussed on numerous occasions, this divergence has been fueled by technical factors, most notably the significant decline in HY bond issuance volumes (down 30% vs. last year), as opposed to improving fundamentals in lower-quality credits. We expect the slow reversal of the meaningful HY/IG spread compression that marked the first half of the year to continue to gain momentum, eventually re-converging with the price action in the equity market (again Exhibit 6).
Exhibit 6: 2018 Has Seen Strong Balance Sheets Outperform in the Equity Market, but Not In Credit
USD HY/IG spread ratio and cumulative return on long strong vs. weak balance sheet equity baskets
Ratio |
|
HY/IG spread ratio |
|
Long strong vs. weak balance sheet (RHS) |
Index |
|
|
|
|
3.6 |
|
|
|
|
|
112 |
3.4 |
|
|
|
|
|
107 |
|
|
|
|
|
|
|
3.2 |
|
|
|
|
|
|
|
|
|
|
|
|
102 |
3.0 |
|
|
|
|
|
|
|
|
|
|
|
|
97 |
2.8 |
|
|
|
|
|
|
|
|
|
|
|
|
92 |
2.6 |
|
|
|
|
|
|
2.4 |
|
|
|
|
|
87 |
|
|
|
|
|
|
|
2.2 |
|
|
|
|
|
82 |
Oct-15 |
Apr-16 |
Oct-16 |
Apr-17 |
Oct-17 |
Apr-18 |
Oct-18 |
Source: iBoxx, Goldman Sachs Global Investment Research
15 November 2018 |
9 |
vk.com/id446425943
Goldman Sachs
Global Markets Analyst
5. United States: Households Offer Better Balance Sheets
nPockets of vulnerability in credit continue to fuel concerns over potential risks to financial stability and the durability of the cycle.
nRisks have unambiguously increased over the past few years. But there are mitigating factors, in our view.
nFrom a portfolio allocation standpoint, we prefer high-quality consumer ABS tranches vs. IG-rated corporate bonds.
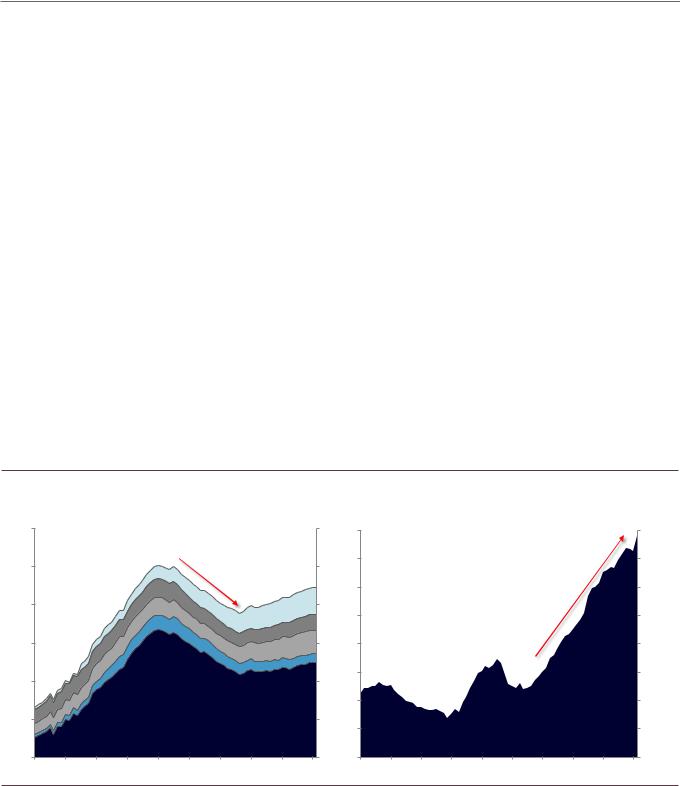
Against our relatively benign macro backdrop, many observers often point out that the picture is more challenging under the surface. Pockets of vulnerabilities in credit markets have indeed grown over the past few years, which could pose a risk to financial stability and the durability of the cycle. Where are these pockets of vulnerability and how severe are they? Within the private sector, the key differentiator of the ongoing US expansion cycle remains the striking divergence between household deleveraging and corporate re-leveraging. Owing largely to the significant contraction in mortgage loans, the level of household debt remains well below its 2008 peak in real terms: a sharp contrast to the significant growth in non-financial corporate debt (Exhibit 7). The more conservative stance of households in deploying debt, though to a large extent driven by the contraction in mortgage loans outstanding, has unsurprisingly translated into much healthier credit metrics relative to non-financial corporations; a reversal of the trend that prevailed in the 2000s (Exhibit 8). The key takeaway from Exhibits 7 and 8 is that non-financial corporations remain more vulnerable to negative shocks than households.
Exhibit 7: A Tale of Two Cycles for Households vs. Non-financial Corporations
2018 |
$tn. |
|
|
|
|
|
|
|
2018 |
$tn. |
2018 |
$tn. |
|
|
|
|
|
|
|
|
2018 |
$tn. |
|
16 |
|
|
|
|
|
|
|
|
|
|
16 |
9.0 |
|
|
|
|
|
|
|
|
|
|
9.0 |
14 |
|
|
|
|
|
|
|
|
|
|
14 |
8.5 |
|
|
|
|
|
|
|
|
|
|
8.5 |
|
|
|
|
|
|
|
|
|
|
|
|
8.0 |
|
|
|
|
|
|
|
|
|
|
8.0 |
12 |
|
|
|
|
|
|
|
Auto Loans |
12 |
7.5 |
|
|
|
|
|
|
|
|
|
|
7.5 |
||
|
|
|
|
|
|
|
|
|
|
|
|
|
|
|
|
|
|
|
|||||
10 |
|
|
|
|
|
|
|
Student Loans |
10 |
7.0 |
|
|
|
|
|
|
|
|
|
|
7.0 |
||
|
|
|
|
|
|
|
Credit Cards |
|
|
|
|
|
|
|
|
|
|
||||||
|
|
|
|
|
|
|
|
|
|
|
|
|
|
|
|
|
|
|
|
|
|||
|
|
|
|
|
|
|
|
|
HEL |
|
|
6.5 |
|
|
|
|
|
|
|
|
|
|
6.5 |
8 |
|
|
|
|
|
|
|
|
|
|
8 |
|
|
|
|
|
|
|
|
|
|
||
|
|
|
|
|
|
|
|
Mortgages |
|
|
|
|
|
|
|
|
|
|
|
|
|||
|
|
|
|
|
|
|
|
|
|
|
|
|
|
|
|
|
|
|
|
|
|
||
|
|
|
|
|
|
|
|
|
|
|
|
6.0 |
|
|
|
|
|
|
|
|
|
|
6.0 |
6 |
|
|
|
|
|
|
|
|
|
|
6 |
5.5 |
|
|
|
|
Nonfinancial corporate debt |
|
5.5 |
||||
|
|
|
|
|
|
|
|
|
|
|
|
|
|
|
|
|
|
|
|
|
|
||
4 |
|
|
|
|
|
|
|
|
|
|
4 |
5.0 |
|
|
|
|
|
|
|
|
|
|
5.0 |
2000 |
2002 |
2004 |
2006 |
2008 |
2010 |
2012 |
2014 |
2016 |
2018 |
2000 |
2002 |
2004 |
2006 |
2008 |
2010 |
2012 |
2014 |
2016 |
2018 |
||||
Source: Federal Reserve Board, FRBNY, Goldman Sachs Global Investment Research
15 November 2018 |
10 |