

J.P. Morgan - Guide to the Markets_watermark
.pdfvk.com/id446425943
MARKET INSIGHTS
Guide to the Markets
Europe | 3Q 2019 | As of 30 June 2019

vk.com/id446425943
Global Market Insights Strategy Team
|
|
|
|
|
|
|
|
|
|
Dr. David Kelly, CFA |
|||||
|
|
|
|
|
|
|
|
|
|
New York |
|||||
|
Samantha Azzarello |
||||||||||||||
|
New York |
|
|
|
|
|
|
|
|
|
|||||
|
|
|
|
|
David Lebovitz |
||||||||||
|
|
|
|
|
|
|
|
|
|
||||||
|
|
|
|
|
|
|
|
|
|
New York |
|||||
|
Dr. Cecelia Mundt |
||||||||||||||
|
New York |
|
|
|
|
|
|
|
|
|
|||||
|
|
|
|
Gabriela Santos |
|||||||||||
|
|
|
|
|
|
|
|
|
|
||||||
|
|
|
|
|
|
|
|
|
|
New York |
|||||
|
|
|
|
|
|
|
|
|
|
|
|
|
|
|
|
|
Alex Dryden, CFA |
||||||||||||||
|
New York |
|
|
|
|
||||||||||
|
|
John Manley |
|||||||||||||
|
|
|
|
|
|
|
|
|
|
||||||
|
|
|
|
|
|
|
|
|
|
New York |
|||||
|
Meera Pandit |
|
|
||||||||||||
|
New York |
||||||||||||||
|
|
|
|
|
|
|
|
|
|
Jordan Jackson |
|||||
|
|
|
|
|
|
|
|
|
|
New York |
|||||
|
Tyler Voigt |
|
|
|
|
|
|
|
|||||||
|
|
|
|
|
|
||||||||||
|
New York |
||||||||||||||
2 |
|
|
|
|
|
|
|
|
|
Jennie Li |
|||||
|
|
|
|
|
|
|
|
|
New York |
||||||
Karen Ward |
Tilmann Galler, CFA |
Tai Hui |
Chaoping Zhu, CFA |
|
London |
Frankfurt |
Hong Kong |
||
Shanghai |
||||
|
|
|
Michael Bell, CFA |
|
Maria Paola Toschi |
Marcella Chow |
|
||
|
Milan |
|
||||
|
Hong Kong |
Yoshinori Shigemi |
||||
London |
|
|
|
|||
|
|
|
|
Tokyo |
||
|
|
|
|
|
|
|
|
|
|
|
|
|
|
|
|
|
|
|
|
|
Hugh Gimber, CFA |
Vincent Juvyns |
Ian Hui |
Agnes Lin |
|
London |
Hong Kong |
|||
Luxembourg |
Taipei |
|||
|
|
Shogo Maekawa
Tokyo
Ambrose Crofton |
|
Manuel Arroyo Ozores, CFA |
Hannah Anderson |
||||
London |
|
||||||
|
Madrid |
||||||
|
Hong Kong |
||||||
|
|
|
|||||
|
|
|
|
|
|||
|
|
|
|
|
|
|
Kerry Craig, CFA |
|
|
|
|
|
|
|
|
|
|
|
|
|
|
|
|
|
|
|
|
|
|
|
|
Jai Malhi |
|
Lucia Gutierrez Mellado |
|
|
Melbourne |
||
London |
|
|
|
|
|||
|
Madrid |
Dr. Jasslyn Yeo, CFA |
|||||
|
|
|
|||||
|
|
|
|
|
Singapore |
||

vk.com/id446425943
Page reference
Global economy |
Equities |
Fixed income |
|||
4. |
Global growth |
46. |
Global equity earnings and valuations |
72. |
Fixed income yields and interest rate risk |
5. |
Global Purchasing Managers’ Index (PMI) for manufacturing |
47. |
US stock market |
73. |
Global government bond yields and inflation expectations |
6. |
Global unemployment |
48. |
US earnings |
74. |
US yield curve |
7. |
Global inflation |
49. |
US equity macro correlations |
75. |
US investment-grade bonds |
8. |
Global core inflation |
50. |
US equity valuations |
76. |
US high yield bonds |
9. |
Global central bank policy |
51. |
US valuations and subsequent returns |
77. |
Europe and UK investment-grade bonds |
10. |
Global currencies |
52. |
Equities and interest rates |
78. |
Europe high yield bonds |
11. |
Global trade |
53. |
US bull and bear markets |
79. |
Emerging markets bonds |
12. |
Productivity and population growth |
54. |
Equity income |
80. |
Fixed income focus: Negative and low-yielding government |
13. |
US GDP |
55. |
US sector returns and valuations |
|
bonds |
14. |
US corporates |
56. |
Europe earnings |
81. |
Global fixed income spreads and returns |
15. |
US consumer |
57. |
Europe equity macro correlations |
|
|
16. |
US labour market |
58. |
Europe equity market and currency |
Other assets |
|
17. |
US inflation |
59. |
Europe equity valuations |
||
18. |
US Federal Reserve policy rate |
60. |
Europe large, mid and small capitalisation equities |
|
|
19. |
US Federal Reserve balance sheet |
61. |
Europe sector returns and valuations |
82. |
Commodities |
20. |
US debt |
62. |
UK earnings |
83. |
Gold |
21. |
US focus: Trade and tariffs |
63. |
Japan earnings |
84. |
Stock-bond correlation and downside protection |
22. |
Eurozone GDP |
64. |
Japan equity market and currency |
85. |
Alternative investments |
23. |
Eurozone corporates |
65. |
Japan corporate governance |
86. |
Sustainable investing |
24. |
Eurozone consumer |
66. |
Emerging markets performance and earnings expectations |
87. |
Asset markets in coming years |
25. |
Eurozone labour market |
67. |
Emerging markets equity drivers |
|
|
26. |
Eurozone unemployment |
68. |
Emerging markets equity valuations and subsequent returns |
Investing principles |
|
27. |
Eurozone inflation |
69. |
Correlation and volatility |
||
28. |
European Central Bank policy rate |
70. |
Equity focus: US earnings and margin pressure |
|
|
29. |
Eurozone debt |
71. |
World stock market returns |
88. |
Life expectancy |
30. |
Eurozone government debt and bond spreads |
|
|
89. |
Cash investments |
31. |
European politics |
|
|
90. |
The power of compounding |
32. |
Eurozone focus: Employment and loan growth |
|
|
91. |
Annual returns and intra-year declines |
33. |
UK GDP |
|
|
92. |
Market timing is difficult |
34. |
UK consumer |
|
|
93. |
US asset returns by holding period |
35. |
UK inflation |
|
|
94. |
Asset class returns (EUR) |
36.UK focus: Brexit
37.Japan GDP
38.Japan inflation
39.China GDP
40.China debt
41.China inflation and policy rates
42.Emerging markets GDP and inflation
43.Emerging markets currencies and current account
44.Emerging markets structural dynamics
45.Emerging markets focus: China stimulus
3
vk.com/id446425943
Global growth |
GTM – Europe | 4 |
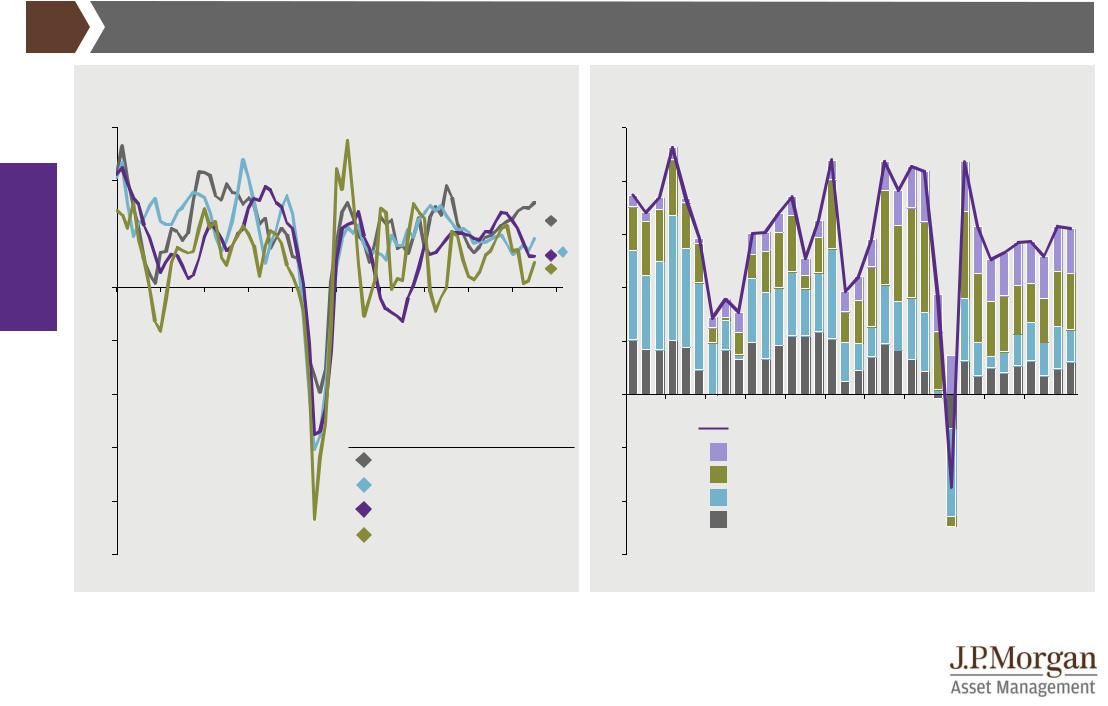
Real GDP growth
|
% change year on year |
|
|
|
|
|
|
|
|
||
|
6 |
|
|
|
|
|
|
|
|
|
|
economy |
4 |
|
|
|
|
|
|
|
|
|
|
2 |
|
|
|
|
|
|
|
|
|
|
|
|
|
|
|
|
|
|
|
|
|
|
|
Global |
0 |
|
|
|
|
|
|
|
|
|
|
|
|
|
|
|
|
|
|
|
|
|
|
|
-2 |
|
|
|
|
|
|
|
|
|
|
|
-4 |
|
|
|
|
|
|
|
|
|
|
|
|
|
|
|
|
|
|
|
|
2019 |
|
|
|
|
|
|
|
|
|
|
consensus forecast |
||
|
-6 |
|
|
|
|
|
US |
|
|
2,5% |
|
|
|
|
|
|
|
|
|
|
|
||
|
-8 |
|
|
|
|
|
UK |
|
|
1,3% |
|
|
|
|
|
|
|
Eurozone |
1,2% |
|
|||
|
|
|
|
|
|
|
|
||||
|
|
|
|
|
|
|
Japan |
|
0,7% |
|
|
|
-10 |
|
|
|
|
|
|
|
|
|
|
|
'00 |
'02 |
'04 |
'06 |
'08 |
'10 |
'12 |
'14 |
'16 |
'18 |
'20 |
Contribution to global real GDP growth
% change year on year 5
4 |
|
|
|
|
|
|
|
|
|
|
|
3 |
|
|
|
|
|
|
|
|
|
|
|
2 |
|
|
|
|
|
|
|
|
|
|
|
1 |
|
|
|
|
|
|
|
|
|
|
|
0 |
|
|
|
|
|
|
|
|
|
|
|
|
|
|
Global |
|
|
|
|
|
|
|
|
-1 |
|
|
China |
|
|
|
|
|
|
|
|
|
|
|
EM ex-China |
|
|
|
|
|
|
|
|
-2 |
|
|
DM ex-US |
|
|
|
|
|
|
|
|
|
|
|
US |
|
|
|
|
|
|
|
|
-3 |
|
|
|
|
|
|
|
|
|
|
|
'85 |
'88 |
'91 |
'94 |
'97 |
'00 |
'03 |
'06 |
'09 |
'12 |
'15 |
18 |
Source: (Left) BEA, Bloomberg, Eurostat, Japan Cabinet Office, ONS, Refinitiv Datastream, J.P. Morgan Asset Management. Forecasts are from Bloomberg contributor composite. (Right) Refinitiv Datastream, World Bank, J.P. Morgan Asset Management. EM is emerging markets. DM is developed markets.
Past performance is not a reliable indicator of current and future results. Guide to the Markets - Europe. Data as of 30 June 2019.
4
vk.com/id446425943
Global economy
5
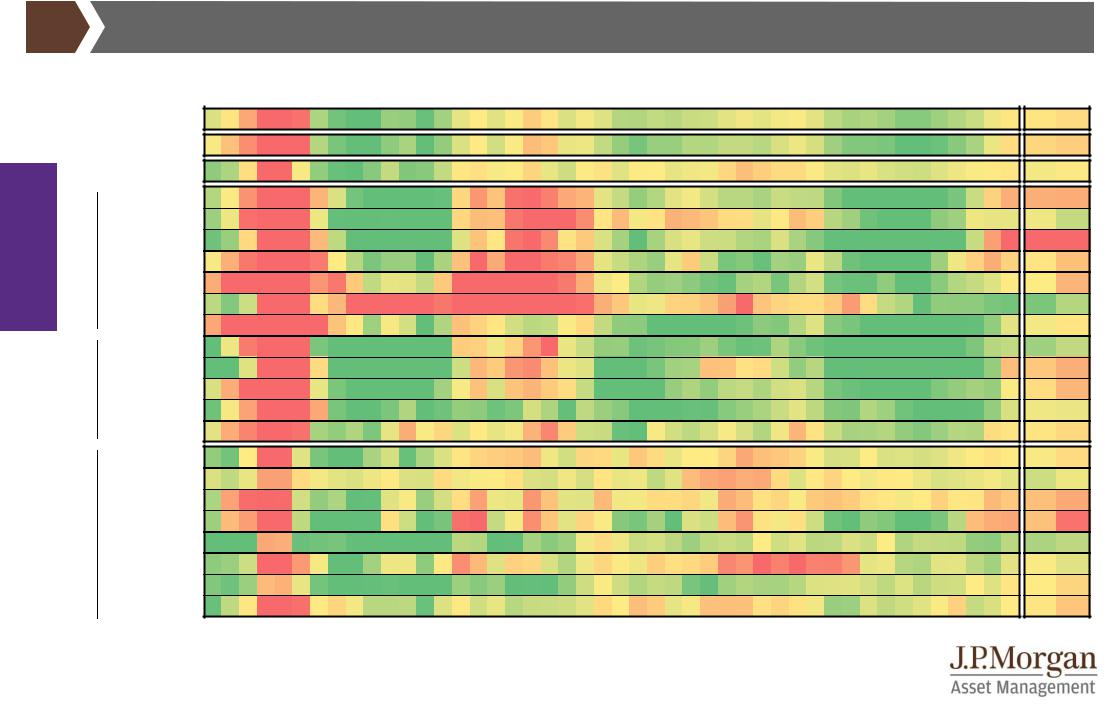
Global Purchasing Managers’ Index (PMI) for manufacturing |
GTM – Europe | 5 |
2019
2008 |
2009 |
2010 |
2011 |
2012 |
2013 |
2014 |
2015 |
2016 |
2017 |
2018 |
'19 |
May Jun
|
Global |
49,8 |
49,4 |
|
|
Developed |
49,2 |
48,9 |
|
|
Emerging |
50,4 |
49,9 |
|
|
Eurozone |
47,7 |
47,6 |
|
Eurozone |
France |
50,6 |
51,9 |
|
Germany |
44,3 |
45,0 |
||
|
||||
|
Italy |
49,7 |
48,4 |
|
|
Spain |
50,1 |
47,9 |
|
|
Greece |
54,2 |
52,4 |
|
|
Ireland |
50,4 |
49,8 |
|
Developed |
Sweden |
53,1 |
52,0 |
|
Switzerland |
48,6 |
47,7 |
||
|
||||
|
UK |
49,4 |
48,0 |
|
|
US |
50,5 |
50,6 |
|
|
Japan |
49,8 |
49,3 |
|
|
China |
50,2 |
49,4 |
|
|
Indonesia |
51,6 |
50,6 |
|
Emerging |
Korea |
48,4 |
47,5 |
|
Brazil |
50,2 |
51,0 |
||
|
Taiwan |
48,4 |
45,5 |
|
|
India |
52,7 |
52,1 |
|
|
Mexico |
50,0 |
49,2 |
|
|
Russia |
49,8 |
48,6 |
Source: Markit, J.P. Morgan Asset Management. The Global Purchasing Managers’ Index (PMI) assesses the economic health of the manufacturing sector by surveying output and employment intentions. A score of 50 indicates that economic activity is neither expanding nor contracting, above 50 indicates expansion. The colours range from red to yellow to green, where red is below 50, yellow is at 50 and green is above 50. Quarterly averages are shown, except the two most recent monthly data points. Past performance is not a reliable indicator of current and future results. Guide to the Markets - Europe. Data as of 30 June 2019.

vk.com/id446425943
Global unemployment |
GTM – Europe | 6 |
Unemployment rates
|
% |
|
|
|
|
|
|
|
|
|
|
14 |
|
Eurozone |
|
|
|
|
|
|
|
|
|
|
|
|
|
|
|
|
|
|
|
|
|
UK |
|
|
|
|
|
|
|
economy |
12 |
|
US |
|
|
|
|
|
|
|
|
|
Japan |
|
|
|
|
|
|
|
|
10 |
|
|
|
|
|
|
|
|
|
|
Global |
8 |
|
|
|
|
|
|
|
|
|
|
|
|
|
|
|
|
|
|
|
|
|
6 |
|
|
|
|
|
|
|
|
|
|
4 |
|
|
|
|
|
|
|
|
|
|
2 |
|
|
|
|
|
|
|
|
|
|
0 |
|
|
|
|
|
|
|
|
|
|
'00 |
'02 |
'04 |
'06 |
'08 |
'10 |
'12 |
'14 |
'16 |
'18 |
Source: BLS, Eurostat, Japan Ministry of Internal Affairs & Communications, ONS, Refinitiv Datastream, J.P. Morgan Asset Management. Past performance is not a reliable indicator of current and future results. Guide to the Markets - Europe. Data as of 30 June 2019.
6

vk.com/id446425943
Global inflation |
|
|
GTM – Europe | 7 |
||
2017 |
|
2018 |
2019 |
||
|
|
|
|
|
|
Global economy |
Eurozone |
|
Developed |
|
|
|
Emerging |
|
|
Jun |
Jul |
Aug |
Sep |
Oct |
Nov |
Dec |
Jan |
Feb |
Mar |
Apr |
May |
Jun |
Jul |
Aug |
Sep |
Oct |
Nov |
Dec |
Jan |
Feb |
Mar |
Apr |
May |
Global |
|
|
|
|
|
|
|
|
|
|
|
|
|
|
|
|
|
|
|
|
|
|
|
|
|
1,8 |
1,8 |
2,1 |
2,1 |
2,1 |
2,2 |
2,2 |
2,1 |
2,3 |
2,2 |
2,2 |
2,4 |
2,6 |
2,7 |
2,7 |
2,7 |
2,8 |
2,4 |
2,1 |
1,9 |
1,9 |
2,2 |
2,4 |
2,3 |
||
Developed |
|
|
|
|
|
|
|
|
|
|
|
|
|
|
|
|
|
|
|
|
|
|
|
|
|
1,4 |
1,5 |
1,7 |
1,9 |
1,6 |
1,8 |
1,8 |
1,8 |
1,8 |
1,9 |
1,8 |
2,2 |
2,3 |
2,4 |
2,3 |
2,1 |
2,3 |
1,9 |
1,6 |
1,4 |
1,4 |
1,6 |
1,8 |
1,5 |
||
Emerging |
|
|
|
|
|
|
|
|
|
|
|
|
|
|
|
|
|
|
|
|
|
|
|
|
|
2,5 |
2,4 |
2,7 |
2,6 |
2,7 |
2,8 |
2,9 |
2,5 |
3,1 |
2,7 |
2,7 |
2,7 |
3,0 |
3,1 |
3,2 |
3,5 |
3,5 |
3,1 |
2,9 |
2,7 |
2,6 |
3,1 |
3,3 |
3,4 |
||
Eurozone |
|
|
|
|
|
|
|
|
|
|
|
|
|
|
|
|
|
|
|
|
|
|
|
|
|
|
1,3 |
1,3 |
1,5 |
1,6 |
1,4 |
1,5 |
1,3 |
1,3 |
1,1 |
1,4 |
1,2 |
2,0 |
2,0 |
2,2 |
2,1 |
2,1 |
2,3 |
1,9 |
1,5 |
1,4 |
1,5 |
1,4 |
1,7 |
1,2 |
|
France |
0,8 |
0,8 |
1,0 |
1,1 |
1,2 |
1,2 |
1,2 |
1,5 |
1,3 |
1,7 |
1,8 |
2,3 |
2,3 |
2,6 |
2,6 |
2,5 |
2,5 |
2,2 |
1,9 |
1,4 |
1,6 |
1,3 |
1,5 |
1,1 |
|
Germany |
1,7 |
1,7 |
1,9 |
1,9 |
1,5 |
1,7 |
1,5 |
1,5 |
1,2 |
1,7 |
1,3 |
2,5 |
2,1 |
2,2 |
2,1 |
2,2 |
2,6 |
2,2 |
1,7 |
1,7 |
1,7 |
1,4 |
2,1 |
1,1 |
|
Italy |
1,2 |
1,2 |
1,4 |
1,3 |
1,1 |
1,1 |
1,0 |
1,2 |
0,5 |
0,9 |
0,6 |
1,0 |
1,4 |
1,9 |
1,6 |
1,5 |
1,7 |
1,6 |
1,2 |
0,9 |
1,1 |
1,1 |
1,1 |
0,9 |
|
Spain |
1,6 |
1,7 |
2,0 |
1,8 |
1,7 |
1,8 |
1,2 |
0,7 |
1,2 |
1,3 |
1,1 |
2,1 |
2,3 |
2,3 |
2,2 |
2,3 |
2,3 |
1,7 |
1,2 |
1,0 |
1,1 |
1,3 |
1,6 |
0,9 |
|
Greece |
0,9 |
0,9 |
0,6 |
1,0 |
0,5 |
1,1 |
1,0 |
0,2 |
0,4 |
0,2 |
0,5 |
0,8 |
1,0 |
0,8 |
0,9 |
1,1 |
1,8 |
1,1 |
0,6 |
0,5 |
0,8 |
1,0 |
1,1 |
0,6 |
|
Ireland |
-0,6 |
-0,2 |
0,4 |
0,2 |
0,5 |
0,5 |
0,5 |
0,3 |
0,7 |
0,5 |
-0,1 |
0,7 |
0,7 |
1,0 |
0,9 |
1,2 |
1,1 |
0,8 |
0,8 |
0,8 |
0,7 |
1,1 |
1,7 |
1,0 |
|
Sweden |
1,8 |
2,3 |
2,2 |
2,2 |
1,7 |
1,9 |
1,7 |
1,6 |
1,6 |
2,0 |
1,8 |
2,0 |
2,1 |
2,2 |
2,1 |
2,5 |
2,4 |
2,1 |
2,2 |
2,0 |
1,9 |
1,8 |
2,1 |
2,1 |
|
Switzerland |
0,4 |
0,6 |
0,5 |
0,8 |
0,8 |
0,8 |
1,1 |
0,8 |
0,5 |
0,7 |
0,4 |
1,0 |
0,9 |
1,2 |
1,3 |
1,1 |
1,1 |
1,0 |
0,8 |
0,7 |
0,7 |
0,7 |
1,1 |
0,5 |
|
UK |
2,6 |
2,6 |
2,9 |
3,0 |
3,0 |
3,1 |
3,0 |
3,0 |
2,7 |
2,5 |
2,4 |
2,4 |
2,4 |
2,5 |
2,7 |
2,4 |
2,4 |
2,3 |
2,1 |
1,8 |
1,9 |
1,9 |
2,1 |
2,0 |
|
US |
1,6 |
1,7 |
1,9 |
2,2 |
2,0 |
2,2 |
2,1 |
2,1 |
2,2 |
2,4 |
2,5 |
2,8 |
2,9 |
2,9 |
2,7 |
2,3 |
2,5 |
2,2 |
1,9 |
1,6 |
1,5 |
1,9 |
2,0 |
1,8 |
|
Japan |
0,4 |
0,4 |
0,7 |
0,7 |
0,2 |
0,6 |
1,0 |
1,4 |
1,5 |
1,1 |
0,6 |
0,7 |
0,7 |
0,9 |
1,3 |
1,2 |
1,4 |
0,8 |
0,3 |
0,2 |
0,2 |
0,5 |
0,9 |
0,7 |
|
China |
1,5 |
1,4 |
1,8 |
1,6 |
1,9 |
1,7 |
1,8 |
1,5 |
2,9 |
2,1 |
1,8 |
1,8 |
1,9 |
2,1 |
2,3 |
2,5 |
2,5 |
2,2 |
1,9 |
1,7 |
1,5 |
2,3 |
2,5 |
2,7 |
|
Indonesia |
4,4 |
3,9 |
3,8 |
3,7 |
3,6 |
3,3 |
3,6 |
3,3 |
3,2 |
3,4 |
3,4 |
3,2 |
3,1 |
3,2 |
3,2 |
2,9 |
3,2 |
3,2 |
3,1 |
2,8 |
2,6 |
2,5 |
2,8 |
3,3 |
|
Korea |
1,8 |
2,2 |
2,5 |
2,0 |
1,8 |
1,2 |
1,4 |
0,8 |
1,3 |
1,2 |
1,5 |
1,5 |
1,5 |
1,1 |
1,4 |
2,1 |
2,0 |
2,0 |
1,3 |
0,8 |
0,5 |
0,4 |
0,6 |
0,7 |
|
Taiwan |
1,0 |
0,8 |
1,0 |
0,5 |
-0,3 |
0,3 |
1,2 |
0,9 |
2,2 |
1,6 |
2,0 |
1,8 |
1,4 |
1,8 |
1,5 |
1,7 |
1,2 |
0,3 |
-0,1 |
0,2 |
0,2 |
0,6 |
0,7 |
0,9 |
|
India |
1,5 |
2,4 |
3,3 |
3,3 |
3,6 |
4,9 |
5,2 |
5,1 |
4,4 |
4,3 |
4,6 |
4,9 |
4,9 |
4,2 |
3,7 |
3,7 |
3,4 |
2,3 |
2,1 |
2,0 |
2,6 |
2,9 |
3,0 |
3,0 |
|
Brazil |
3,0 |
2,7 |
2,5 |
2,5 |
2,7 |
2,8 |
2,9 |
2,9 |
2,8 |
2,7 |
2,8 |
2,9 |
4,4 |
4,5 |
4,2 |
4,5 |
4,6 |
4,0 |
3,7 |
3,8 |
3,9 |
4,6 |
4,9 |
4,7 |
|
Mexico |
6,3 |
6,4 |
6,7 |
6,4 |
6,4 |
6,6 |
6,8 |
5,6 |
5,3 |
5,0 |
4,6 |
4,5 |
4,7 |
4,8 |
4,9 |
5,0 |
4,9 |
4,7 |
4,8 |
4,4 |
3,9 |
4,0 |
4,4 |
4,3 |
|
Russia |
4,4 |
3,8 |
3,3 |
3,0 |
2,7 |
2,5 |
2,5 |
2,2 |
2,2 |
2,3 |
2,4 |
2,4 |
2,3 |
2,5 |
3,1 |
3,4 |
3,5 |
3,8 |
4,3 |
5,0 |
5,2 |
5,3 |
5,2 |
5,1 |
|
Source: Bank of Mexico, DGBAS, ECB, Federal Reserve, Goskomstat of Russia, IBGE, India Ministry of Statistics & Programme Implementation, Japan Ministry of Internal Affairs & Communication, Korean National Statistical Office, National Bureau of Statistics China, Refinitiv Datastream, Riksbank, Statistics Indonesia, Swiss National Bank, UK Office for National Statistics (ONS), J.P. Morgan Asset Management. Figures shown are for headline inflation and are % change year on year.
Heatmap colours are based on the respective central bank target inflation rates. Blue is below target, white is at target and red is above target. Past performance is not a reliable indicator of current and future results. Guide to the Markets - Europe. Data as of 30 June 2019.
7
vk.com/id446425943 |
|
|
|
|
|
|
|
|
|
|
|
|
|
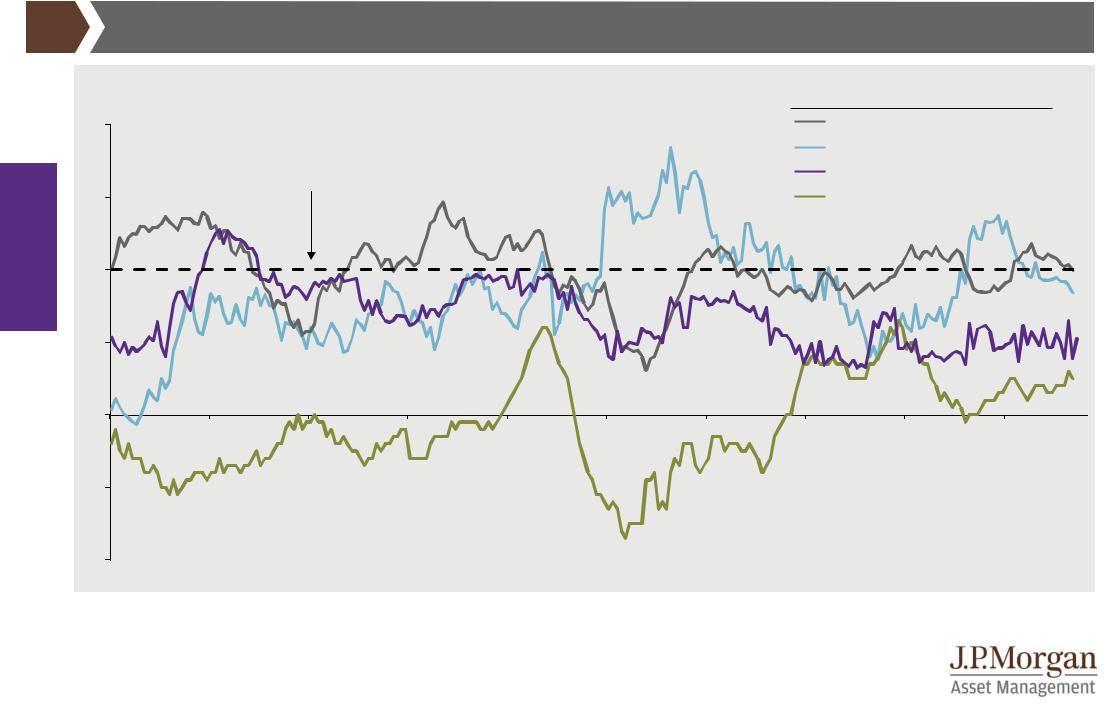
Global core inflation |
|
|
|
|
|
|
GTM – Europe | |
8 |
|||
|
Core inflation |
|
|
|
|
|
|
|
|
Average |
Latest |
|
|
|
|
|
|
|
|
|
|
since 2000 |
|
||
|
% change year on year |
|
|
|
|
|
|
|
|
|
||
|
|
|
|
|
|
|
|
|
|
|
||
|
4 |
|
|
|
|
|
|
US |
|
2,0% |
2,0% |
|
|
|
|
|
|
|
|
|
UK |
|
1,7% |
1,7% |
|
|
|
|
Headline inflation |
|
|
|
|
Eurozone |
1,4% |
1,1% |
|
|
economy |
|
|
target |
|
|
|
|
|
||||
3 |
|
|
|
|
|
Japan |
|
-0,2% |
0,5% |
|
||
|
|
|
|
|
|
|
|
|||||
|
|
|
|
|
|
|
|
|
|
|
|
|
Global |
2 |
|
|
|
|
|
|
|
|
|
|
|
|
|
|
|
|
|
|
|
|
|
|
|
|
|
1 |
|
|
|
|
|
|
|
|
|
|
|
|
0 |
|
|
|
|
|
|
|
|
|
|
|
|
-1 |
|
|
|
|
|
|
|
|
|
|
|
|
-2 |
|
|
|
|
|
|
|
|
|
|
|
|
'00 |
'02 |
'04 |
'06 |
'08 |
'10 |
'12 |
'14 |
'16 |
'18 |
|
|
Source: Bank of Japan, BLS, Eurostat, ONS, Refinitiv Datastream, J.P. Morgan Asset Management. CPI is the Consumer Price Index. Core inflation for the US is defined as CPI excluding food and energy. Core inflation for Japan is defined as CPI excluding fresh food and energy. Core inflation for the UK and the eurozone is defined as CPI less energy, food, alcohol and tobacco. Japan core CPI has been adjusted down by 2% from April 2014 to March 2015 to remove the estimated impact of the consumption tax hike over this period. Past performance is not a reliable indicator of current and future results. Guide to the Markets - Europe.
Data as of 30 June 2019.
8
vk.com/id446425943
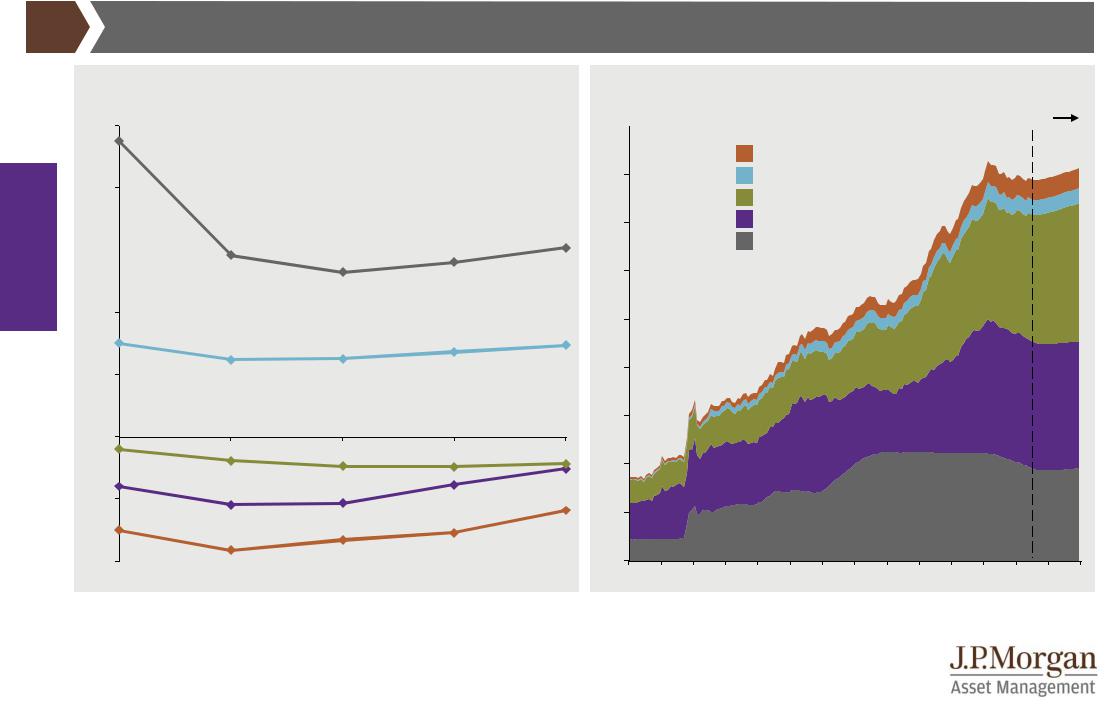
Global central bank policy
Market expectations for policy rate
|
% |
|
|
|
|
|
2,5 |
|
|
|
|
economy |
2,0 |
|
|
|
|
|
|
|
|
US |
|
1,5 |
|
|
|
|
|
Global |
1,0 |
|
|
|
|
|
|
|
|
|
|
|
|
|
|
|
UK |
|
0,5 |
|
|
|
|
|
0,0 |
|
|
|
Japan |
|
|
|
|
|
|
|
-0,5 |
|
|
|
Eurozone |
|
|
|
|
|
|
|
|
|
|
|
Switzerland |
|
-1,0 |
|
|
|
|
|
Jun ’19 |
Jun ’20 |
Jun ’21 |
Jun ’22 |
Jun ’23 |
GTM – Europe | 9
Central bank balance sheets
USD trillions
18 |
|
|
|
|
|
|
|
|
|
|
Forecast* |
||
|
|
|
|
|
|
|
|
|
|
|
|
|
|
|
|
|
|
Switzerland |
|
|
|
|
|
|
|
||
16 |
|
|
|
UK |
|
|
|
|
|
|
|
|
|
|
|
|
|
Japan |
|
|
|
|
|
|
|
|
|
14 |
|
|
|
Eurozone |
|
|
|
|
|
|
|
||
|
|
|
|
US |
|
|
|
|
|
|
|
|
|
12 |
|
|
|
|
|
|
|
|
|
|
|
|
|
10 |
|
|
|
|
|
|
|
|
|
|
|
|
|
8 |
|
|
|
|
|
|
|
|
|
|
|
|
|
6 |
|
|
|
|
|
|
|
|
|
|
|
|
|
4 |
|
|
|
|
|
|
|
|
|
|
|
|
|
2 |
|
|
|
|
|
|
|
|
|
|
|
|
|
0 |
|
|
|
|
|
|
|
|
|
|
|
|
|
'07 |
'08 |
'09 |
'10 |
'11 |
'12 |
'13 |
'14 |
'15 |
'16 |
'17 |
'18 |
'19 |
'20 |
Source: (Left) Bloomberg, J.P. Morgan Asset Management. Expectations are calculated using OIS forwards. (Right) Bank of England (BoE), Bank of Japan (BoJ), European Central Bank (ECB), Refinitiv Datastream, Swiss National Bank (SNB), US Federal Reserve (Fed), J.P. Morgan Asset Management. *Balance sheet forecast assumptions: BoE to have zero net asset purchases until the end of 2020; BoJ to have an annualised net asset purchase pace of 35 trillion yen until the end of 2020; ECB to have zero net asset purchases until the end of 2020; SNB to have zero net asset purchases until the end of 2020; Fed to reduce its balance sheet until the end of September 2019, in line with its announced plans. Assets then remain constant until reserves reach USD 1.2 trillion, at which point net asset purchases increase. Past performance is not a reliable indicator of current and future results. Guide to the Markets - Europe. Data as of 30 June 2019.
9
vk.com/id446425943
Global economy
Global currencies |
GTM – Europe | 10 |
Real effective exchange rates
Index level rebased to 100 in 2010, broad real effective exchange rate (REER)
160
USD
150 |
|
GBP |
|
EUR
140
JPY
130
120
110
100
90
80
70
60
'75 |
'77 |
'79 |
'81 |
'83 |
'85 |
'87 |
'89 |
'91 |
'93 |
'95 |
'97 |
'99 |
'01 |
'03 |
'05 |
'07 |
'09 |
'11 |
'13 |
'15 |
'17 |
'19 |
Source: J.P. Morgan Securities Research, Refinitiv Datastream, J.P. Morgan Asset Management. Past performance is not a reliable indicator of current and future results. Guide to the Markets - Europe. Data as of 30 June 2019.
10