

JPM_European Best Equity Ideas_watermark
.pdfvk.com/id446425943

vk.com/id446425943

vk.com/id446425943
Insurance
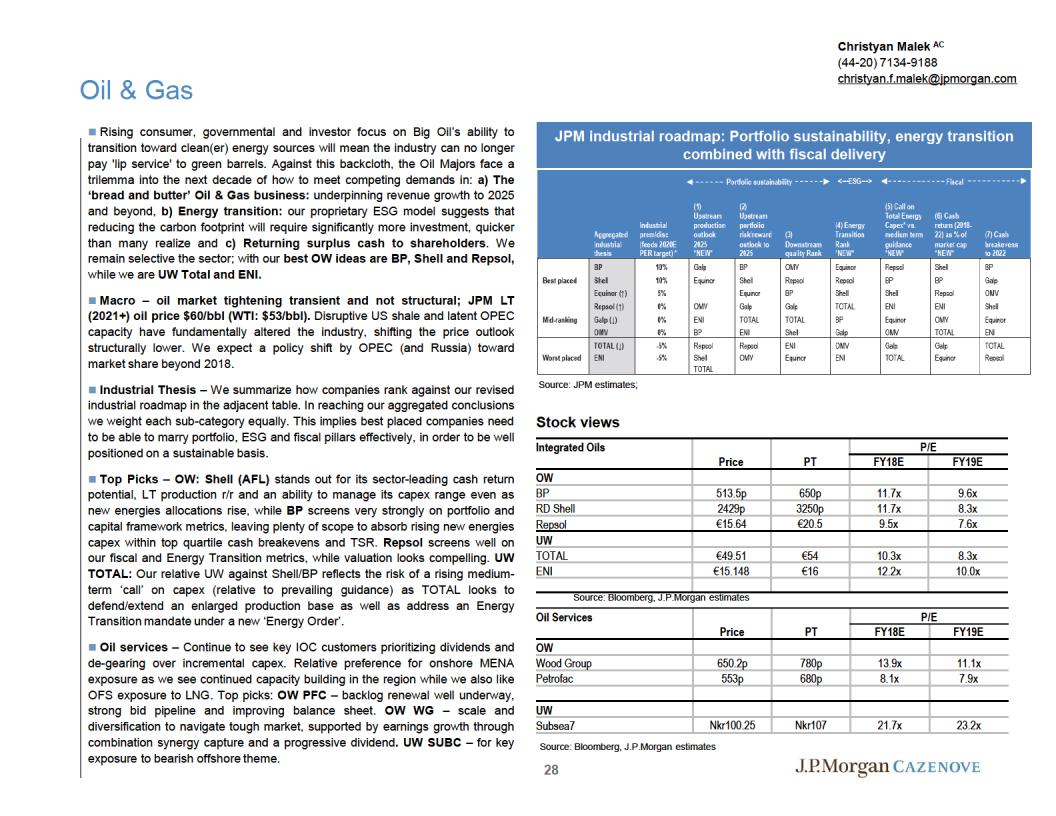
We prefer insurers that are relatively well positioned to manage a sustained period of low interest rates. We believe that the sector will continue to shift towards fee-based, capital-light or underwriting-based business models.
Key drivers
1)Fee-based businesses
2)Capital generation under Solvency II
3)Duration of cash flows – better matched companies can return capital for longer
Key risks for the sector:
1)Continued low interest rates
2)Credit migration risk
3)Regulatory and cost pressure
4)European elections
Top OW stocks:
1)NN Group – Strong growth in earnings and capital generation on back of DL merger to drive superior capital returns.
2)Poste Italiane – Positive management guidance and attractive valuation and yield
3)St James Place – Attractive valuation supported by resilient business outlook and strong net inflows
4)Allianz – Strong capital position and key beneficiary from improving motor insurance trends
5)Swiss Re - Strong capital position, attractive dividend yield and ongoing buyback
Michael Huttner, CFA AC |
Ashik Musaddi, CFA AC |
(44-20) 7134-4572 |
(44-20) 7134-4708 |
michael.huttner@jpmorgan.com |
ashik.x.musaddi@jpmorgan.com |
Latest solvency II ratios
Source: Company reports and J.P. Morgan.. Swiss Re and Zurich are SST ratios.
Stock views
|
|
|
|
Upside/ |
|
P/E Ratio |
Yield |
|
||
|
|
|
|
|
|
|
|
|
|
|
|
Rating |
PT |
Price |
(Downside) |
Mkt Cap |
2019e |
2020e |
2019e |
2020e |
|
Allianz |
OW |
222 |
193.64 |
15% |
87,972 |
9.8x |
9.1x |
4.6% |
|
5.1% |
AXA |
OW |
28.2 |
22 225 |
27% |
52,962 |
7.7x |
7.5x |
6.2% |
|
6.7% |
|
|
|
|
|
|
|
|
|
|
|
NN Group N.V. |
OW |
43.7 |
38.57 |
13% |
12,888 |
8.5x |
7.9x |
4.8% |
|
5.4% |
Poste Italiane SPA |
OW |
9.6 |
6.888 |
39% |
8,996 |
9.0x |
9.9x |
6.4% |
|
6.7% |
St James's Place |
OW |
1298.91 |
1062.5 |
22% |
5,621 |
22.1x |
17.0x |
4.5% |
|
4.8% |
Swiss Re |
OW |
120 |
91.38 |
31% |
28,748 |
8.9x |
8.1x |
5.9% |
|
6.2% |
Sector average |
|
|
|
|
|
11.0x |
9.9x |
5.4% |
|
5.8% |
Source: J.P. Morgan estimates and Bloomberg.
23

vk.com/id446425943

vk.com/id446425943

vk.com/id446425943

vk.com/id446425943
vk.com/id446425943

vk.com/id446425943
Pharmaceuticals
Large-Cap Top Picks: Astra Zeneca (OW) and Roche (OW)
•AstraZeneca – In 2018, we expect a return to product sales growth driven by the launches of Tagrisso, Imfinzi, Fasenra and Calquence. On Core EPS, we forecast a return to growth in 2019, and over the medium term (2019-22E), Astra is positioned for the fastest EPS growth outlook in the sector (16% vs. sector on 8%).
•Roche – We see new launches driving potential upgrades to consensus, and in the pipeline, we see Roche as having the richest set of newsflow in 2018, and we await further detailed data presentations for Tecentriq in Lung and Triple Negative Breast Cancer.
Large-Cap stock to avoid: Novo Nordisk(N)
•Novo Nordisk – Consensus forecasts remain too high, forecasting a 10% CAGR 2019-2022 for operating profit despite company guidance for 5% long-term operating profit growth. Our forecasts are 7% below consensus in 2022 for the Total Insulin Franchise and 25% below for the Total GLP-1 franchise, which leads us to be in line with company guidance, and therefore see substantial downside to consensus numbers. In the short term, we see pricing pressure in the US also potentially pressuring 2019 earning. While Oral Semaglutide looks like a strong product, we are more concerned regarding the overall expectations for growth, which appear too high.
29
Richard Vosser AC
(44-20) 7742-6652 richard.vosser@jpmorgan.com
James Gordon AC
(44-20) 7742-6654 james.d.gordon@jpmorgan.com
Sector Overview
•We expect the sector to maintain its forward multiple in 2018: We see the fundamentals of the sector remaining the same in 2018, although with our long-term estimates below consensus, this should put a break on appreciation of the multiple. Thus, any re-rating of the sector is macro dependent.
•2018 Generic and Competitive risk: Overall consensus forecasts seem too high for the majority of companies.
•2018 Key focus launches: In totality, we don’t see upside for the majority launches across the sector. We see the biggest downside delta for Novartis’ Kisqali; Sanofi’s Soliqua and Novo’s Xultophy.
•2019 Consensus EPS: 2019 Consensus EPS forecasts seem to be better underpinned for most stocks, excluding Novo Nordisk.
Stock Views
|
Adjusted Core EPS CAGR |
|
Adjusted Core P/E |
|
|
|
2018-2021E |
2019-2022E |
|
|
|
|
2018E |
2019E |
2020E |
||
Big Cap Pharma |
|
|
|
|
|
AstraZeneca |
16.17% |
19.05% |
23.9x |
22.0x |
19.6x |
Roche |
6.29% |
6.39% |
14.1x |
13.8x |
13.0x |
Novo Nordisk |
- |
- |
18.5x |
18.4x |
17.4x |
|
|
|
|
|
|
Source: Bloomberg, JP Morgan estimates.

vk.com/id446425943
Biotechnology
SMid Cap Top Picks: Galapagos, Lonza, MorphoSys, Genmab .
•Galapagos – We rate GLPG share OW as the valuation is underpinned by our peak filgotinib sales forecasts of €4.4bn (€3.1bn risk adj.) with further upside potential from the pipeline. Following the positive data from the FINCH 2 trial in RA, we still see significant upside for Galapagos, which we expect to be realised from potential positive read outs of FINCH 1 & 3 (1H’19), and the MANTA (2H’19) testicular safety trials. Additional pipeline catalysts in 2020 and beyond could drive further upside.
•Lonza – We see positive earnings momentum and potential group reorganisation uplift from a new reporting structure in 2018 and subsequent divestment of lower multiple businesses as driving the shares, through a re-rating. Currently trades on c. 22x 2019 PE, which we see as fairly undemanding.
•MorphoSys – Our Overweight reflects (i) the potential upside from MOR208 accelerated review timelines from FDA following recent strong data, (ii) strong continued launch of Tremfya in the US, and (iii) optionality around the Darzalex/ MOR202 litigation.
•Genmab – We believe the market is overly cautious on the Darzalex opportunity in Multiple Myeloma. Our deep dive into the Myeloma market suggests that Darzalex will continue to be the key standard of care in front line MM, which led to our upgrade to OW in June-18. Detailed MAIA data at ASH (Dec 1-5) could be supportive of this.
SMid Cap Stock under debate: Grifols (N)
•Grifols – Downgraded to Neutral in Jun-19 on the back of: (i) potential competitor to Grifols IG franchise (50% of revenues) from Argenx/UCB FcRn therapies and (ii) the stock looking fully valued (having re-rated almost 40% at the time). Following our downgrade, the stock de-rated >20% on FcRn competition concerns and more recently re-rated 10% on the potentially encouraging Phase IIb/III AMBAR data in Alzheimers. On the back of recent mixed data from FcRn competition, increased confidence in longer-term Alzheimer’s optionality could be well received.
30
James Gordon AC
(44-20) 7742-6654 james.d.gordon@jpmorgan.com
Richard Vosser AC
(44-20) 7742-6652 richard.vosser@jpmorgan.com
Order of Preference
Stock Views
|
Adjusted Core EPS CAGR |
|
Adjusted Core P/E |
|
|
|
2018-2021E |
2019-2022E |
|
|
|
|
2018E |
2019E |
2020E |
||
Mid Cap Pharma |
|
|
|
|
|
Lonza Group AG |
11.52% |
10.04% |
24.6x |
21.6x |
19.4x |
Genmab A/S |
23.84% |
- |
37.9x |
32.6x |
22.9x |
Grifols |
- |
- |
25.1x |
21.8x |
19.3x |
Grifols (non-voting) |
- |
- |
18.1x |
15.8x |
14.0x |
|
|
|
|
|
|
Source: Bloomberg, JP Morgan estimates.