

McKinsey - Global downstream outlook_watermark
.pdfvk.com/id446425943
Global downstream outlook to 2035
H1 2019
|
Market outlook summary |
Current market trends |
Demand outlook |
Refining outlook |
Prices and margins outlook |
2 |
|
vk.com/id446425943 |
|
|
|
|
|
|
|
|
|
|
|
|
Market outlook summary
Overall
After a strong 2017, the global refining market in 2018 saw strong capacity additions but slow demand growth and declining margins— trends that we expect to continue to see moving forward. As more global capacity is added, we’ll also see utilization rates slip as a result.
Looking ahead, Europe’s utilization rates should dip below 70% by 2023 due to declining demand and the region’s sensitivity to capacity additions in Africa, Asia, and the Middle East.
Asia’s outlook is strong for the long term, but it will not be immune to sliding utilization rates. We expect its utilization levels to dip to 73% by 2023—almost as low as Europe’s—but it should then steadily increase to the lowto mid-80s after 2030.
We’ll see the strongest market conditions in the US Gulf Coast (USGC), where utilization rates will remain in the mid-80s thanks to refinery complexity, access to cheap natural gas, crude pricing at export parity, and strong demand for product exports.

|
Market outlook summary |
Current market trends |
Demand outlook |
Refining outlook |
Prices and margins outlook |
3 |
|
vk.com/id446425943 |
|
|
|
|
|
|
|
|
|
|
|
|
Supply and demand
Global crude supply is growing at 0.2% per annum (p.a.) to 2035, with strong production increases in the Americas and Middle East offsetting falling production in Asia and Africa. However, the higher supply of non- crude-based material, particularly from biofuels, will reduce the need for refining, and we’ll see demand growth slow from the current 1.2% p.a. to 0.5% p.a. until 2035.
The decline in demand will mostly be driven by road transport and power, with the biggest impact seen on diesel. Meanwhile, refining distillation capacity will grow by 1.2% p.a. in the next four to five years, adding almost 7 million barrels per day (MMb/d) of capacity, with most of the capacity additions in Asia and the Middle East.

|
Market outlook summary |
Current market trends |
Demand outlook |
Refining outlook |
Prices and margins outlook |
4 |
|
vk.com/id446425943 |
|
|
|
|
|
|
|
|
|
|
|
|
Balances and flows
Continued capacity additions will lead to overcapacity in the near term, and we’ll see lower utilization in Asia and Europe through 2024 as a result.
As far as changing product flows in the future, the majority will take place in Africa, South Asia, and Southeast Asia—fast-growing regions that will rely on imports to meet future product demand. Asia’s crude slate will also become lighter as the region imports more light tight oil and replaces falling Russian and Asian crude supply with US and Middle Eastern crudes.

|
Market outlook summary |
Current market trends |
Demand outlook |
Refining outlook |
Prices and margins outlook |
5 |
|
vk.com/id446425943 |
|
|
|
|
|
|
|
|
|
|
|
|
Prices and margins
In the future, MARPOL will be a key player as far as prices and refinery margins go, causing margins to jump initially before tightening markets lead margins to begin to fall.
MARPOL will also increase the light/heavy and diesel gasoline differentials by USD13-17/bbl and USD3-8/bbl, respectively, in 2020, but we expect to see them fall back to historical levels by 2022 as the resid market tightens again and results in a balanced diesel gasoline market.
In addition to products, MARPOL will also push sweet crudes to be priced higher relative to sour crudes from 2020 to 2022; after 2022, these premiums and discounts will revert back to historical levels.

Market outlook summary |
Current market trends |
Demand outlook |
Refining outlook |
Prices and margins outlook |
6 |
vk.com/id446425943 |
|
|
|
|
|
|
|
|
|
|
|
After a strong 2017, refining markets weakened slightly in 2018 in Europe and Asia
•After a relatively strong year in 2017, cracking margins fell on average by USD1.18/bbl and USD0.77/bbl in Asia and Europe, respectively
•The drop in margins came mostly in the second half of 2018, with Asia continuing to see falling margins into early 2019
•European margins remained flat for the majority of 2018 with a slow decline toward the end of the year
•The USGC also saw flat margins on average in 2018, and a slight increase in the first quarter of 2019
Refining margins across hubs: variable cash
USD/barrel |
NWE FCCV1 |
USGC Cracking2 |
Singapore Cracking (RCC)3 |
13 |
|
|
|
12 |
|
|
|
11 |
|
|
|
10 |
|
|
|
9 |
|
|
|
8 |
|
|
|
7 |
|
|
|
6 |
|
|
|
5 |
|
|
|
4 |
|
|
|
3 |
|
|
|
2 |
|
|
|
1 |
|
|
|
0 |
2017 |
2018 |
Q1 2019 |
|
|||
|
6.94 |
6.93 |
7.65 |
Margin |
|
|
|
annual |
7.99 |
6.81 |
4.59 |
average |
|
|
|
|
4.86 |
4.09 |
3.96 |
1 Brent delivered to Northwest Europe; Fluid cataltyic cracking + visbreaking (FCCV)
2 WTI Magellan East Houston (MEH) in US Gulf Coast
3 Dubai delivered to Singapore; Residual catalytic cracking (RCC)
Source: Energy Insights – OilDesk Model (June 2019), Platts
Market outlook summary |
Current market trends |
Demand outlook |
Refining outlook |
Prices and margins outlook |
7 |
vk.com/id446425943 |
|
|
|
|
|
|
|
|
|
|
|
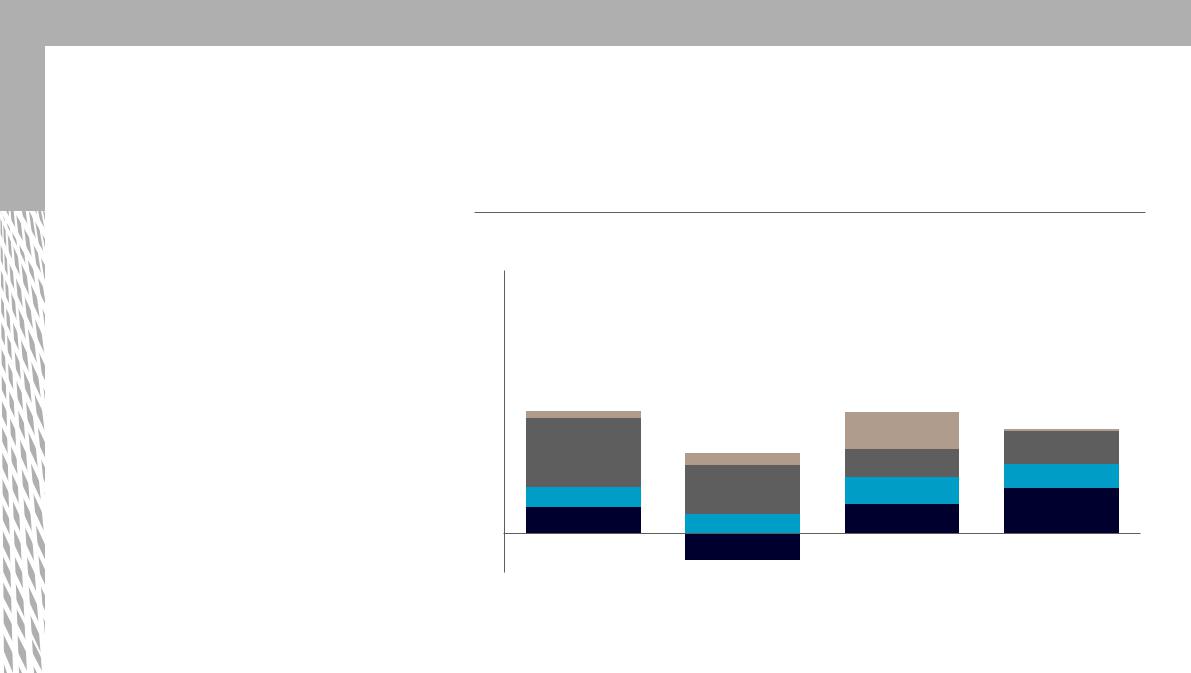
Global refinery capacity additions were strong in 2018, especially in Asia and the Middle East
•Net distillation capacity growth was strong in 2018, adding 950 Kb/d of capacity versus 835 Kb/d in 2017
•Asia was the largest contributor of capacity growth with over 600 Kb/d added in 2018, largely from expansion projects in China and India and Vietnam’s new Nghi Son 200 Kb/d refinery
•The Middle East had over 300 Kb/d of additions, most of which came from two 120-Kb/d condensate splitters at Iran’s Bandar Abbas refinery
•Distillation capacity in Latin America decreased by 156 Kb/d with the closure of the Point a Pierre refinery in Trinidad
Change in refining distillation capacity1
MMb/d |
|
Africa |
|
Asia |
|
Europe |
|
FSU |
|
Middle East |
|
North America |
|
Latin America |
|
|
|
|
|
|
|
||||||||
|
|
|
|
|
|
|
||||||||
1.5 |
|
|
|
|
|
|
|
|
|
|
|
|
|
|
1.0
0.5
0
-0.5
2015 |
2016 |
2017 |
20182 |
1 Based on date of capacity start up 2 Does not include partial capacity additions from Aliaga, Hengli, and RAPID assumed to come online partially in 2019, representing 325 Kb/d in Asia and 186 Kb/d in Europe
Source: McKinsey Refining Capacity Database
Market outlook summary |
Current market trends |
Demand outlook |
Refining outlook |
Prices and margins outlook |
8 |
vk.com/id446425943 |
|
|
|
|
|
|
|
|
|
|
|
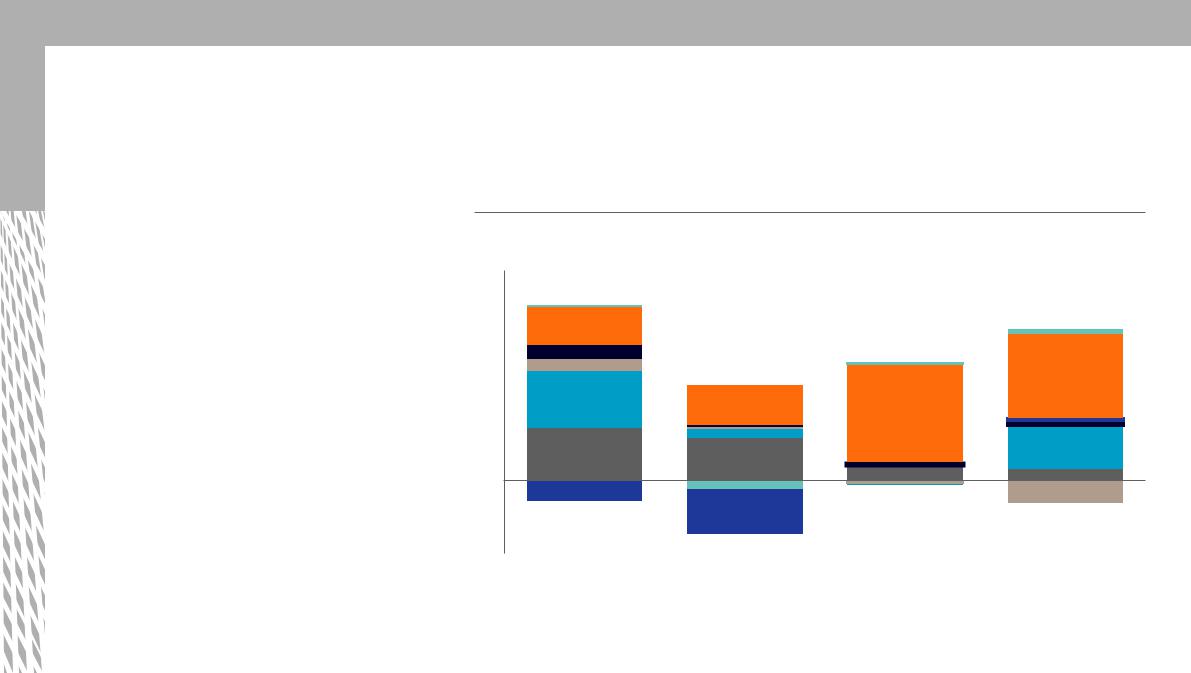
Globally, middle distillate1 demand growth was stronger than gasoline range products in 2018
•Global light product demand growth was ~200 Kb/d lower in 2018, almost entirely a result of naphtha growth falling to ~0
•Diesel/gasoil demand grew the strongest, with 40% growth from both North America and Asia (largely driven by India)
•Jet/kero demand growth was in line with history, although ~40 Kb/d lower than in 2017, with most of the growth slowdown originating in North America
•Gasoline growth remained strong in 2018, with 25% of growth resulting from Europe’s push toward gasoline-powered cars versus diesel
•Naphtha demand growth was marginal in 2018, mostly related to the relative pricing to propane as a chemical feedstock
Change in global light product demand, Year-over-year change
MMb/d |
|
Naphtha |
|
Gasoline |
|
Jet/Kero |
|
Diesel/Gasoil |
|
|
|
|
|||||
|
|
|
|
3.0
2.8
2.6
2.4
2.2
2.0
1.8
1.6
1.4
1.2
1.0
0.8
0.6
0.4
0.2
0 -0.2 -0.4
2015 |
2016 |
2017 |
2018 |
1 Includes jet/kero and diesel/gasoil
Source: Energy Insights – Global Downstream Model (May 2019)

Market outlook summary |
Current market trends |
Demand outlook |
Refining outlook |
Prices and margins outlook |
9 |
vk.com/id446425943 |
|
|
|
|
|
|
|
|
|
|
|
Global oil demand is projected to slow down and peak by the early 2030s, sooner than in most other sources
•Oil demand growth is expected to slow to 0.5% p.a. from 2018 to 2035 in our latest reference case. This represents a significant slowdown compared to the historical average of +1% p.a. over the last three decades
•Our outlook is within the range of other forecasts in the near term to 2030
•In the long term, we forecast an earlier peak in oil demand by the early 2030s compared to other forecasts. This is primarily due to a more bearish outlook for road transport demand due to growing penetration of electric vehicles
Global oil demand1 |
|
|
CAGR |
Indexed to 100 |
Reference case forecasts |
Sustainability cases |
2018-35 |
125 |
|
ExxonMobil |
0.8% |
120 |
|
||
|
Equinor Reform |
0.7% |
|
115 |
|
||
|
|
|
|
110 |
|
IEA New Policies |
0.6% |
|
|
|
|
105 |
|
Global Downstream Model 20181 |
0.6% |
|
|
|
|
100 |
|
Global Downstream Model 20191 |
0.5% |
|
|
|
|
95 |
|
BP Evolving Transition |
0.4% |
|
|
|
|
90 |
|
Shell – Sky |
0.1% |
|
|
|
|
85 |
|
BP Rapid Transition |
-0.4% |
|
|
|
|
80 |
|
IEA Sustainable Development |
-0.7% |
|
|
|
|
|
|
Equinor Renewal |
-0.6% |
7516 17 18 19 20 21 22 23 24 25 26 27 28 29 30 31 32 33 34 35 |
|
||
1 The Global Downstream Model outlooks are based on our Global Energy Perspective Reference Case. Definition of products (e.g., ethane, refinery fuel) may not be consistent across all other forecasts. Source: Energy Insights – Global Downstream Model (May 2019), BP Global Energy Outlook (Feb 2019), ExxonMobil Outlook for Energy (Feb 2018), IEA World Energy Outlook (Oct 2018), Equinor Energy Perspectives (May 2018), Shell Scenarios (Apr 2018)

Market outlook summary |
Current market trends |
Demand outlook |
Refining outlook |
Prices and margins outlook |
10 |
vk.com/id446425943 |
|
|
|
|
|
|
|
|
|
|
|
Chemicals and aviation are the main sources of long-term demand growth, while road transport and power have the biggest decline
Global liquids demand 2018-35 |
|
|
|
|
|
|
|
|
|
|
|
|
MMb/d |
|
|
|
2018-25 (short term) |
2018-35 (long term) |
2018-35 delta MMb/d |
>1 |
0.1 to 1 |
-0.1 to 0.1 |
|||
|
|
|
Motor |
|
|
|
|
|
|
|
CAGR |
Total 2018 |
|
LPG1 |
Naphtha |
gasoline |
Jet/Kero |
Gas/Diesel |
Fuel oil |
Other2 |
Total |
(2018-35) |
volume |
||
Chemicals |
|
|
|
|
|
|
|
|
|
|
2.4% |
13.2 |
Other industries |
|
|
|
|
|
|
|
|
|
|
1.0% |
13.9 |
Road transport |
|
|
|
|
|
|
|
|
|
|
-0.1% |
44.2 |
Aviation |
|
|
|
|
|
|
|
|
|
|
2.3% |
7.0 |
Marine |
|
|
|
|
|
|
|
|
|
|
-0.3% |
5.1 |
Other transport |
|
|
|
|
|
|
|
|
|
|
1.4% |
1.8 |
Buildings |
|
|
|
|
|
|
|
|
|
|
-0.5% |
7.7 |
Power |
|
|
|
|
|
|
|
|
|
|
-5.3% |
3.7 |
Total |
|
|
|
|
|
|
|
|
|
|
0.5% |
95.8 |
CAGR (2018-35) |
0.7% |
2.2% |
0.2% |
2.0% |
-0.3% |
|
-0.7% |
1.3% |
0.5% |
|
|
|
Total 2018 volume |
9.3 |
7.1 |
26.0 |
7.8 |
28.6 |
|
7.1 |
9.9 |
95.8 |
|
|
|
 -0.1 to -1
  <-1
<-1
1Liquefied petroleum gas
2Includes reformate BTX (feedstock into aromatics unit at refinery), bitumen, lubes, waxes, petcoke, and other oil products Source: Energy Insights – Global Downstream Model (May 2019)