

Nomura_Outlook for Japanese equities heading into 2019_watermark
.pdfvk.com/id446425943
Japanese equities investment strategy (November 2018)
JAPAN STRATEGY
Outlook for Japanese equities heading into 2019
We expect short-term rebounds, followed by repeated quarterly rises and falls
In this month's "Market outlook" section, we discuss the outlook for Japanese stocks heading into 2019, the relationship between individual investors and the BOJ from the perspective of equity supply and demand, and corporate governance reforms, looking at developments in 2018 and points to watch in 2019.
We see 1,850 and 23,500 as medium-term mileposts for the TOPIX and Nikkei 225
Japanese equities still look undervalued to us, and in general we think investors would do well to consider proactively investing in Japanese stocks at these price levels. Even if earnings fluctuate a bit, if the improvement in Japanese earnings seen to date proves to be real, we believe that 1,850 and 23,500 could serve as medium-term mileposts to keep in mind for around 2020.
Stocks likely to fluctuate quarter by quarter in 2019
As we discuss below, we expect Japanese stocks to repeat upward and downward movements quarter by quarter. Our basic view is that investors who buy at current levels should see the end of 2018 and Apr-Jun 2019 as appropriate timing to lock in profits.
In the near term, we expect the Nikkei 225 to rebound to 23,000 and the TOPIX to 1,750. We then expect Japanese stocks to weaken in Jan-Mar 2019, ending March at 22,000 for the Nikkei 225 and 1,650 for the TOPIX. Points to watch here include: (1) the impact of the expected rate hike by the US Fed in December 2018; (2) the possibility of complications in Brexit negotiations; and (3) Oct-Dec 2018 results at US companies. We expect the market's focus in Apr-Jun to be on expectations for policy. With expectations for yen depreciation versus the dollar, we look for Japanese stocks to strengthen, and we forecast the Nikkei 225 at 24,000 and the TOPIX at 1,800 at end-June.
2019 consumption tax hike and Japanese stocks: mid-2019 is the real concern
In Jul-Sep 2019, the consumption tax rate hike scheduled for October could weigh heavily on share prices, and we expect concerns to arise over this impact. We do not think real judgments can be made about whether the Japanese economy has been able to ride out the consumption tax rate hike until 2020. In "Analyst's perspective", our analysts discuss their views on the consumption tax rate hike from the perspective of the housing, retail, restaurant, and foods sectors.
We still recommend avoiding small-cap stocks; focus on multiple investment themes
We continue to recommend avoiding small-cap stocks. With Japan facing population decline and labor shortages, we believe there will be an ongoing focus on growing the overall demand pie via efforts to win inbound demand, boosting productivity via the use of robotic process automation (RPA), and the acceptance of foreign nationals to fortify the labor force. Also, with recent conditions making sustained profit growth more of a challenge, we will be focusing on management efforts and decision-making at companies aiming to further improve their earnings. The 2020 Tokyo Olympics are approaching, but prior to that, the decision on hosting rights for the World Expo 2025 is slated for 23 November. In this month’s "Investment theme" section, we look at prospects for an Osaka/Kansai-hosted World Expo and related stocks.
Global Markets Research
9 November 2018
Research analysts
Equity Strategy
Hisao Matsuura - NSC hisao.matsuura@nomura.com +81 3 6703 1814
Masaki Motomura - NSC masaki.motomura@nomura.com +81 3 6703 1119
Boqiong Wang - NSC boqiong.wang@nomura.com +81 3 6703 1217
Naoya Fuji - NSC naoya.fuji@nomura.com +81 3 6703 1245
Japan food
Ryozo Minagawa - NSC ryozo.minagawa@nomura.com +81 3 6703 1221
Satoshi Fujiwara - NSC satoshi.fujiwara@nomura.com +81 3 6703 1211
Japan housing & real estate
Daisuke Fukushima - NSC daisuke.fukushima@nomura.com +81 3 6703 1150
Japan retailing
Hidehiko Aoki, CFA - NSC hidehiko.aoki@nomura.com +81 3 6703 1124
Kosuke Narikiyo - NSC kousuke.narikiyo@nomura.com +81 3 6703 1259
Japanese version published on November 9, 2018
Production Complete: 2018-11-09 10:13 UTC
See Appendix A-1 for analyst certification, important disclosures and the status of non-US analysts.

vk.com/id446425943 |
9 November 2018 |
No ura | Japanese equities investment strategy (November 2018) |
Contents
1. |
Market outlook: outlook for Japanese equities heading into 2019.......................................................... |
3 |
|
|
(1) |
Short-term outlook: expecting rebound in Japanese equities ............................................................................ |
3 |
|
(2) |
US corporate earnings and valuations for US equities ...................................................................................... |
5 |
|
(3) |
FY18 Q2 results for Japanese companies: recurring profit growth lower than expected .................................. |
6 |
|
(4) |
Rough idea of what Japanese equities will look like in 2019: expecting ongoing quarterly fluctuations ........... |
7 |
|
(5) |
Key points in equity supply-demand: individual investors and the BOJ........................................................... |
11 |
|
(6) |
Corporate governance reforms: look back at 2018 thus far and focus points for 2019 ................................... |
12 |
|
(7) |
Five new inclusions in our Nomura strategists' equities portfolio..................................................................... |
16 |
2. |
Nomura strategists’ equities portfolio ................................................................................................... |
18 |
|
3. |
Supply-demand: signs of lull in selling of futures by nonresident investors.......................................... |
21 |
|
4. |
Investment theme: Osaka-Kansai Expo 2025 ...................................................................................... |
26 |
|
5-1 Analyst's perspective: restaurant industry initiatives aimed at tapping into demand from foreign |
|
||
tourists ...................................................................................................................................................... |
32 |
||
5-2. Analyst's perspective: 2019 consumption tax hike ............................................................................ |
33 |
||
6. |
Basic data on Japanese equities.......................................................................................................... |
36 |
|
Appendix A-1 ............................................................................................................................................ |
46 |
||
|
|
|
|
2

vk.com/id446425943 |
9 November 2018 |
No ura | Japanese equities investment strategy (November 2018) |
1. Market outlook: outlook for Japanese equities heading into 2019
(1) Short-term outlook: expecting rebound in Japanese equities
Japanese equities dragged down by global share price decline in October
Looking at trading trends by major investor category (cash equities and equity futures combined) for the first four weeks of October (1-26 October), nonresident investors were net sellers of Japanese equities for the first three weeks straight, at over ¥1trn. In our 11 October Global Research report Nikkei 225 falls back from 23,000 barrier again, we stated that "at present, our expected range for the Nikkei 225 is 22,000-24,000", but the Nikkei 225 fell below the bottom end of this range during intraday trading on 23 October. On 26 October, the Nikkei 225 hit 20,971.93, down 14% from the 2 October intraday high of ¥24,448.07.
Market sentiment looks like it has settled and is gradually starting to pick back up
Meanwhile, the S&P 500, which was down 11% from its high, rebounded once it approached 2,600. This might be because investors had been awaiting the outcome of two big events, namely the US midterm elections and the US-China summit, but with the VIX (the CBOE Volatility Index, a popular measure of the implied volatility of index options) falling slightly below 20, it looks like market sentiment has settled and is gradually starting to pick back up.
Two major events: US midterm elections, US-China summit
Two major events are on the schedule for November, the US midterm elections and the US-China summit. In particular, if the US and China can come to an agreement during their talks, the hike in tariffs (from 10% to 25%) on Chinese goods set to go into effect starting in January 2019 could be stopped and additional tariffs on Chinese imports ($267bn worth of goods) could be suspended indefinitely. On the other hand, if the US and China cannot come to terms, the January 2019 tariff hike and the additional tariffs will be fast approaching.
We expect short-term rebounds based on what we saw in Feb-Apr 2018
While it will be important to keep a close eye on what kind of an impact the two aforementioned events have on share prices, based on the rebound in share prices through April 2018 that we saw after the sharp drop in February 2018, our basic view is that the Nikkei 225 will rebound to 23,000 and the TOPIX will rebound to 1,750 in the short term.
Negative news about earnings should taper off once the results season finishes up
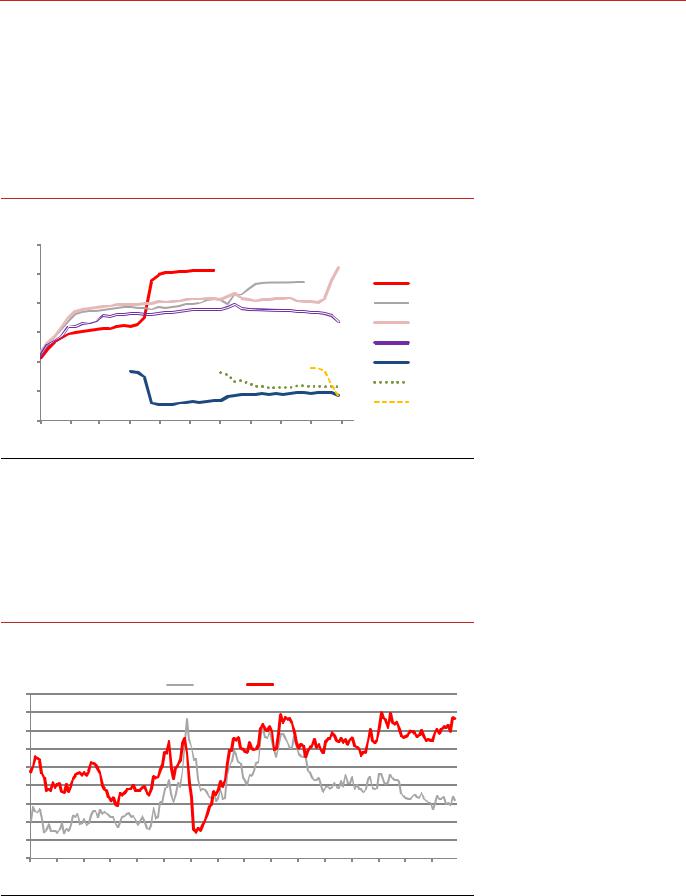
As of 4 November, the revision index for forecast recurring profits for companies in the Russell/Nomura Large Cap Index (ex financials) is at –23.7% for FY18 and –31.2% for FY19 (Figure 1). We expect downward revisions to continue to outnumber upward revisions, but considering (1) that the revision index is already at its lowest level since late April 2018 and (2) that we are already halfway through the FY18 Q2 results season, we believe that the revision index is likely to stop falling at around –30%, and we believe that we are unlikely to see further deterioration in the revision index in the latter half of November. There will undoubtedly be less news about earnings once the results season comes to an end, and we therefore believe that the depressed TOPIX P/E level will be more likely to recover at that point.
3

vk.com/id446425943 |
9 November 2018 |
No ura | Japanese equities investment strategy (November 2018) |
Fig. 1: Revision index and TOPIX P/E
P/E should come back up once revision index stops falling
|
|
|
|
|
|
|
TOPIX 12m forward P/E |
|
(x) |
17.0 |
||
|
|
|
|
|
|
|
|
|
16.5 |
|||
|
|
|
|
|
|
|
|
|
|
|
|
|
|
|
|
|
|
|
|
|
|
|
|
|
16.0 |
|
|
|
|
|
|
|
|
|
|
|
|
15.5 |
|
|
|
|
|
|
|
|
|
|
|
|
15.0 |
|
|
|
|
|
|
|
|
|
|
|
|
14.5 |
|
(%) |
|
|
|
|
|
|
|
|
|
|
14.0 |
|
|
|
|
|
|
|
|
|
|
|
13.5 |
|
100.0 |
|
|
|
|
|
|
|
|
|
|
|
|
|
|
|
|
|
|
|
|
|
|
|
|
13.0 |
80.0 |
|
|
|
|
|
|
|
|
|
|
|
12.5 |
|
|
|
|
|
Revision Index |
|
|
|
|
|
12.0 |
|
60.0 |
|
|
|
|
|
|
|
|
|
|
||
|
|
|
|
This FY |
|
Next FY |
|
|
|
|
|
|
|
|
|
|
|
|
|
|
|
|
|
||
40.0 |
|
|
|
|
|
|
|
|
|
|
|
|
20.0 |
|
|
|
|
|
|
|
|
|
|
|
|
0.0 |
|
|
|
|
|
|
|
|
|
|
|
|
-20.0 |
|
|
|
|
|
|
|
|
|
|
|
|
-40.0 |
|
|
|
|
|
|
|
|
|
|
|
|
-60.0 |
|
|
|
|
|
|
|
|
|
|
|
|
13/1 |
13/7 |
14/1 |
14/7 |
15/1 |
15/7 |
16/1 |
16/7 |
17/1 |
17/7 |
18/1 |
18/7 |
|
|
|
|
|
|
|
|
|
|
|
|
(yy/m) |
|
Note: Revision index for recurring profits of Russell/Nomura Large Cap Index (ex financials) stocks. For TOPIX 12-month forward P/E, Nomura estimates used where available, supplemented by Toyo Keizai estimates. TOPIX 12-month forward P/E is as of 2 November 2018; revision index is as of 4 November 2018.
Source: Nomura, based on TSE and Toyo Keizai
We expect the NT ratio to fall in the near term
Based on our outlooks for the Nikkei 225 and the TOPIX noted above, we assume an NT ratio of 13.1x, down slightly from the ratio of 13.4x on 2 November (Figure 2). In the August 2018 edition of our Japan equities investment strategy report, we noted that we expected the NT ratio to rise to 13.5x, but we now expect the NT ratio to fall in the near term. We are also taking into account that a warm winter could create headwinds for apparel and department store stocks, a view we also mentioned in our 17 October Global Research report El Nino and Japanese stocks.
Fig. 2: NT ratio
NT ratio 13.4x as of 2 November, compared with our earlier year-end forecast of 13.5x
(x) |
|
|
|
|
|
|
|
|
|
|
|
14 |
|
|
|
|
|
|
|
|
|
|
|
13 |
|
|
|
|
|
|
|
|
|
|
|
12 |
|
|
|
|
|
|
|
|
|
|
|
11 |
|
|
|
|
|
|
|
|
|
|
|
10 |
|
|
|
|
|
|
|
|
|
|
|
9 |
|
|
|
|
|
|
|
|
|
|
|
98 |
00 |
02 |
04 |
06 |
08 |
10 |
12 |
14 |
16 |
18 |
(CY) |
Note: NT ratio is Nikkei 225 ÷ TOPIX. Monthly data; most recent data as of 2 November 2018.
Source: Nomura, based on TSE and Toyo Keizai
4
vk.com/id446425943 |
9 November 2018 |
No ura | Japanese equities investment strategy (November 2018) |
(2) US corporate earnings and valuations for US equities
US corporate earnings higher than expected
The estimates compiled by Thomson Reuters put S&P500 EPS growth at +26.0% y-y in 2018 Q3 (Jul-Sep). Results announcements have pushed up that outlook a full 6ppt from the end-September 2018 forecast of +20.2% y-y (Figure 3). The forecast for Q4 is +16.7%, which is down slightly from the +18.5% forecast as of end-September, but it is often that case that when actual EPS growth ends up being higher than expected, the forecast for the next quarter is revised down. We note that the forecast for full-year 2018 EPS growth was revised up from +21.4% y-y to +22.0% as well.
Fig. 3: Quarterly y-y EPS growth rates for the S&P 500
2018 Q3 forecast is +26.0%, up from +20.2% at end-September
30% |
|
|
|
|
|
|
|
|
|
|
|
25% |
|
|
|
|
|
|
|
|
|
|
CY18 Q1 |
|
|
|
|
|
|
|
|
|
|
|
|
20% |
|
|
|
|
|
|
|
|
|
|
Q2 |
15% |
|
|
|
|
|
|
|
|
|
|
Q3 |
|
|
|
|
|
|
|
|
|
|
Q4 |
|
|
|
|
|
|
|
|
|
|
|
|
|
10% |
|
|
|
|
|
|
|
|
|
|
CY19 Q1 |
5% |
|
|
|
|
|
|
|
|
|
|
Q2 |
|
|
|
|
|
|
|
|
|
|
Q3 |
|
|
|
|
|
|
|
|
|
|
|
|
|
0% |
|
|
|
|
|
|
|
|
|
|
|
1/5 |
2/5 |
3/5 |
4/5 |
5/5 |
6/5 |
7/5 |
8/5 |
9/5 |
10/5 |
11/5 |
(m/d) |
|
|
|
|
|
|
|
|
|
|
|
Note: EPS is based on estimates compiled by Thomson Reuters; most recent data as of 2 November 2018.
Source: Nomura, based on S&P and Thomson Reuters data
S&P 500 yield spread is 3.15%
As for valuations, the S&P 500 yield spread (prospective earnings yield minus the 10year Treasury yield) stood at 3.15% as of 2 November (Figure 4). The yield spread fell below 2.7% in January and 2.8% in September, and in both cases a subsequent surge in long-term interest rates dealt a major blow to share prices.
Fig. 4: S&P 500 and TOPIX yield spreads (prospective earnings yield - 10-year government bond yield)
S&P 500 yield spread is 3.15%
(%) |
|
|
|
|
|
S&P500 |
|
TOPIX |
|
|
|
|
|
||
9 |
|
|
|
|
|
|
|
|
|
|
|
||||
|
|
|
|
|
|
|
|
|
|
|
|
|
|
|
|
8 |
|
|
|
|
|
|
|
|
|
|
|
|
|
|
|
7 |
|
|
|
|
|
|
|
|
|
|
|
|
|
|
|
6 |
|
|
|
|
|
|
|
|
|
|
|
|
|
|
|
5 |
|
|
|
|
|
|
|
|
|
|
|
|
|
|
|
4 |
|
|
|
|
|
|
|
|
|
|
|
|
|
|
|
3 |
|
|
|
|
|
|
|
|
|
|
|
|
|
|
|
2 |
|
|
|
|
|
|
|
|
|
|
|
|
|
|
|
1 |
|
|
|
|
|
|
|
|
|
|
|
|
|
|
|
0 |
|
|
|
|
|
|
|
|
|
|
|
|
|
|
|
03 |
04 |
05 |
06 |
07 |
08 |
09 |
10 |
11 |
12 |
13 |
14 |
15 |
16 |
17 |
18 |
|
|
|
|
|
|
|
|
|
|
|
|
|
|
|
(CY) |
Note: Prospective earnings yield based on 12-month forward EPS forecasts, month-end values. EPS for S&P 500 is based on estimates compiled by Thomson Reuters; EPS for TOPIX is based on Nomura forecasts (supplemented by Toyo Keizai forecasts). Most recent data as of 2 November 2018.
Source: Nomura, based on Thomson Reuters, Fed, Toyo Keizai, and Japan Bond Trading data
5
vk.com/id446425943 |
9 November 2018 |
No ura | Japanese equities investment strategy (November 2018) |
Further contraction in the yield spread could raise concerns
The current yield spread of 3.15% is slightly lower than the average since 2017 (3.19%), but is not at a level likely to raise concerns about share prices being too high. If the yield spread were to contract further, however, it could raise concerns among market participants.
(3) FY18 Q2 results for Japanese companies: recurring profit growth lower than expected
FY18 Q2 sales up 3.6%, recurring profits up 0.8%
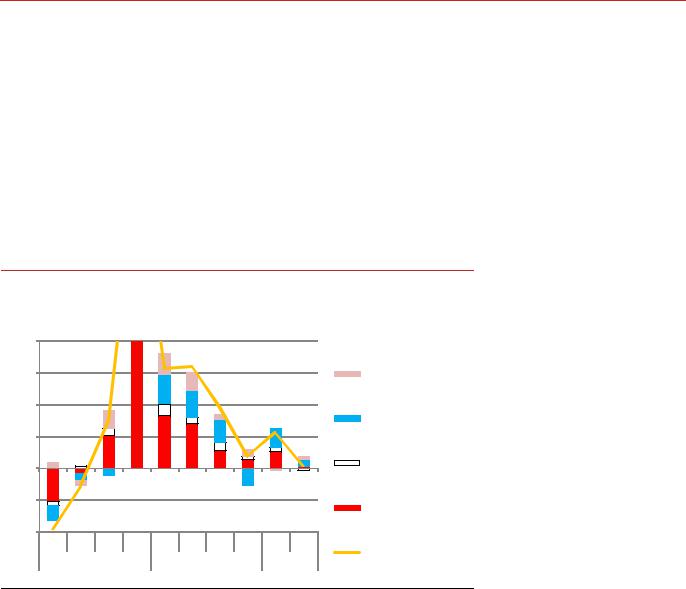
As of 2 November, 58% of the stocks (176 companies) in the Russell/Nomura Large Cap Index (ex financials) had announced results (Figure 5). In FY18 Q2 (Jul-Sep), sales were up 3.6% y-y and recurring profits were up 0.8% (versus +5.0% and +11.1%, respectively, in Q1).
Fig. 5: Contributions to quarterly recurring profit growth (Russell/Nomura Large Cap
Index (ex financials)
FY18 Q2 sales up 3.6%, recurring profits up 0.8%
(%-y-y) |
|
|
|
|
|
|
|
|
|
Utilities |
40 |
|
|
|
|
|
|
|
|
|
|
30 |
|
|
|
|
|
|
|
|
|
Other manufacturing, |
|
|
|
|
|
|
|
|
|
|
nonmanufacturing (ex |
20 |
|
|
|
|
|
|
|
|
|
utilities) |
|
|
|
|
|
|
|
|
|
Electrical machinery, |
|
|
|
|
|
|
|
|
|
|
|
|
10 |
|
|
|
|
|
|
|
|
|
precision equipment |
|
|
|
|
|
|
|
|
|
|
|
0 |
|
|
|
|
|
|
|
|
|
Autos |
|
|
|
|
|
|
|
|
|
|
|
-10 |
|
|
|
|
|
|
|
|
|
Materials, machinery, |
|
|
|
|
|
|
|
|
|
|
|
-20 |
|
|
|
|
|
|
|
|
|
trading companies |
|
|
|
|
|
|
|
|
|
|
|
Q1 |
Q2 |
Q3 |
Q4 |
Q1 |
Q2 |
Q3 |
Q4 |
Q1 |
Q2E |
Ex financials |
|
FY16 |
|
|
FY17 |
|
FY18 |
||||
|
|
|
|
|
||||||
Note: Universe is Russell/Nomura Large Cap Index (ex financials) companies that had released results as of 2 November.
Source: Nomura, based on company disclosure materials
Sales growth rate roughly as expected, but...
From a top-down perspective, we had expected Russell/Nomura Large Cap (ex financials) sales and recurring profit growth nearly 5% and nearly 10% respectively in Q2, following growth of just over 5% and nearly 13% in Q1. The decline in sales growth from Q1 to Q2 was roughly within the bounds of the deterioration in the macro economy.
Recurring profit growth weak, lower than expected; looking increasingly likely that profits will fall in Q3
Recurring profit growth (+0.8%) was, however, weak and lower than expected. While it is difficult to make any definitive judgments since the results season is still under way, we believe that the rise in raw materials prices, labor costs, and depreciation expenses may be starting to act as a drag on profits. Considering current macroeconomic conditions, we believe it is highly likely that sales growth will fall further in Q3. While profits were up slightly in Q2, it is starting to look like profits could even swing downward in Q3.
6

vk.com/id446425943 |
9 November 2018 |
No ura | Japanese equities investment strategy (November 2018) |
(4) Rough idea of what Japanese equities will look like in 2019: expecting ongoing quarterly fluctuations
Japanese equities currently look undervalued
We still believe that Japanese equities look undervalued at this time. The P/E for the TOPIX based on 12-month forward bottom-up EPS forecasts was 12.8x as of 5 November, essentially the lower end of the range seen since 2013. Even when taking into account the possibility of further downward revisions to FY18 recurring profit forecasts, we believe share prices are basically at a level that should make investment in Japanese equities attractive.
Not including end-2019 outlook for Japanese equities in this month's report, but...
This report was being put together on 6 November, immediately prior to the US midterm elections and with only around half of all companies having announced their Q2 results, making it difficult to formulate an outlook for corporate earnings. As a result, we will refrain from including an outlook for end-2019 share prices in this month's edition of this report.
We see 1,850 and 23,500 as medium-term mileposts for the TOPIX and Nikkei 225
That said, even if earnings fluctuate a bit, if the improvement in Japanese earnings seen to date proves to be real, we believe that 1,850 and 23,500 could serve as medium-term mileposts to keep in mind for around 2020. We estimate a fair-value P/B of 1.25x considering the average forward ROE of 8.9% since 2013 (Figure 6). Even if we assume forward EPS were to remain flat in FY18 and beyond, we estimate 1,850 to be an appropriate level for the TOPIX based on FY20 BPS of 1,482.
Fig. 6: TOPIX-ROE and P/B ratio
Fair-value P/B of 1.25x based on forward ROE of 9%
(P/B, x) |
|
|
|
|
|
|
1.5 |
|
|
y = 0.1326x + 0.0732 |
|
|
|
|
|
|
|
|
||
|
|
|
R² = 0.4743 |
|
|
|
1.4 |
|
|
|
|
|
|
1.3 |
|
|
|
|
|
|
1.2 |
|
|
|
|
|
|
1.1 |
|
|
|
|
Nov-2018 |
|
|
|
|
|
|
|
|
1.0 |
|
|
|
|
|
|
7.0 |
7.5 |
8.0 |
8.5 |
9.0 |
9.5 |
10.0 |
|
|
|
|
(Prospective 12month estimated ROE, %) |
||
Note: Shows forecast ROE and P/B ratios at the end of each month from January 2013 onwards. Forecast ROE = forecast 12-month forward EPS / (the average of actual BPS and current-year forecast BPS). Current-year forecast BPS calculated based on current-year forecast EPS and current-year forecast DPS. Forecast EPS and forecast DPS estimated by Nomura, supplemented by Toyo Keizai data. November 2018 data is as of 2 November.
Source: Nomura, based on Toyo Keizai, Tokyo Securities Exchange (TSE) data
Stocks likely to fluctuate quarter by quarter in 2019
As we discuss below, we expect Japanese stocks to repeatedly move upward and downward quarter by quarter. Based on this, our basic view is that investors who buy at current levels should see the end of 2018 and the Apr-Jun 2019 quarter as appropriate timing to lock in profits.
Fallback in Jan-Mar
We look for Japanese stocks to weaken in Jan-Mar 2019, and forecast the Nikkei 225 at 22,000 and the TOPIX at 1,650 at end-March. In the September 2018 edition of our Japan equities investment strategy report, we had forecast a range of 25,000-25,500, but this level now looks more difficult to reach. Points to watch here include: (1) the impact on 10-year US Treasury yields of the expected rate hike at the December 2018 US
7

vk.com/id446425943 |
9 November 2018 |
No ura | Japanese equities investment strategy (November 2018) |
Federal Open Market Committee (FOMC) meeting; (2) the possibility of complications in Brexit negotiations; and (3) Oct-Dec 2018 results at US companies.
Concerns over a hard Brexit (the UK leaving the EU without an agreement)
21 January 2019 is widely seen as the deadline for the UK's negotiations with the EU over Brexit. Even if an agreement is eventually reached, we expect financial markets to react negatively to any complications in the negotiations as this deadline nears.
Timing for concerns over slowdown in US corporate profits
Although US corporations are expected to maintain high profit growth through the OctDec 2018 quarter (Thomson Reuters estimates put profit growth at +16.7% y-y), profit growth is expected to slow in Jan-Mar 2019 as the boost from tax reforms runs its course (+4.2% y-y). Around Oct-Dec results announcements in Jan-Feb, we expect the market's attention to turn inexorably toward the expected slowdown in profit growth.
Rally in Apr-Jun on policy expectations
We expect the market's focus in Apr-Jun to be on expectations for policy, and we expect Japanese stocks to strengthen. With expectations for yen depreciation versus the dollar, we forecast the Nikkei 225 at 24,000 and the TOPIX at 1,800 at end-June.
Unified local elections coming up in April 2019, followed by Upper House elections in July 2019
Unified local elections are coming up in April 2019, to be followed by Upper House elections in July. The LDP Diet members who were part of their party's decisive victory in the Upper House in 2013 are reaching the end of their terms, and the prevailing view is that the LDP will be hard pressed to retain such a high number of seats. If the LDP fails to secure a two-thirds majority in the Upper House, the path toward constitutional reform would become rockier, and, depending on the results, we even see the possibility of the Abe administration becoming a lame duck Cabinet. We think expectations for policy changes are likely to rise as the LDP floats various proposals in order to avoid such an outcome. Markets could also be favorably affected to some extent by the impact on domestic business sentiment from the celebratory mood likely to accompany the enthronement of the new emperor.
Japanese stocks likely to fall in Jul-Sep as markets fixate on consumption tax hike
In the Jul-Sep quarter, the consumption tax rate hike should loom large. It would seem natural to begin with the assumption that the tax hike will go forward as planned. If the LDP initiates the process for constitutional amendments in the mid-2019 Diet session and calls a referendum at end-2019, we think negative real GDP growth in the Jul-Sep and Oct-Dec 2018 quarters would heighten the possibility that the consumption tax rate hike will be postponed.
Market attention turned toward the 2014 consumption tax hike beginning around the start of 2014
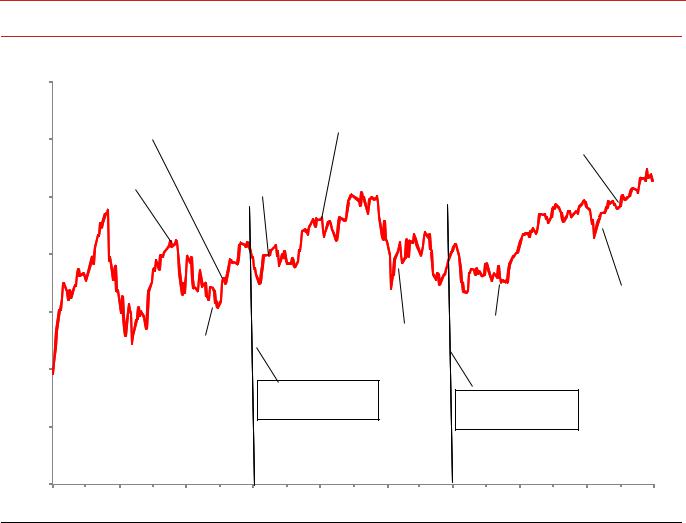
The Cabinet made its decision on the 2014 consumption tax hike on 1 October 2013. It was not until the beginning of 2014, however, that deterioration in business sentiment began to adversely affect share prices (Figure 7). While interest in the consumption tax rate hike does seem strong recently, we think the Jul-Sep 2019 quarter is when we should be most concerned over a negative impact on share prices.
8
vk.com/id446425943 |
9 November 2018 |
No ura | Japanese equities investment strategy (November 2018) |
Fig. 7: Consumption tax hike (2014) and the TOPIX
Deterioration in business sentiment from consumption tax rate hike began to adversely affect share prices at beginning of 2014
1,500
1,400
1,300
1,200
1,100
1,000
900
800
7 Sep 2013 Tokyo awarded 2020 Olympics
21 Jul 2013 Upper House election
ends split Diet
5 Dec 2013 Cabinet approves measures aimed at inducing a positive
economic cycle
15 Oct 2013 Diet session for growth strategies
8 Sep 2014
Aug Economy Watchers Survey First fall in current conditions DI in four months
26 Aug 2013
4 Apr 2013 Expert panel on BOJ quantitative &consumption tax hike qualitative easing
10 Feb 2014
Future conditions DI of Economy Watchers Survey falls below 50
1 Oct 2013 Cabinet approves
consumption tax hike
15 May 2014
Japan Q1 GDP up 5.9% y-y annualized
1 Apr 2014 Consumption tax rate hiked from 5% to 8%
13/4 |
13/6 |
13/8 |
13/10 |
13/12 |
14/2 |
14/4 |
14/6 |
14/8 |
14/10 |
|
|
|
|
|
|
|
|
|
(yy/m) |
Source: Nomura, based on TSE data and various news reports
Whether economy can ride out the consumption tax hike cannot be judged until 2020
We think economic indicators will inevitably worsen in the first 2-3 months after the consumption tax hike, but it is likely to be difficult to judge whether this is merely a backlash from the frontloaded demand ahead of the hike. For this reason, we initially expect a rebound in share prices after the hike. We do not think real judgments can be made about whether the Japanese economy was able to ride out the consumption tax hike until 2020.
Please see "Analyst's perspective" below for our analysts' views on the impact of the consumption tax rate hike on the housing, retail, restaurant, and foods sectors.
Cautionary points for 2019
Some points of caution we would raise for 2019 include the possible inversion of the US long-short interest rate spread and the possibility of creditworthiness concerns.
(1) Inversion of US long-short spread
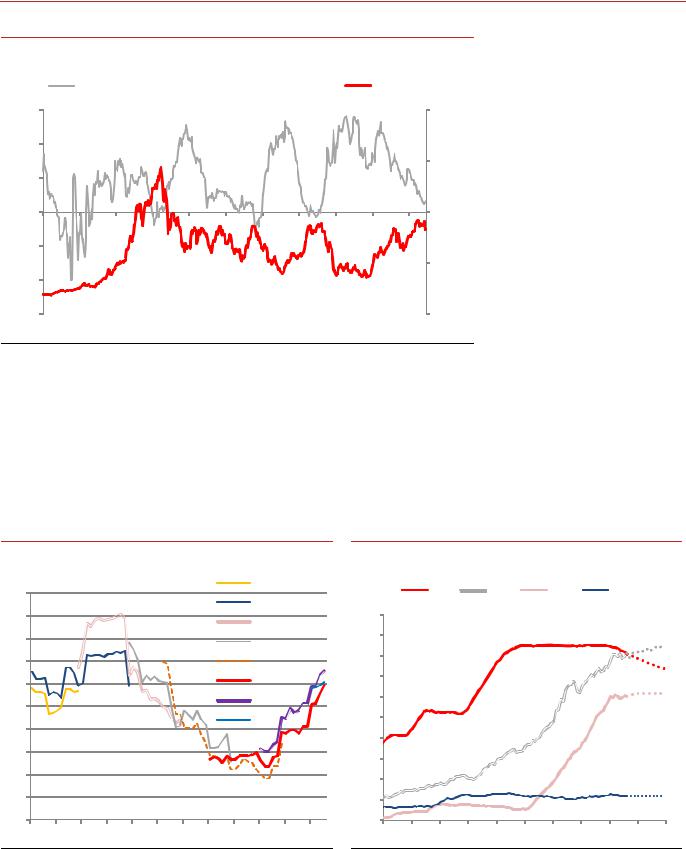
Our view is that the US yield curve is likely to invert in mid-2019. However, shortand long-term interest rates are currently only 31bp apart, and thus we may need to consider the possibility that the curve could invert sooner than expected. An inversion of the yield curve would probably produce considerable volatility on the stock market.
9
vk.com/id446425943 |
9 November 2018 |
No ura | Japanese equities investment strategy (November 2018) |
Fig. 8: US long-short spread vs. TOPIX
US long-short spread only 31bp |
|
(ppt) |
(pts) |
US long-short spread (10year yield - 2year yield, lhs) |
TOPIX (rhs) |
3.00 |
|
|
|
|
|
|
|
|
|
|
4,000 |
2.00 |
|
|
|
|
|
|
|
|
|
|
|
|
|
|
|
|
|
|
|
|
|
|
3,000 |
1.00 |
|
|
|
|
|
|
|
|
|
|
|
0.00 |
|
|
|
|
|
|
|
|
|
|
2,000 |
-1.00 |
|
|
|
|
|
|
|
|
|
|
|
|
|
|
|
|
|
|
|
|
|
|
1,000 |
-2.00 |
|
|
|
|
|
|
|
|
|
|
|
-3.00 |
|
|
|
|
|
|
|
|
|
|
0 |
77 |
81 |
85 |
89 |
93 |
97 |
01 |
05 |
09 |
13 |
17 |
(CY) |
Source: Nomura, based on Fed and TSE data
(2) Creditworthiness concerns
With rate hikes being implemented around the world but supply of additional liquidity only limited, conditions appear likely to remain unfavorable, particularly for countries with current account deficits (Figures 9 and 10). We think credit concerns will need to be avoided to curb the spread of risk around the world. The credit default swap (CDS) index, which shows the risk of default by major European financial institutions, is likely to be a key indicator for judging whether this will adversely affect the financial system (Figure 11).
Fig. 9: Global policy interest rates
Rate hikes likely to continue globally
(%) |
2013 |
|
4.0 |
2014 |
|
3.8 |
||
2015 |
||
|
||
3.6 |
2016 |
|
|
||
3.4 |
2017 |
|
3.2 |
2018 |
|
3.0 |
2019 |
|
2020 |
||
2.8 |
||
|
||
2.6 |
|
|
2.4 |
|
|
2.2 |
|
|
2.0 |
(yy/m) |
|
|
||
13/1 13/7 14/1 14/7 15/1 15/7 16/1 16/7 17/1 17/7 18/1 18/7 |
||
Note: Calculated using each country's adjusted share of world GDP. Nomura forecasts for FY18 and beyond.
Source: Nomura, based on data from central banks of each country
Fig. 10: Balance sheets of major central banks
Balance sheet expansion coming to a close
($trn) |
Fed |
BOJ |
ECB |
BOE |
|
5.0 |
|
|
|
|
|
4.5 |
|
|
|
|
|
4.0 |
|
|
|
|
|
3.5 |
|
|
|
|
|
3.0 |
|
|
|
|
|
2.5 |
|
|
|
|
|
2.0 |
|
|
|
|
|
1.5 |
|
|
|
|
|
1.0 |
|
|
|
|
|
0.5 |
|
|
|
|
|
0.0 |
|
|
|
|
(CY) |
2010 2011 2012 2013 2014 2015 2016 2017 2018 2019 |
|||||
Note: Data for October 2018 onwards are Nomura estimates.
Source: Nomura, based on Bloomberg data
10