

Nordea - Russia View_watermark
.pdfvk.com/id446425943
Market Research
8 August 2019
Russia View
August 2019: Five years under sanctions
Summer 2019 marks the fifth anniversary of sanctions against Russia. Personal sanctions started to be imposed back in March 2014, after the events in Crimea, but the bulk of the major economic sanctions followed in July 2014. We inaugurate our Russia View monthly with a comprehensive account of changes in the Russian economy over this period. Over the last five years, the Russian economy has been on a much lower trajectory compared to previous growth cycles. Poor demographics, weakness in the business climate, and tighter fiscal and monetary policies are the primary reasons we see for the sluggish growth, but we believe sanctions have also played a non-negligible role.
Nordea Markets - Analysts
Tatiana Evdokimova, Chief Economist Russia +7 495 777 34 77 4194 tatiana.evdokimova@nordea.com
Macro: The Russian way to cope with sanctions
The most notable trends of the period under sanctions are: 1) a much higher |
USD/RUB FORECASTS |
||
uncertainty level; 2) efforts to reduce dollar dependence; 3) foreign trade |
|
|
|
|
|
|
|
turning East; and, 4) a much higher reliance of local financial resources. FDI has |
|
|
|
never returned to pre-sanctions levels. |
|
|
|
|
|
|
|
A constantly changing sanctions framework makes sanctions more painful by increasing uncertainty. This uncertainty, together with weakness of internal demand, is keeping Russian potential growth at around 1.5%, with not so many clear drivers for faster growth.
RUB: The tide is turning
The RUB, which was showing a very strong performance in the first half of the year, could not weather a deterioration of risk sentiment in August. A fresh sanctions wave added fuel to the fire, reminding investors of the fact that the sanctions story is not off the table. We expect that RUB risks will continue to be tilted to the downside as long as global risk sentiment remains impaired.
UNCERTAINTY IS ONE OF THE KEY CHALLENGES FOR |
|
|
|
FDI INFLOWS NEVER RETURNED TO PRE-SANCTION LEVELS |
||||||||||||||||||||||
BUSINESS |
|
|
|
|
|
|
|
|
|
|
|
|
|
|
|
|
|
|
|
|
|
|
|
|
||
|
|
|
|
|
|
|
|
|
|
|
|
|
|
|
|
|
|
|
|
|
|
|
|
|||
|
|
|
|
|
|
|
|
|
|
|
|
|
|
|
|
|
|
|
|
|
|
|
|
|
|
|
65 |
|
|
|
|
|
|
|
|
|
|
|
|
|
|
|
65 |
|
|
|
|
|
|
|
|
|
|
|
|
|
|
|
|
|
|
|
|
|
|
|
|
|
|
|
|
|
|
|
|
|
|
|
||
|
|
|
|
|
|
|
|
|
|
Share of respondents that have |
|
|
|
|
|
|
|
|
|
|
||||||
|
|
|
|
|
|
|
|
|
|
|
|
|
|
|
|
|
|
|
|
|
|
|||||
60 |
|
|
|
|
|
|
|
|
|
|
mentioned the factor as a challenge |
60 |
|
|
|
|
|
|
|
|
|
|
||||
|
|
|
|
|
|
|
|
|
|
|
|
|
|
|
|
|
|
|
|
|
|
|
|
|
||
55 |
|
|
|
|
|
|
|
|
|
|
|
|
|
|
|
55 |
|
|
|
|
|
|
|
|
|
|
|
|
|
|
|
|
|
|
|
|
|
|
|
|
|
|
|
|
|
|
|
|
|
|
|
||
50 |
|
|
|
|
|
|
|
|
|
|
|
|
|
|
|
50 |
|
|
|
|
|
|
|
|
|
|
|
|
|
|
|
|
|
|
|
|
|
|
|
|
|
|
|
|
|
|
|
|
|
|
|
||
45 |
|
|
|
|
|
|
|
|
|
|
|
|
|
|
|
45 |
|
|
|
|
|
|
|
|
|
|
|
|
|
|
|
|
|
|
|
|
|
|
|
|
|
|
|
|
|
|
|
|
|
|
|
||
40 |
|
|
|
|
|
|
|
|
|
|
|
|
|
|
|
40 |
|
|
|
|
|
|
|
|
|
|
|
|
|
|
|
|
|
|
|
|
|
|
|
|
|
|
|
|
|
|
|
|
|
|
|
||
35 |
|
|
|
|
|
|
|
|
|
|
|
|
|
|
|
35 |
|
|
|
|
|
|
|
|
|
|
|
|
|
|
|
|
|
|
|
|
|
|
|
|
|
|
|
|
|
|
|
|
|
|
|
||
|
|
|
|
|
|
|
|
|
|
|
|
|
|
|
|
|
|
|
|
|
|
|
|
|
||
30 |
|
|
|
|
|
|
|
|
|
|
|
|
|
|
|
30 |
|
|
|
|
|
|
|
|
|
|
25 |
|
|
|
|
|
|
|
Uncertaibty of economic situation |
|
|
25 |
|
|
|
|
|
|
|
|
|
|
|||||
|
|
|
|
|
|
|
|
|
|
|
|
|
|
|
|
|
|
|
||||||||
20 |
|
|
|
|
|
|
|
High taxes |
|
|
|
|
|
|
20 |
|
|
|
|
|
|
|
|
|
|
|
|
|
|
|
|
|
|
|
|
|
|
|
|
|
|
|
|
|
|
|
|
|
|
||||
|
|
|
|
|
|
|
Weakness of internal demand |
|
|
|
|
|
|
|
|
|
|
|
|
|
||||||
15 |
|
|
|
|
|
|
|
|
|
|
15 |
|
|
|
|
|
|
|
|
|
|
|||||
|
|
|
|
|
|
|
|
|
|
|
|
|
|
|
|
|
|
|
|
|
|
|
|
|
||
|
|
|
|
|
|
|
|
|
|
|
|
|
|
|
|
|
|
|
|
|
|
|
|
|
||
06 |
07 |
08 |
09 |
10 |
11 |
12 |
13 |
14 |
15 |
16 |
17 |
18 |
19 |
|
|
|
|
|
|
|
|
|
|
|
||
Source: Nordea and Macrobond
IMPORTANT INFORMATION AND DISCLOSURES AT THE END OF THIS REPORT
vk.com/id446425943
8 August 2019 |
Market Research |
|
|
Macro: Russian ways to cope with sanctions
Russia has been under Western sanctions for five years and it is time to assess the effects. The most notable trends we have seen during the period under sanctions include the following: 1) a much higher level of uncertainty; 2) efforts to reduce USD dependence; 3) foreign trade turning East; and 4) much higher reliance on local financial resources.
Sanctions snapshot |
To recap briefly, the sanctions of 2014 limited the ability of major Russian companies in |
|
the financial, energy and military sectors to borrow in the international financial |
|
markets (for periods longer than 14, 60, and 30 days, respectively). Technological |
|
sanctions imposed restrictions on supplying Russian companies with technology for |
|
exploration or production in deep-water, Arctic offshore, or shale projects. In 2017, US |
|
sanctions were toughened appreciably after the adoption of CAATSA (Countering |
|
America’s Adversaries Through Sanctions Act), which introduced the possibility of |
|
secondary sanctions applicable to any entity violating the sanctions against Russia. In |
|
2018, the risk of sanctions on Russian sovereign debt caused significant market |
|
volatility. |
The threat of more sanctions is sometimes more painful than actual sanctions
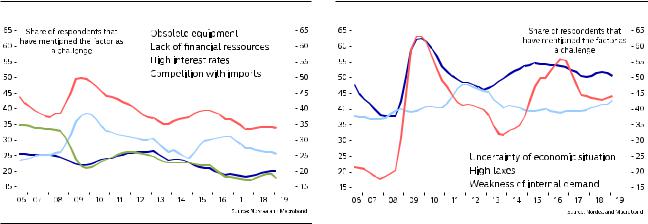
Sanctions have clearly made the situation in Russia more uncertain. As academic research shows, sanctions are more painful when they are modified often, which does not allow economic agents to fully adapt. That is exactly what is happening in the case of Russia. A persistent threat of additional sanctions is an important source of external volatility, as new sanctions (if any) could significantly influence the exchange rate and, as a result, inflation and interest rates. In this environment, forecasts become less reliable and investment decisions are more risky. Discomfort caused by higher economic uncertainty has been confirmed by corporate surveys. Among the key factors limiting growth potential, only weakness of internal demand is cited more often than uncertainty.
CHALLENGES THAT HAVE BECOME LESS ACUTE |
|
CHALLENGES THAT HAVE BECOME MORE ACUTE |
||||||||
|
|
|
|
|
|
|
|
|
|
|
|
|
|
|
|
|
|
|
|
|
|
|
|
|
|
|
|
|
|
|
|
|
|
|
|
|
|
|
|
|
|
|
|
|
|
|
|
|
|
|
|
|
|
|
|
|
|
|
|
|
|
|
|
|
|
|
|
|
|
|
|
|
|
|
|
|
|
|
|
|
|
|
|
|
|
|
|
|
|
|
|
|
|
|
|
|
|
|
|
|
|
|
|
|
|
|
|
|
|
|
|
|
|
|
|
|
|
|
|
|
|
|
|
|
|
|
|
|
|
|
|
|
|
|
|
|
|
|
|
|
|
|
|
|
|
|
|
|
|
|
|
|
|
|
|
|
|
|
|
|
|
|
|
|
|
|
|
|
|
|
|
|
|
|
|
|
|
|
|
|
|
|
|
|
|
|
Source for both charts above: Nordea and Macrobond
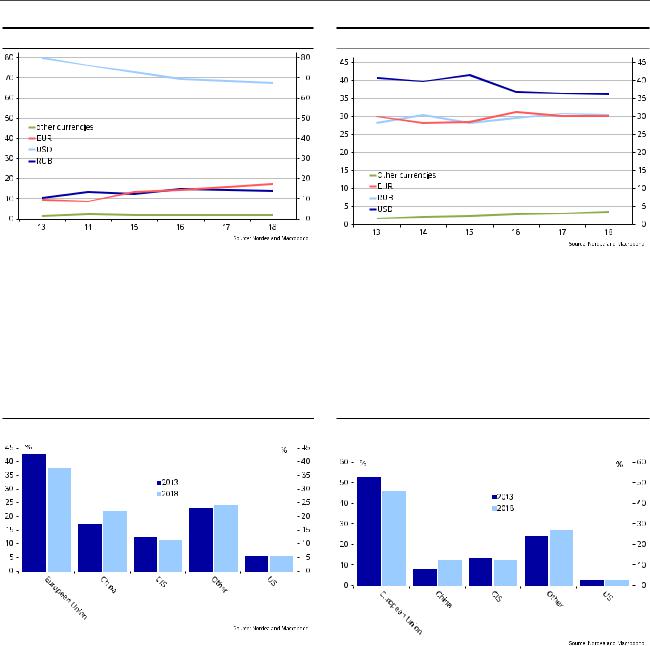
Reducing USD dependence |
Sometimes, the more complicated and slower processing of USD payments due to |
|
sanctions-induced checks has led to a decrease in the share of the USD in the FX |
|
structure of export and import payments. For now, the USD remains the primary |
|
payments currency, but sanction threats continue pushing companies towards other |
|
currencies. The USD share slide will likely continue, in our view. |
Turning East |
Back in 2014, Russian authorities strongly advocated for strengthening ties with Asia in |
|
response to the deteriorating relationship with the West. Five years later, the Chinese |
|
share of Russian imports has increased by 5 pp, while EU share has declined by the |
|
same amount. Interestingly, on a global scale, Europe has not experienced a |
|
comparable loss in the share of global imports (it has remained relatively stable at |
|
around 32%). In Russia, China in particular has been eating into Europe’s market share |
|
for electrical machinery and equipment. |
2
vk.com/id446425943
8 August 2019 Market Research
USD SHARE DECREASING IN EXPORT PAYMENTS USD SHARE DECREASING IN IMPORT PAYMENTS
The food embargo introduced by Russia in 2014 as a counter-sanctions measure explains around 1.5 pp of the decline in EU market share within Russia. These imports were partly substituted by imports from CIS and Latin America, and partly by local production. The share of imported food and agricultural projects has dropped considerably, falling from 17% down to 8% in the case of poultry and meat, and from 49% down to 30% for cheese, to name a few examples. The domestic Russian food industry has grown by one-quarter since the introduction of the embargo, while average industrial growth across all industries was just around 9%. Food prices, however, rose much faster during the past five years, suggesting that the political decision had a significant effect on consumers.
CHANGING GEOGRAPHY OF RUSSIAN IMPORTS |
|
CHANGING GEOGRAPHY OF RUSSIAN EXPORTS |
||||
|
|
|
|
|
|
|
|
|
|
|
|
|
|
|
|
|
|
|
|
|
|
|
|
|
|
|
|
|
|
|
|
|
|
|
|
|
|
|
|
|
|
|
|
|
|
|
|
|
|
|
|
|
|
|
|
|
|
|
|
|
|
|
|
|
|
|
|
|
|
|
|
|
|
|
|
|
|
|
|
|
|
|
|
|
|
|
|
|
|
|
|
|
|
|
|
|
|
|
|
|
|
|
|
|
|
|
|
|
|
|
|
|
|
|
|
|
|
|
|
|
|
|
|
|
|
Oil sector has yet to feel the full impact of sanctions
While agriculture and the food industry are among the beneficiaries of the sanctions regime, the oil sector is potentially the most vulnerable. A painful part of sanctions is restricted access to the technology and services used for oil production and exploration. The impact of such sanctions is not felt immediately, unlike that of financial restrictions, but in the long run their negative effects tend to accumulate and become more painful. Although the volume of oil extraction in Russia is currently at post-Soviet highs, this is largely the result of investments made during pre-sanction times. The official governmental forecasts imply stable oil extraction volumes on a 2024 horizon, but independent think-tanks forecast that Russian oil extraction will peak in 2020-21 and then gradually start to fall by ~1.5% per year, partly due to the technological difficulties of substituting exhausted oil fields with new ones.
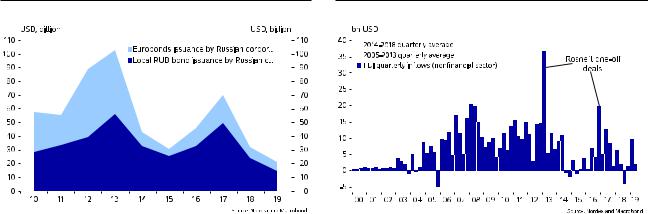
Sanctions result in lower financing from abroad and higher reliance on local sources
Restricted access to global financial markets, as imposed by sanctions, has put the Russian economy on a painful deleveraging path. External debt dropped from USD 728bn in 2013 down to USD 511bn in 2016 (with USD 114bn of this drop corresponding to actual debt reduction and the rest representing the effect of RUB depreciation on the USD value of RUB-denominated external debt). Five years after the introduction of sanctions, Russia's reliance on foreign borrowing is still considerably smaller than it used to be. When it comes to bond issuance, the share of financing obtained by Russian companies on foreign markets dropped to around one-quarter after the sanctions compared to around a half before sanctions. The situation is similar for bank financing, with the market for international syndicated loans to Russian companies being cut in half after sanctions.
3
vk.com/id446425943
8 August 2019 |
Market Research |
|
|
Financing in the form of FDI has also become scarce. FDI inflows have never recovered to pre-sanction levels. The largest drop in inflows occurred in the financial and retail sectors. The stagnating incomes of Russian consumers no longer offered promising business potential and the threat of new sanctions (as explained above) have led to increased uncertainty. Foreign banks' share in the total capital of the banking sector dropped from over 25% before sanctions to around 15% in 2019. Shrinking foreign bank presence reflects the decreasing international cooperation prospects and the financial restrictions on many major Russian companies.
RELATIVE SIZE OF BOND BORROWING LOCALLY AND ABROAD |
|
FDI INFLOWS NEVER RETURNED TO PRE-SANCTION LEVELS |
||||||||||
|
|
|
|
|
|
|
|
|
|
|
|
|
|
|
|
|
|
|
|
|
|
|
|
|
|
|
|
|
|
|
|
|
|
|
|
|
|
|
|
|
|
|
|
|
|
|
|
|
|
|
|
|
|
|
|
|
|
|
|
|
|
|
|
|
|
|
|
|
|
|
|
|
|
|
|
|
|
|
|
|
|
|
|
|
|
|
|
|
|
|
|
|
|
|
|
|
|
|
|
|
|
|
|
|
|
|
|
|
|
|
|
|
|
|
|
|
|
|
|
|
|
|
|
|
|
|
|
|
|
|
|
|
|
|
|
|
|
|
|
|
|
|
|
|
|
|
|
|
|
|
|
|
|
|
|
|
|
|
|
|
|
|
|
|
|
|
|
|
|
|
|
|
|
|
|
|
|
|
|
|
|
|
|
|
|
|
|
|
|
|
|
|
|
|
|
|
|
|
|
|
|
|
|
|
|
|
|
|
|
|
|
|
|
|
|
|
|
|
|
|
|
|
|
|
|
|
|
|
|
|
|
|
|
|
|
|
|
|
|
|
|
|
|
|
|
|
|
|
|
|
|
|
|
|
|
|
|
|
|
|
|
|
|
|
|
|
|
|
|
|
|
|
|
|
|
|
|
|
|
|
|
|
|
|
|
Sluggish growth set to continue Over the past five years, the Russian economy has been on a much lower trajectory compared to previous growth cycles. Poor demographics, business climate weaknesses, and tighter fiscal and monetary policies are the primary reasons for the sluggish growth, but we believe sanctions have also played a notable role. Russian potential growth estimates currently lie below 1.5% and for now we do not find many clear drivers that would push the economy to sustainably higher growth rates.
4

vk.com/id446425943
8 August 2019 |
Market Research |
|
|
RUB: the tide is turning
The RUB, which was showing a very strong performance in the first half of the year could not disregard a deterioration of risk sentiment in August. Risks are still tilted to the downside.
A very strong performance in The RUB showed an impressive performance over January-July, appreciating by 9.5% H1 2019 versus the USD, which was the best result among emerging market currencies. This
outperformance was a flip side of excessive RUB weakness last year, which was largely caused by sanctions threats that never materialised. Foreign investors that left the Russian market last year came back in 2019. In our view, this specific factor has amplified a relatively positive risk sentiment in the global markets early this year underpinned by the hopes for a trade deal and for a softer Fed stance.
A perfect storm in early August Since the beginning of August (notorious for poor RUB performance), the tide seems to be changing. The RUB has been negatively impacted by a new round of trade war escalation and its repercussions on the oil market. Limited Fed dovishness and the resulting strong dollar is a challenging condition for EM currencies. A fresh round of sanctions in early August has added more fuel to the fire.
Sanctions topic is back in the spotlight
Risks for the RUB are thus now tilted to the downside. Even though worst-case sanctions scenarios were avoided for the time being, the topic of sanctions is back in focus in the Russian FX market. There is some worry that the quite timid sanctions recently imposed by the US administration could provoke more discontent among US Congressmen, who may find these measures insufficient and push other sanctions initiatives forward more vigorously.
Rapid recovery is not on the cards
The sentiment has changed locally and globally, and the RUB is unlikely to return quickly to its strongest points in 2019 (62.5 versus USD and 70 versus EUR). For that to happen, the global risk sentiment would need to considerably improve either through a decreasing degree of protectionism globally or through a more dovish Fed rhetoric. In our view, a more likely scenario for the rest of this year is prolonged global uncertainty driving capital to safe heavens. We thus see the RUB at around 66 versus the USD by year-end. Sanctions risks may increase next year, as the US presidential elections approach. This will limit the RUB’s ability to recover.
Monetary easing to continue, Central Bank of Russia (CBR) used a relatively calm period of H1 2019 to resume its but at a slower pace easing cycle and delivered two key rate cuts (each of -25 bp). The current increased
volatility in the global markets may make the CBR more cautious in its further moves. The regulator may take a break in the cuts in the September meeting, but the easing cycle is expected to continue afterwards with at least -50 bp on the cards till the end of 2020.
RUB WAS OUTPERFORMING THE REST OF EM IN 2019 |
USD/RUB FORECASTS |
|
5

vk.com/id446425943
8 August 2019 |
Market Research |
|
|
Nordea forecasts for Russia
MACRO FORECASTS FOR RUSSIA
|
2016 |
2017 |
2018 |
2019E |
2020E |
Real GDP, % y/y |
0.3 |
1.6 |
2.3 |
1.3 |
1.5 |
Private consumption, % y/y |
-1.9 |
3.3 |
2.3 |
1.5 |
1.7 |
Fixed capital investment, % y/y |
1 |
5.2 |
2.9 |
2 |
3 |
|
|
|
|
|
|
Industrial production, % y/y |
2.2 |
2.1 |
2.9 |
2.5 |
2 |
Real wages growth, % y/y |
0.8 |
2.9 |
8.5 |
2 |
3 |
|
|
|
|
|
|
Inflation, % y/y |
5.4 |
2.5 |
4.3 |
4.2 |
4 |
Federal budget balance |
-3.4 |
-1.4 |
2.6 |
1.8 |
1 |
Source: Macrobond, Nordea estimates |
|
|
|
|
|
|
|
|
|
|
|
FINANCIAL FORECASTS FOR RUSSIA |
|
|
|
|
|
|
|
|
|
|
|
|
Spot |
3M |
End-2019 |
Mid-2020 |
End-2020 |
USD/RUB |
65.1 |
65.6 |
66 |
66.5 |
67 |
EUR/RUB |
72.8 |
71.5 |
71.3 |
74.5 |
78.4 |
Policy rate |
7.25 |
7 |
7 |
7 |
6.75 |
Source: Macrobond, Nordea estimates |
|
|
|
|
|
6

vk.com/id446425943
DISCLAIMER
Nordea Markets is the commercial name for Nordea’s international capital markets operation.
The information provided herein is intended for background information only and for the sole use of the intended recipient. The views and other information provided herein are the current views of Nordea Markets as of the date of this document and are subject to change without notice. This notice is not an exhaustive description of the described product or the risks related to it, and it should not be relied on as such, nor is it a substitute for the judgement of the recipient.
The information provided herein is not intended to constitute and does not constitute investment advice nor is the information intended as an offer or solicitation for the purchase or sale of any financial instrument. The information contained herein has no regard to the specific investment objectives, the financial situation or particular needs of any particular recipient. Relevant and specific professional advice should always be obtained before making any investment or credit decision. It is important to note that past performance is not indicative of future results.
Nordea Markets is not and does not purport to be an adviser as to legal, taxation, accounting or regulatory matters in any jurisdiction.
This document may not be reproduced, distributed or published for any purpose without the prior written consent from Nordea Markets.
Nordea Bank Abp, Satamaradankatu 5, FI-00020 NORDEA, Finland, domicile Helsinki, Business ID 2858394-9
Further information on Nordea available on www.nordea.com
Nordea Bank Abp, Satamaradankatu 5, FI-00020 NORDEA, Finland |
http://www.nordea.com |