

Oil_and_Gas_Weekly-031218__watermark
.pdfvk.com/id446425943
Oil & Gas
Weekly Monitor
Price performance
Russian oil & gas stocks were up 4% on average last week, outperforming the Brent oil price (+1%), the RTS Index (+2) and global oil & gas stocks (+3%), but underperforming EE refiners (+5%). The two best-performing stocks in our sector universe last week were PKN ORLEN (+10%) and Gazprom (+8%). The worst-performing stocks in the sector were Nostrum oil & gas (-24%) and Surgutneftgas prefs (-2%). On a YtD basis, the two best performers are NOVATEK (+73%) and Tatneft commons (+50%).
Gazprom’s dividend promise
Gazprom’s CFO Andrey Kruglov said last week that the company’s management will propose to unfreeze 2018 dividends which could grow to a “double-digit” figure. Previously, the company has guided for its dividend to remain flat at RUB8.04/share until 2020. The CFO’s comments are in line with our expectations and follow a significant increase in the company’s estimated 2018 earnings. A flat RUB8.04/share dividend (a yield of 4.9%) would represent a payout ratio of just 14%, as we expect
Gazprom’s profits to rise by 76% this year on higher gas sales. A hypothetical 25% dividend payout ratio would produce a double-digit dividend of RUB14/share, a yield of 8.7%. This would double to 17.4% if a 50% dividend payout ratio were used.
Chart of the week
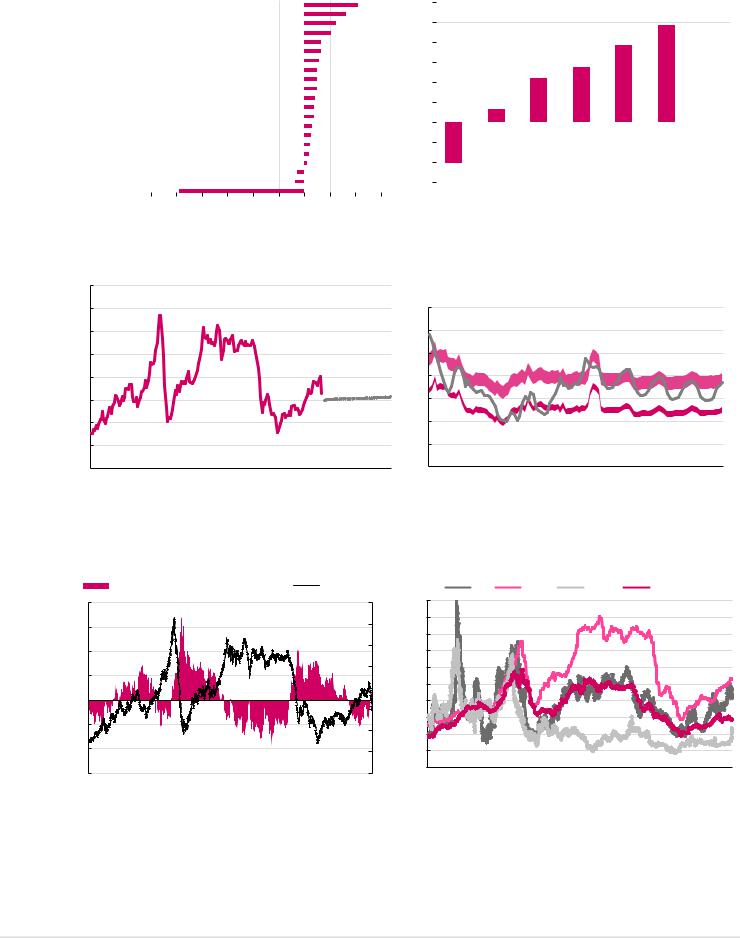
Last week, Interfax reported October 2018 drilling statistics in Russia. Russia’s total development drilling footage increased by 1% YtD to 23.4k km. This was led by Rosneft (+24%), Bashneft (+4%) and Surgutneftegas (+3%), with Rosneft alone accounting for 42% of Russia’s drilling volumes, led by Samotlorneftegas (+49%).
Surgutneftegas, with a 17% share in total drilling, has maintained its number-two position, with LUKOIL slipping back to number three with a share of 11%. Other major Russian oil producers saw their development drilling either flat or decline in 10M18, according to Interfax, as detailed in Figure 1.
Figure 1: Development drilling growth in 10M18, YoY |
|
|
|
|
||
10% |
|
|
|
|
|
|
|
0% |
3% |
4% |
4% |
1% |
|
|
|
|
|
|||
|
|
|
|
|
||
|
|
|
|
|
|
|
0% |
|
|
|
|
|
|
|
|
|
|
|
|
|
-10% |
|
|
|
|
|
|
|
|
|
|
|
|
|
-20% |
|
|
|
|
|
|
|
-18% |
|
|
|
|
|
|
|
|
|
|
|
|
-30% |
|
|
|
|
|
|
|
|
|
|
|
|
|
-40% |
|
|
|
|
|
|
|
|
|
|
|
|
|
-50% |
|
|
|
|
|
|
|
-54% |
|
|
|
|
|
-60% |
|
|
|
|
|
|
|
|
|
|
|
||
|
|
Tatneft Gazprom Neft LUKOIL Surgutneftegas |
Bashneft |
Rosneft |
Total Russia |
|
Source: Interfax
Sector update
Equity Research 3 December 2018
Oil & Gas
Russia
Alexander Burgansky +44 (207) 005-7982 ABurgansky@rencap.com
Oleg Chistyukhin
+7 (495) 258-7770 x4073 OChistyukhin@rencap.com
Richard Wisentaner
+44 (207) 005-7594 x8954 RWisentaner@rencap.com
Gazprom (BUY) |
|
GAZP RX |
TP/Current price, RUB |
|
220.0/165.0 |
Upside potential, % |
|
33.3 |
|
|
|
LUKOIL (BUY) |
|
LKOH RX |
TP/Current price, RUB |
|
5,600.0/4,766.0 |
Upside potential, % |
|
17.5 |
|
|
|
NOVATEK (HOLD) |
|
NVTK RX |
TP/Current price, RUB |
|
1070.0/1167.8 |
Upside potential, % |
|
(8.4) |
|
|
|
Rosneft (BUY) |
|
ROSN RX |
TP/Current price, RUB |
|
550.0/417.0 |
Upside potential, % |
|
31.9 |
|
|
|
Gazprom Neft (HOLD) |
|
SIBN RX |
TP/Current price, RUB |
|
360.0/359.1 |
Upside potential, % |
|
0.3 |
|
|
|
SurgutNG (HOLD / BUY) |
SNGS RX |
SNGSP RX |
TP/Current price, RUB |
110.0/27.2 |
110.0/37.1 |
Upside potential, % |
304.3 |
196.1 |
|
|
|
Tatneft (HOLD / BUY) |
TATN RX |
TATNP RX |
TP/Current price, RUB |
740.0/714.0 |
740.0/512.8 |
Upside potential, % |
3.6 |
44.3 |
|
|
|
Transneft (BUY) |
|
TRNFP RX |
TP/Current price, RUB |
215,000.0/171,350.0 |
|
Upside potential, % |
|
25.5 |
|
|
|
PKN ORLEN (HOLD) |
|
PKN PW |
TP/Current price, PLN |
|
98.0/112.9 |
Upside potential, % |
|
(13.2) |
|
|
|
MOL Group (BUY) |
|
MOL HB |
TP/Current price, HUF |
|
4,200.0/3,178. |
Upside potential, % |
|
32.2 |
|
|
|
Tupras (BUY) |
|
TUPRS TI |
TP/Current price, TRY |
|
176.0/125.8 |
Upside potential, % |
|
39.9 |
|
|
|
OMV Petrom (BUY) |
|
SNP RE |
TP/Current price, RON |
|
0.46/0.37 |
Upside potential, % |
|
25.3 |
|
|
|
Grupa LOTOS (BUY) |
|
LTS PW |
TP/Current price, PLN |
|
92.0/81.2 |
Upside potential, % |
|
13.2 |
|
|
|
Petkim (HOLD) |
|
PETKM TI |
TP/Current price, TRY |
|
8.0/5.3 |
Upside potential, % |
|
49.8 |
Prices in this report as of close 29 November 2018
Source: Bloomberg, Renaissance Capital estimates
Important disclosures are found at the Disclosures Appendix. Communicated by Renaissance Securities (Cyprus) Limited, regulated by the Cyprus Securities & Exchange Commission, which together with non-US affiliates operates outside of the USA under the brand name of Renaissance Capital.
vk.com/id446425943
|
|
|
|
|
|
|
|
|
|
|
|
|
|
Renaissance Capital |
|||
|
|
|
|
|
|
|
|
|
|
|
|
|
|
3 December 2018 |
|||
|
|
|
|
|
|
|
|
|
|
|
|
|
|
Oil & Gas |
|||
|
|
|
|
|
|
|
|
|
|
|
|
|
|
|
|
||
Figure 2: Price performance, last week, % |
|
|
|
|
Figure 3: Russian oil production (in b/d terms) growth in October 2018, YoY |
||||||||||||
PKN ORLEN |
|
|
|
|
|
|
|
|
10.5% |
|
6% |
|
|
|
|
|
|
|
|
|
|
|
|
|
|
|
|
4.9% |
|
|
|
||||
|
|
|
|
|
|
|
|
|
|
|
|
|
|
||||
Gazprom |
|
|
|
|
|
|
|
|
8.2% |
|
5% |
|
|
|
|
||
Grupa LOTOS |
|
|
|
|
|
|
|
6.2% |
|
|
|
4.4% |
|
||||
NOVATEK |
|
|
|
|
|
|
|
5.2% |
|
|
4% |
|
3.9% |
|
|
|
|
Rosneft |
|
|
|
|
|
|
|
3.4% |
|
|
|
|
|
|
|
|
|
LUKOIL |
|
|
|
|
|
|
|
3.3% |
|
|
|
|
2.8% |
|
|
|
|
Gazprom Neft |
|
|
|
|
|
|
|
2.8% |
|
|
3% |
|
|
|
|
||
|
|
|
|
|
|
|
|
|
|
2.2% |
|
|
|
||||
Transneft |
|
|
|
|
|
|
2.6% |
|
|
|
|
|
|
|
|||
|
|
|
|
|
|
|
|
|
|
|
|
|
|
|
|||
Petkim |
|
|
|
|
|
|
2.5% |
|
|
2% |
|
|
|
|
|
|
|
|
|
|
|
|
|
|
|
|
|
|
|
|
|
||||
Tupras |
|
|
|
|
|
|
2.5% |
|
|
|
|
|
|
|
|
||
|
|
|
|
|
|
|
|
|
0.7% |
|
|
|
|
|
|||
Exillon Energy |
|
|
|
|
|
|
2.2% |
|
|
1% |
|
|
|
|
|
||
Bashneft prefs |
|
|
|
|
|
|
2.0% |
|
|
|
|
|
|
|
|
||
|
|
|
|
|
|
|
|
|
|
|
|
|
|
|
|||
OMV Petrom |
|
|
|
|
|
|
1.9% |
|
|
0% |
|
|
|
|
|
|
|
Tatneft prefs |
|
|
|
|
|
|
1.5% |
|
|
|
|
|
|
|
|
||
|
|
|
|
|
|
|
|
|
|
|
|
|
|
|
|||
Bashneft |
|
|
|
|
|
|
1.3% |
|
|
-1% |
|
|
|
|
|
|
|
Russneft |
|
|
|
|
|
|
1.1% |
|
|
|
|
|
|
|
|
||
|
|
|
|
|
|
|
|
|
|
|
|
|
|
||||
MOL |
|
|
|
|
|
|
1.0% |
|
|
-2% |
|
|
|
|
|
|
|
Surgutneftegas |
|
|
|
|
|
|
0.6% |
|
|
|
|
|
|
|
|
||
|
|
|
|
|
|
|
|
|
|
|
|
|
|
||||
Tatneft |
|
|
|
|
|
-1.4% |
|
|
|
|
|
-2.1% |
|
|
|
|
|
Surgutneftegas prefs |
|
|
|
|
|
-1.8% |
|
|
|
|
-3% |
|
|
|
|
|
|
|
|
|
|
|
|
|
|
|
|
|
|
|
|
|
|||
Nostrum Oil & Gas |
-24.4% |
|
|
|
|
|
|
|
|
|
|
Bashneft Surgut |
LUKOIL Gazprom Tatneft Rosneft Russia |
||||
|
|
|
|
|
|
|
|
|
|
|
|
||||||
-30% -25% -20% -15% -10% |
-5% 0% 5% 10% 15% |
|
|
|
Neft |
||||||||||||
|
|
|
|
|
|
|
|
Source: Bloomberg |
|
|
|
Source: CDU TEK, Interfax, Renaissance Capital |
|||||
Figure 4: Brent strip, $/bl |
|
|
|
|
Figure 5: Full costs* of US LNG vs European hub prices ($/mmbtu) |
||||||||||||
160 |
|
|
|
|
|
|
|
|
|
|
|
|
|
|
|
|
|
|
|
140 |
|
|
|
|
|
|
|
|
|
|
|
|
|
|
|
|
|
|
14 |
120 |
|
|
|
|
|
|
|
|
|
|
|
|
|
|
|
|
|
|
12 |
100 |
|
|
|
|
|
|
|
|
|
|
|
|
|
|
|
|
|
|
10 |
80 |
|
|
|
|
|
|
|
|
|
|
|
|
|
|
|
|
|
|
8 |
60 |
|
|
|
|
|
|
|
|
|
|
|
|
|
|
|
|
|
|
6 |
40 |
|
|
|
|
|
|
|
|
|
|
|
|
|
|
|
|
|
|
4 |
20 |
|
|
|
|
|
|
|
|
|
|
|
|
|
|
|
|
|
|
2 |
0 |
|
|
|
|
|
|
|
|
|
|
|
|
|
|
|
|
|
|
0 |
2004 |
2005 |
2006 |
2007 |
2008 |
2009 |
2010 |
2011 |
2012 |
2013 |
2014 |
2015 |
2016 |
2017 |
2018 |
2019 |
2020 |
2021 |
2022 |
2023 |
|
Short-term breakeven range |
|
Long-term breakeven range |
|
|
||
|
|
||
|
NBP |
|
|
|
|
|
2014 |
2015 |
2016 |
2017 |
2018 |
2019 |
2020 |
2021 |
2022 |
|
|
*Based on typical contract price formula, incl. 115% of HH, $2.4 - 3.0/mmbtu tolling, shipping ($1.0) |
|
Source: Bloomberg |
and regasification costs ($1.0). |
|
Source: Bloomberg, Renaissance Capital estimates |
|
|
|
|
Figure 6: Contango or backwardation, $/bl |
|
Figure 7: European gas prices – Gazprom vs spot, $/mmbtu |
|
One-year contango/(backwardation) (LHS) |
|
Brent (RHS) |
$/Mmbtu |
|
NBP |
|
LNG Asia |
|
|
Henry Hub |
|
Germany BAFA import price |
||||||||||
20 |
|
|
|
|
|
|
160 |
20 |
|
|
|
|
|
|
|
|
|
|
|
|
|
|
|
15 |
|
|
|
|
|
|
140 |
18 |
|
|
|
|
|
|
|
|
|
|
|
|
|
|
|
|
|
|
|
|
|
|
|
|
|
|
|
|
|
|
|
|
|
|
|
|
|||
|
|
|
|
|
|
|
16 |
|
|
|
|
|
|
|
|
|
|
|
|
|
|
||
|
|
|
|
|
|
|
|
|
|
|
|
|
|
|
|
|
|
|
|
|
|
||
10 |
|
|
|
|
|
|
120 |
14 |
|
|
|
|
|
|
|
|
|
|
|
|
|
|
|
|
|
|
|
|
|
|
|
|
|
|
|
|
|
|
|
|
|
|
|
|
|||
5 |
|
|
|
|
|
|
100 |
12 |
|
|
|
|
|
|
|
|
|
|
|
|
|
|
|
|
|
|
|
|
|
|
10 |
|
|
|
|
|
|
|
|
|
|
|
|
|
|
||
|
|
|
|
|
|
|
80 |
|
|
|
|
|
|
|
|
|
|
|
|
|
|
||
|
|
|
|
|
|
|
|
|
|
|
|
|
|
|
|
|
|
|
|
|
|
||
0 |
|
|
|
|
|
|
60 |
8 |
|
|
|
|
|
|
|
|
|
|
|
|
|
|
|
|
|
|
|
|
|
|
6 |
|
|
|
|
|
|
|
|
|
|
|
|
|
|
||
-5 |
|
|
|
|
|
|
|
|
|
|
|
|
|
|
|
|
|
|
|
|
|
||
|
|
|
|
|
|
40 |
4 |
|
|
|
|
|
|
|
|
|
|
|
|
|
|
||
|
|
|
|
|
|
|
|
|
|
|
|
|
|
|
|
|
|
|
|
|
|||
|
|
|
|
|
|
|
|
|
|
|
|
|
|
|
|
|
|
|
|
|
|
||
-10 |
|
|
|
|
|
|
20 |
2 |
|
|
|
|
|
|
|
|
|
|
|
|
|
|
|
-15 |
|
|
|
|
|
|
0 |
0 |
|
|
|
|
|
|
|
|
|
|
|
|
|
|
|
|
|
|
|
|
|
2004 |
2005 |
2006 |
2007 |
2008 |
2009 |
2010 |
2011 |
2012 |
2013 |
2014 |
2015 |
2016 |
2017 |
2018 |
|||
04 |
06 |
08 |
10 |
12 |
14 |
16 |
18 |
||||||||||||||||
|
|
|
|
|
|
|
|
|
|
|
|
|
|
|
|||||||||
|
|
|
|
|
|
|
Source: Bloomberg |
|
|
|
|
|
|
|
|
Source: Bloomberg, Gazprom, Renaissance Capital |
|||||||
2
vk.com/id446425943
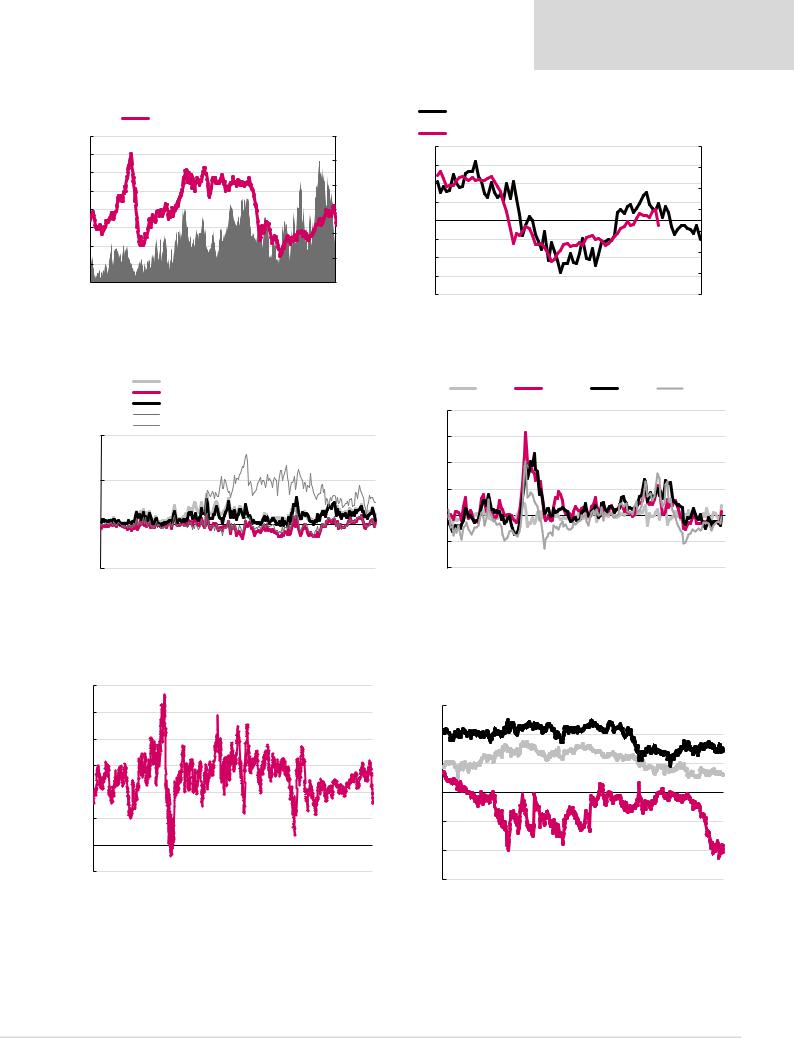
Figure 8: Oil futures open interest vs Brent price
 Managed Money, no. of long positions (RHS)
Brent spot price, $/bl (LHS)
160 |
|
|
|
|
|
|
|
|
|
|
|
600,000 |
140 |
|
|
|
|
|
|
|
|
|
|
|
500,000 |
|
|
|
|
|
|
|
|
|
|
|
|
|
120 |
|
|
|
|
|
|
|
|
|
|
|
|
100 |
|
|
|
|
|
|
|
|
|
|
|
400,000 |
|
|
|
|
|
|
|
|
|
|
|
|
|
80 |
|
|
|
|
|
|
|
|
|
|
|
300,000 |
60 |
|
|
|
|
|
|
|
|
|
|
|
200,000 |
|
|
|
|
|
|
|
|
|
|
|
|
|
40 |
|
|
|
|
|
|
|
|
|
|
|
|
20 |
|
|
|
|
|
|
|
|
|
|
|
100,000 |
|
|
|
|
|
|
|
|
|
|
|
|
|
- |
|
|
|
|
|
|
|
|
|
|
|
- |
2006 |
2007 |
2008 |
2009 |
2010 |
2011 |
2012 |
2013 |
2014 |
2015 |
2016 |
2017 |
2018 |
Source: Bloomberg
Figure 10: Refining margin Russia vs Europe, $/bl
Urals (cracking)
Urals (hydroskimming) Brent (cracking)
Brent (hydroskimming)
Average gross refining margin in Russia
40.0
20.0
-
(20.0)
1997 |
1998 |
1999 |
2000 |
2001 |
2002 |
2003 |
2004 |
2005 |
2006 |
2007 |
2008 |
2009 |
2010 |
2011 |
2012 |
2013 |
2014 |
2015 |
2016 |
2017 |
2018 |
Source: EIA, Bloomberg, Argus, InfoTEK, Renaissance Capital
Figure 12: Gross margin contribution for Russian crude exporters, $/bl |
|||||||||||||
(Urals oil price less export duty less MET) |
|
|
|
|
|
|
|||||||
60 |
|
|
|
|
|
|
|
|
|
|
|
|
|
50 |
|
|
|
|
|
|
|
|
|
|
|
|
|
40 |
|
|
|
|
|
|
|
|
|
|
|
|
|
30 |
|
|
|
|
|
|
|
|
|
|
|
|
|
20 |
|
|
|
|
|
|
|
|
|
|
|
|
|
10 |
|
|
|
|
|
|
|
|
|
|
|
|
|
- |
|
|
|
|
|
|
` |
|
|
|
|
|
|
(10) |
|
|
|
|
|
|
|
|
|
|
|
|
|
2004 |
2005 |
2006 |
2007 |
2008 |
2009 |
2010 |
2011 |
2012 |
2013 |
2014 |
2015 |
2016 |
2017 |
Source: Bloomberg, Interfax, Renaissance Capital
Renaissance Capital
3 December 2018
Oil & Gas
Figure 9: OECD commercial inventories and Brent oil price (rhs)
OECD inventories (days of supply) in excess of 5-yr average, mn bls (lhs,
inverted)
Brent oil price, $/bl (rhs)
(8) |
|
140 |
(6) |
|
120 |
|
|
|
(4) |
|
100 |
|
|
|
(2) |
|
80 |
|
|
|
- |
|
|
2 |
|
60 |
|
|
|
4 |
|
40 |
|
|
|
6 |
|
20 |
|
|
|
8 |
|
- |
Jan-13 Nov-13 Sep-14 |
Jul-15 |
May-16 Mar-17 Jan-18 Nov-18 Sep-19 |
Source: EIA, Bloomberg
Figure 11: Russian domestic price premium vs export netbacks
|
|
Crude |
|
Gasoline |
|
|
Diesel |
|
Fuel oil |
|
||||
200% |
|
|
|
|
|
|
|
|
|
|
|
|
|
|
150% |
|
|
|
|
|
|
|
|
|
|
|
|
|
|
100% |
|
|
|
|
|
|
|
|
|
|
|
|
|
|
50% |
|
|
|
|
|
|
|
|
|
|
|
|
|
|
0% |
|
|
|
|
|
|
|
|
|
|
|
|
|
|
-50% |
|
|
|
|
|
|
|
|
|
|
|
|
|
|
-100% |
|
|
|
|
|
|
|
|
|
|
|
|
|
|
2005 |
2006 |
2007 |
2008 |
2009 |
2010 |
2011 |
2012 |
2013 |
2014 |
2015 |
2016 |
2017 |
2018 |
2019 |
Source: Bloomberg, Argus, InfoTEK, Renaissance Capital
Figure 13: Preferred share price discount to commons
60% |
|
|
Sberbank |
|
Surgutneftegas |
|
Tatneft |
|
|
|
|
||||
|
|
|
|
|
|
|
|
|
|
|
|
|
|
|
40%
20%
0%
-20%
-40%
-60% |
|
|
|
|
2013 |
2014 |
2015 |
2016 |
2017 |
Source: Bloomberg
3

vk.com/id446425943
Renaissance Capital
3 December 2018
Oil & Gas
Figure 14: MOL model refining margin 7-day average, $/bl |
Figure 15: Grupa LOTOS model refining margin 7-day average, $/bl |
|
|
|
|
|
5Y range |
|
Margin |
|
|
|
|
14 |
|
|
|
|
|
|
|
|
|
|
14 |
12 |
|
|
|
|
|
|
|
|
|
|
12 |
10 |
|
|
|
|
|
|
|
|
|
|
10 |
8 |
|
|
|
|
|
|
|
|
|
|
8 |
6 |
|
|
|
|
|
|
|
|
|
|
6 |
4 |
|
|
|
|
|
|
|
|
|
|
4 |
2 |
|
|
|
|
|
|
|
|
|
|
2 |
0 |
February |
March |
|
May |
|
July |
|
|
|
|
0 |
January |
April |
June |
August |
September |
October |
November |
December |
||||
|
|
|
|
|
5Y range |
|
Margin |
|
|
|
|
January |
February |
March |
April |
May |
June |
July |
August |
September |
October |
November |
December |
Source: Bloomberg, Thomson Reuters Datastream Source: Bloomberg, Thomson Reuters Datastream
Figure 16: PKN ORLEN model refining margin 7-day average, $/bl Figure 17: Tupras model refining margin 7-day average, $/bl
16 |
|
|
|
|
5Y range |
|
Margin |
|
|
|
|
||
|
|
|
|
|
|
|
|
|
|
|
16 |
||
14 |
|
|
|
|
|
|
|
|
|
|
|
||
|
|
|
|
|
|
|
|
|
|
|
14 |
||
12 |
|
|
|
|
|
|
|
|
|
|
|
||
|
|
|
|
|
|
|
|
|
|
|
|
||
10 |
|
|
|
|
|
|
|
|
|
|
|
12 |
|
|
|
|
|
|
|
|
|
|
|
|
|
||
8 |
|
|
|
|
|
|
|
|
|
|
|
10 |
|
6 |
|
|
|
|
|
|
|
|
|
|
|
8 |
|
4 |
|
|
|
|
|
|
|
|
|
|
|
||
|
|
|
|
|
|
|
|
|
|
|
6 |
||
2 |
|
|
|
|
|
|
|
|
|
|
|
||
|
|
|
|
|
|
|
|
|
|
|
|
||
0 |
|
|
|
|
|
|
|
|
|
|
|
4 |
|
|
|
|
|
|
|
|
|
|
|
|
|
||
-2 |
|
|
|
|
|
|
|
|
|
|
|
2 |
|
-4 |
February |
March |
April |
May |
June |
July |
August |
|
|
November |
December |
0 |
|
January |
September |
October |
|||||||||||
|
|||||||||||||
|
|
|
|
|
5Y range |
|
Margin |
|
|
|
|
January |
February |
March |
April |
May |
June |
July |
August |
September |
October |
November |
December |
Source: Bloomberg, Thomson Reuters Datastream Source: Bloomberg, Thomson Reuters Datastream
Figure 18: OMV Petrom model refining margin 7-day average, $/bl Figure 19: North-Western Europe LDPE-Naphtha spread, $/t
|
|
|
|
|
5Y range |
|
Margin |
|
|
|
|
|
|
|
|
|
|
|
16 |
|
|
|
|
|
|
|
|
|
|
|
1,600 |
|
|
|
|
|
|
14 |
|
|
|
|
|
|
|
|
|
|
|
1,400 |
|
|
|
|
|
|
|
|
|
|
|
|
|
|
|
|
|
|
|
|
|
|
|
|
|
12 |
|
|
|
|
|
|
|
|
|
|
|
1,200 |
|
|
|
|
|
|
|
|
|
|
|
|
|
|
|
|
|
|
|
|
|
|
|
|
|
10 |
|
|
|
|
|
|
|
|
|
|
|
|
|
|
|
|
|
|
8 |
|
|
|
|
|
|
|
|
|
|
|
1,000 |
|
|
|
|
|
|
|
|
|
|
|
|
|
|
|
|
|
|
|
|
|
|
|
|
|
6 |
|
|
|
|
|
|
|
|
|
|
|
800 |
|
|
|
|
|
|
|
|
|
|
|
|
|
|
|
|
|
|
|
|
|
|
|
|
|
4 |
|
|
|
|
|
|
|
|
|
|
|
600 |
|
|
|
|
|
|
2 |
|
|
|
|
|
|
|
|
|
|
|
400 |
|
|
|
|
|
|
|
|
|
|
|
|
|
|
|
|
|
|
|
|
|
|
|
|
|
0 |
February |
March |
April |
May |
June |
July |
|
|
|
November |
December |
200 |
|
|
|
|
|
|
January |
August |
September |
October |
|
|
|
|
|
|
|||||||||
- |
|
|
|
|
|
|
||||||||||||
Nov-10 Nov-11 |
Nov-12 |
Nov-13 |
Nov-14 |
Nov-15 |
Nov-16 |
Nov-17 |
||||||||||||
Source: Bloomberg, Thomson Reuters Datastream |
Source: Thomson Reuters Datastream |
4

vk.com/id446425943
Renaissance Capital
3 December 2018
Oil & Gas
Figure 20: Summary valuation for oil and gas companies we cover
Company name |
Ticker |
Currency |
Rating |
TP |
Current price |
Potential upside / |
MktCap, |
EV, |
|
P/E, x |
|
EV/EBITDA, x |
Div yield, % |
EV/reserves EV/production |
||||
|
29-Nov-18 |
downside |
$mn |
$mn |
2018E |
2019E |
2020E |
2018E |
2019E |
2020E |
2018E |
2019E |
$/boe, 2017 |
$/boe, 2017 |
||||
|
|
|
|
|
||||||||||||||
|
|
|
|
|
|
|
|
|
|
|
|
|
|
|
|
|
|
|
Russian Oil and Gas |
|
|
|
|
|
|
|
|
|
|
|
|
|
|
|
|
|
|
Gazprom (RenCap estimates) |
GAZP RX |
RUB |
BUY |
220.0 |
165.0 |
33% |
59,021 |
92,297 |
2.9 |
3.2 |
3.2 |
2.6 |
2.9 |
2.8 |
4.9 |
4.9 |
0.7 |
25.3 |
Gazprom (consensus estimates) |
GAZP RX |
|
|
|
|
|
|
|
3.0 |
2.9 |
2.9 |
2.6 |
2.5 |
2.5 |
5.9 |
7.6 |
|
|
NOVATEK (RenCap estimates) |
NVTK RM |
RUB |
HOLD |
1,070.0 |
1,167.8 |
-8% |
53,580 |
54,638 |
19.8 |
15.0 |
13.5 |
14.6 |
15.1 |
14.2 |
1.3 |
1.4 |
3.7 |
108.4 |
NOVATEK (consensus estimates) |
NVTK RM |
|
|
|
|
|
|
|
15.3 |
11.7 |
11.0 |
12.6 |
13.0 |
12.0 |
1.7 |
2.1 |
|
|
Rosneft (RenCap estimates) |
ROSN RX |
RUB |
BUY |
550.0 |
417.0 |
32% |
66,781 |
128,889 |
6.5 |
5.7 |
4.8 |
4.4 |
4.3 |
4.1 |
7.7 |
8.8 |
3.1 |
59.4 |
Rosneft (consensus estimates) |
ROSN RX |
|
|
|
|
|
|
|
6.6 |
5.4 |
4.8 |
4.1 |
3.9 |
3.7 |
6.8 |
8.9 |
|
|
LUKOIL (RenCap estimates) |
LKOH RX |
RUB |
BUY |
5,600.0 |
4,766.0 |
17% |
54,014 |
54,003 |
5.3 |
7.0 |
8.5 |
3.0 |
3.4 |
3.8 |
5.1 |
5.7 |
3.5 |
68.6 |
LUKOIL (consensus estimates) |
LKOH RX |
|
|
|
|
|
|
|
5.6 |
5.4 |
5.4 |
3.1 |
3.0 |
2.9 |
5.1 |
5.5 |
|
|
Surgutneftegas (RenCap estimates) |
SNGS RX |
RUB |
HOLD |
110.0 |
27.2 |
304% |
19,012 |
(14,256) |
1.8 |
2.7 |
3.0 |
n/a |
n/a |
n/a |
2.4 |
2.4 |
0.3 |
n/a |
Surgutneftegas prefs (RenCap estimates) |
SNGSP RX |
RUB |
BUY |
110.0 |
37.1 |
196% |
4,323 |
|
|
|
- |
- |
- |
- |
17.2 |
11.6 |
|
|
Surgutneftegas (consensus estimates) |
SNGS RX |
|
|
|
|
|
|
|
3.0 |
3.5 |
3.5 |
n/a |
n/a |
n/a |
2.7 |
2.4 |
|
|
Gazprom Neft (RenCap estimates) |
SIBN RX |
RUB |
HOLD |
360.0 |
359.1 |
0% |
25,728 |
33,617 |
4.3 |
5.5 |
6.4 |
3.6 |
4.2 |
4.5 |
8.1 |
7.4 |
3.2 |
54.9 |
Gazprom Neft (consensus estimates) |
SIBN RX |
|
|
|
|
|
|
|
4.5 |
4.3 |
4.5 |
3.6 |
3.6 |
3.6 |
6.5 |
8.0 |
|
|
Tatneft (RenCap estimates) |
TATN RM |
RUB |
HOLD |
740.0 |
714.0 |
4% |
24,649 |
25,896 |
7.2 |
8.3 |
9.0 |
5.3 |
5.9 |
6.2 |
9.6 |
5.9 |
4.1 |
123.3 |
Tatneft prefs (RenCap estimates) |
TATNP RX |
RUB |
BUY |
740.0 |
512.8 |
44% |
1,143 |
|
|
|
- |
- |
- |
|
13.4 |
8.3 |
|
|
Tatneft (consensus estimates) |
TATN RM |
|
|
|
|
|
|
|
8.1 |
7.4 |
7.0 |
5.6 |
5.6 |
5.2 |
8.1 |
7.6 |
|
|
Weighted average |
|
|
|
|
|
|
|
|
7.4 |
7.0 |
6.9 |
5.2 |
5.5 |
5.4 |
5.6 |
5.5 |
2.7 |
63.0 |
EM refiners |
|
|
|
|
|
|
|
|
|
|
|
|
|
|
|
|
|
|
Tupras (RenCap estimates) |
TUPRS TI |
TRY |
BUY |
176.0 |
125.8 |
40% |
6,085 |
7,814 |
7.4 |
4.8 |
4.6 |
5.9 |
4.3 |
4.2 |
10.8 |
16.7 |
n/a |
37.9 |
Tupras (consensus estimates) |
TUPRS TI |
|
|
|
|
|
|
|
9.5 |
6.8 |
5.4 |
5.8 |
5.3 |
4.7 |
11.9 |
16.3 |
|
|
MOL (RenCap estimates) |
MOL HB |
HUF |
BUY |
4,200.0 |
3,178.0 |
32% |
7,835 |
10,153 |
8.3 |
9.0 |
9.4 |
4.0 |
4.1 |
4.2 |
2.9 |
3.2 |
n/a |
66.3 |
MOL (consensus estimates) |
MOL HB |
|
|
|
|
|
|
|
8.2 |
7.5 |
7.0 |
4.1 |
4.0 |
3.9 |
3.7 |
3.6 |
|
|
PKN ORLEN (RenCap estimates) |
PKN PW |
PLN |
HOLD |
98.0 |
112.9 |
-13% |
12,802 |
14,179 |
8.3 |
9.3 |
9.2 |
5.9 |
5.8 |
5.8 |
2.8 |
2.9 |
n/a |
55.0 |
PKN ORLEN (consensus estimates) |
PKN PW |
|
|
|
|
|
|
|
9.8 |
10.2 |
9.8 |
5.9 |
6.1 |
5.8 |
2.9 |
3.0 |
|
|
Grupa LOTOS (RenCap estimates) |
LTS PW |
PLN |
BUY |
92.0 |
81.2 |
13% |
3,984 |
4,978 |
10.8 |
7.5 |
6.4 |
7.2 |
5.2 |
4.6 |
1.4 |
1.4 |
n/a |
64.7 |
Grupa LOTOS (consensus estimates) |
LTS PW |
|
|
|
|
|
|
|
9.8 |
10.1 |
8.2 |
6.0 |
6.0 |
5.1 |
2.2 |
2.6 |
|
|
OMV Petrom (RenCap estimates) |
SNP RE |
RON |
BUY |
0.46 |
0.37 |
25% |
5,060 |
3,889 |
6.6 |
7.1 |
8.0 |
2.2 |
2.2 |
2.4 |
5.7 |
6.0 |
n/a |
117.9 |
OMV Petrom (consensus estimates) |
SNP RE |
|
|
|
|
|
|
|
6.4 |
5.8 |
6.0 |
2.1 |
2.1 |
2.1 |
7.8 |
7.8 |
|
|
Petkim (RenCap estimates) |
PETKM TI |
TRY |
HOLD |
8.0 |
5.3 |
50% |
1,702 |
2,334 |
9.0 |
3.6 |
3.2 |
10.0 |
6.7 |
4.8 |
0.0 |
13.8 |
n/a |
n/a |
Petkim (consensus estimates) |
PETKM TI |
|
|
|
|
|
|
|
8.8 |
7.6 |
6.3 |
8.1 |
6.9 |
7.1 |
7.9 |
9.1 |
|
|
Weighted average |
|
|
|
|
|
|
|
|
8.2 |
7.8 |
7.8 |
5.3 |
4.7 |
4.6 |
4.2 |
6.0 |
|
61.6 |
Source: Company data, Bloomberg, Renaissance Capital estimates
5

vk.com/id446425943
Renaissance Capital
3 December 2018
Oil & Gas
Figure 21: Comparable multiples analysis for oil companies
Company name |
Ticker |
Currency Rating |
TP |
Current price |
Potential upside / |
MktCap, |
EV, |
|
P/E, x |
|
EV/EBITDA, x |
|
Div yield, % |
EV/reserves |
EV/production |
||||
29-Nov-18 |
downside |
$mn |
$mn |
2018E |
2019E |
2020E |
2018E |
2019E |
2020E |
2018E |
2019E |
$/boe, 2017 |
$/boe, 2017 |
||||||
|
|
|
|
|
|||||||||||||||
Russian Oil and Gas majors |
|
|
|
|
|
|
|
|
|
|
|
|
|
|
|
|
|
|
|
Rosneft (RenCap estimates) |
ROSN RX |
RUB |
BUY |
550.0 |
417.0 |
32% |
66,781 |
128,889 |
6.5 |
5.7 |
4.8 |
4.4 |
4.3 |
4.1 |
7.7 |
8.8 |
3.1 |
59.4 |
|
Rosneft (consensus estimates) |
ROSN RX |
|
|
|
|
|
|
|
6.6 |
5.4 |
4.8 |
4.1 |
3.9 |
3.7 |
6.8 |
8.9 |
|
|
|
LUKOIL (RenCap estimates) |
LKOH RX |
RUB |
BUY |
5,600 |
4,766 |
17% |
54,014 |
54,003 |
5.3 |
7.0 |
8.5 |
3.0 |
3.4 |
3.8 |
5.1 |
5.7 |
3.5 |
68.6 |
|
LUKOIL (consensus estimates) |
LKOH RX |
|
|
|
|
|
|
|
5.6 |
5.4 |
5.4 |
3.1 |
3.0 |
2.9 |
5.1 |
5.5 |
|
|
|
Surgutneftegas (RenCap estimates) |
SNGS RX |
RUB |
HOLD |
110.0 |
27.2 |
304% |
19,012 |
(14,256) |
1.8 |
2.7 |
3.0 |
n/a |
n/a |
n/a |
2.4 |
2.4 |
0.3 |
n/a |
|
Surgutneftegas prefs (RenCap estimates) |
SNGSP RX |
RUB |
BUY |
110.0 |
37.1 |
196% |
4,323 |
|
|
|
|
|
|
|
17.2 |
11.6 |
|
|
|
Surgutneftegas (consensus estimates) |
SNGS RX |
|
|
|
|
|
|
|
3.0 |
3.5 |
3.5 |
n/a |
n/a |
n/a |
2.7 |
2.4 |
|
|
|
Gazprom Neft (RenCap estimates) |
SIBN RX |
RUB |
HOLD |
360.0 |
359.1 |
0% |
25,728 |
33,617 |
4.3 |
5.5 |
6.4 |
3.6 |
4.2 |
4.5 |
8.1 |
7.4 |
3.2 |
54.9 |
|
Gazprom Neft (consensus estimates) |
SIBN RX |
|
|
|
|
|
|
|
4.5 |
4.3 |
4.5 |
3.6 |
3.6 |
3.6 |
6.5 |
8.0 |
|
|
|
Tatneft (RenCap estimates) |
TATN RM |
RUB |
HOLD |
740.0 |
714.0 |
4% |
24,649 |
25,896 |
7.2 |
8.3 |
9.0 |
5.3 |
5.9 |
6.2 |
9.6 |
5.9 |
4.1 |
123.3 |
|
Tatneft prefs (RenCap estimates) |
TATNP RX |
RUB |
BUY |
740.0 |
512.8 |
44% |
1,143 |
|
|
|
|
|
|
|
13.4 |
8.3 |
|
|
|
Tatneft (consensus estimates) |
TATN RM |
|
|
|
|
|
|
|
8.1 |
7.4 |
7.0 |
5.6 |
5.6 |
5.2 |
8.1 |
7.6 |
|
|
|
Weighted average |
|
|
|
|
|
|
|
|
5.5 |
6.1 |
6.4 |
4.0 |
4.2 |
4.4 |
7.0 |
6.8 |
3.0 |
62.0 |
|
Other FSU oil companies |
|
|
|
|
|
|
|
|
|
|
|
|
|
|
|
|
|
|
|
Nostrum (RenCap estimates) |
NOG LI |
GBp |
HOLD 136.0 |
134.6 |
1% |
324 |
1,322 |
10.3 |
17.0 |
128.4 |
5.1 |
6.2 |
6.5 |
0.0 |
0.0 |
2.7 |
92.4 |
||
Nostrum (consensus estimates) |
NOG LN |
|
|
|
134.6 |
|
|
|
11.0 |
6.8 |
4.8 |
5.2 |
5.1 |
4.5 |
0.0 |
0.3 |
|
|
|
Russneft (consensus estimates) |
RNFT RX |
|
|
|
527.6 |
|
2,337 |
3,634 |
7 |
5 |
4.5 |
5.5 |
4.1 |
4.1 |
n/a |
n/a |
n/a |
n/a |
|
Exillon Energy (consensus estimates) |
EXI LN |
|
|
|
71.1 |
|
147 |
271 |
n/a |
n/a |
n/a |
n/a |
n/a |
n/a |
n/a |
n/a |
1.5 |
54.4 |
|
Weighted average |
|
|
|
|
|
|
|
|
7.2 |
5.7 |
18.6 |
5.1 |
4.1 |
4.1 |
0.0 |
0.0 |
0.4 |
13.5 |
|
Other GEM oil companies |
|
|
|
|
|
|
|
|
|
|
|
|
|
|
|
|
|
|
|
Petrobras |
PETR3 BZ |
BRL |
|
|
27.7 |
|
90,417 |
164,380 |
9.5 |
7.6 |
7.2 |
5.1 |
4.4 |
4.3 |
2.3 |
2.9 |
16.9 |
162.8 |
|
Petrochina |
601857 CH |
CNY |
|
|
7.6 |
|
192,262 |
259,713 |
20.7 |
18.2 |
16.9 |
5.0 |
4.8 |
4.7 |
2.5 |
2.8 |
12.8 |
178.2 |
|
Sinopec |
386 HK |
HKD |
|
|
6.6 |
|
102,917 |
117,642 |
9.2 |
9.3 |
9.3 |
3.5 |
3.4 |
3.4 |
8.7 |
8.5 |
47.9 |
262.1 |
|
CNOOC |
883 HK |
HKD |
|
|
12.8 |
|
75,694 |
74,690 |
9.2 |
8.1 |
8.5 |
3.6 |
3.5 |
3.5 |
5.3 |
5.8 |
16.8 |
158.8 |
|
ONGC |
ONGC IN |
INR |
|
|
140.6 |
|
25,558 |
42,734 |
7.5 |
5.6 |
5.4 |
4.8 |
3.8 |
3.8 |
5.1 |
5.8 |
10.0 |
92.3 |
|
Sasol |
SOL SJ |
ZAr |
|
|
42,107 |
|
19,013 |
26,420 |
27.9 |
8.3 |
7.3 |
10.3 |
5.2 |
4.6 |
3.3 |
4.4 |
n/a |
n/a |
|
YPF |
YPFD AR |
ARS |
|
|
579.4 |
|
5,910 |
13,259 |
12.1 |
13.4 |
7.2 |
3.4 |
2.9 |
2.7 |
0.5 |
0.8 |
14.7 |
65.5 |
|
Ecopetrol |
ECOPETL CB |
COP |
|
|
3,115 |
|
39,485 |
51,140 |
9.1 |
9.0 |
9.6 |
4.8 |
4.7 |
5.1 |
3.6 |
4.9 |
30.8 |
196.0 |
|
Cap-weighted average |
|
|
|
|
|
|
|
|
13.9 |
11.8 |
11.2 |
4.7 |
4.2 |
4.2 |
4.2 |
4.6 |
21.3 |
178.6 |
|
International oil companies |
|
|
|
|
|
|
|
|
|
|
|
|
|
|
|
|
|
|
|
Exxon Mobil |
XOM US |
$ |
|
|
78.5 |
|
334,725 |
375,559 |
16.5 |
13.6 |
13.1 |
7.5 |
6.4 |
6.2 |
4.1 |
4.3 |
17.7 |
258.2 |
|
Chevron |
CVX US |
$ |
|
|
118.1 |
|
227,096 |
254,558 |
14.1 |
12.1 |
12.8 |
5.8 |
5.2 |
5.3 |
3.8 |
3.9 |
21.8 |
255.7 |
|
ConocoPhillips |
COP US |
$ |
|
|
66.4 |
|
76,984 |
87,519 |
14.0 |
12.7 |
13.2 |
5.4 |
5.0 |
5.2 |
1.7 |
1.9 |
17.4 |
174.1 |
|
Marathon |
MRO US |
$ |
|
|
16.5 |
|
13,758 |
17,692 |
20.2 |
15.4 |
14.3 |
4.6 |
4.3 |
4.0 |
1.2 |
1.2 |
12.2 |
122.1 |
|
Occidental |
OXY US |
$ |
|
|
70.7 |
|
53,539 |
60,903 |
12.9 |
12.5 |
14.9 |
6.1 |
5.7 |
6.1 |
4.4 |
4.4 |
23.4 |
277.2 |
|
BP |
BP/ LN |
GBp |
|
|
$522 |
|
133,781 |
173,259 |
11.2 |
10.5 |
10.1 |
4.6 |
4.2 |
4.2 |
6.1 |
6.2 |
9.4 |
133.7 |
|
Royal Dutch Shell |
RDSB LN |
GBp |
|
|
2,415 |
|
252,077 |
315,286 |
11.2 |
9.6 |
9.5 |
5.3 |
4.9 |
4.8 |
6.1 |
6.1 |
25.8 |
235.8 |
|
Total |
FP FP |
EUR |
|
|
48.4 |
|
147,993 |
176,953 |
10.3 |
9.2 |
9.1 |
5.1 |
4.6 |
4.5 |
5.4 |
5.5 |
15.4 |
188.9 |
|
ENI |
ENI IM |
EUR |
|
|
14.2 |
|
58,783 |
69,536 |
11.4 |
9.7 |
9.9 |
3.2 |
2.9 |
2.9 |
5.8 |
6.0 |
9.2 |
104.9 |
|
Repsol YPF |
REP SM |
EUR |
|
|
15.1 |
|
27,496 |
36,080 |
9.6 |
8.4 |
7.6 |
4.5 |
4.1 |
3.9 |
6.0 |
6.4 |
15.3 |
142.2 |
|
Equinor ASA |
EQNR NO |
NOK |
|
|
199.8 |
|
77,954 |
87,823 |
11.3 |
9.6 |
9.4 |
3.0 |
2.7 |
2.6 |
3.9 |
4.2 |
16.4 |
115.7 |
|
Cap-weighted average |
|
|
|
|
|
|
|
|
13.1 |
11.3 |
11.3 |
5.6 |
5.0 |
5.0 |
4.7 |
4.8 |
18.5 |
212.8 |
|
Source: Company data, Bloomberg, Renaissance Capital estimates
6

vk.com/id446425943
Renaissance Capital
3 December 2018
Oil & Gas
Figure 22: Comparable multiples analysis for gas companies
Company name |
Ticker |
Currency |
Rating |
TP |
Current price Potential upside / MktCap, |
|
EV, |
|
|
P/E, x |
|
|
|
|
EV/EBITDA, x |
Div yield, % |
|
EV/reserves |
|
EV/production |
||||||||||||||||
29-Nov-18 |
|
downside |
|
$mn |
|
$mn |
2018E |
2019E |
2020E |
|
2018E |
|
2019E |
2020E |
2018E |
2019E |
|
$/boe, 2017 |
|
$/boe, 2017 |
||||||||||||||||
|
|
|
|
|
|
|
|
|
|
|
|
|
|
|||||||||||||||||||||||
Russian Oil and Gas |
|
|
|
|
|
|
|
|
|
|
|
|
|
|
|
|
|
|
|
|
|
|
|
|
|
|
|
|
|
|
|
|
|
|
|
|
Gazprom (RenCap estimates) |
GAZP RX |
|
RUB |
BUY |
220.0 |
165.0 |
|
33% |
|
59,021 |
92,297 |
|
2.9 |
3.2 |
3.2 |
|
2.6 |
2.9 |
2.8 |
4.9 |
4.9 |
|
|
0.7 |
25.3 |
|
||||||||||
Gazprom (consensus estimates) |
GAZP RX |
|
|
|
|
|
|
|
|
|
|
|
|
|
|
3.0 |
2.9 |
2.9 |
|
2.6 |
|
2.5 |
2.5 |
5.9 |
7.6 |
|
|
|
|
|
|
|
||||
NOVATEK (RenCap estimates) |
NVTK RM |
|
RUB |
HOLD |
1,070.0 |
1,167.8 |
|
-8% |
|
53,580 |
54,638 |
|
20 |
15.0 |
13.5 |
|
14.6 |
15.1 |
14.2 |
1.3 |
1.4 |
|
|
3.7 |
108.4 |
|||||||||||
NOVATEK (consensus estimates) |
NVTK RM |
|
|
|
|
|
|
|
|
|
|
|
|
|
|
15.3 |
11.7 |
11.0 |
|
12.6 |
|
13.0 |
12.0 |
1.7 |
2.1 |
|
|
|
|
|
|
|
||||
Weighted average |
|
|
|
|
|
|
|
|
|
|
|
|
|
|
|
|
11.0 |
8.8 |
8.1 |
|
8.3 |
8.7 |
8.3 |
3.2 |
3.2 |
|
|
2.1 |
64.9 |
|
||||||
Premium/(discount) to International, % |
|
|
|
|
|
|
|
|
|
|
|
|
|
|
|
|
(33.6) |
(33.7) |
(25.7) |
|
39.4 |
|
69.1 |
78.6 |
22.7 |
14.1 |
|
|
-86.6 |
-47.7 |
|
|||||
International oil companies |
|
|
|
|
|
|
|
|
|
|
|
|
|
|
|
|
|
|
|
|
|
|
|
|
|
|
|
|
|
|
|
|
|
|
|
|
Engie |
ENGI FP |
|
EUR |
|
|
12.5 |
|
|
|
|
|
34,608 |
63,866 |
|
12.7 |
11.8 |
10.1 |
|
6.2 |
|
5.9 |
5.5 |
6.0 |
6.2 |
|
|
n/a |
|
n/a |
|
||||||
Devon Energy |
DVN US |
|
$ |
|
|
26.9 |
|
|
|
|
12,599 |
15,545 |
|
12.7 |
14.2 |
10.6 |
|
4.9 |
4.6 |
3.8 |
1.1 |
1.3 |
|
|
7.2 |
78.4 |
|
|||||||||
Murphy Oil |
MUR US |
|
$ |
|
|
32.0 |
|
|
|
|
|
5,520 |
7,498 |
|
18.8 |
8.7 |
9.5 |
|
4.6 |
|
3.4 |
3.3 |
3.1 |
3.1 |
|
|
10.7 |
125.6 |
||||||||
Chesapeake Energy |
CHK US |
|
$ |
|
|
3.0 |
|
|
|
|
2,769 |
14,371 |
|
3.5 |
2.5 |
1.8 |
|
6.1 |
5.3 |
4.5 |
0.0 |
0.0 |
|
|
7.5 |
71.9 |
|
|||||||||
Encana |
ECA CN |
|
CAD |
|
|
$9 |
|
|
|
|
|
6,624 |
10,227 |
|
11.7 |
5.6 |
4.8 |
|
4.6 |
|
2.9 |
2.2 |
0.9 |
1.1 |
|
|
12.9 |
89.5 |
|
|||||||
Pioneer Natural Resources |
PXD US |
|
$ |
|
|
148 |
|
|
|
|
25,428 |
26,238 |
|
21.5 |
13.3 |
10.6 |
|
7.8 |
6.0 |
5.0 |
0.2 |
0.3 |
|
|
26.6 |
264.0 |
||||||||||
Apache |
APA US |
|
$ |
|
|
35.3 |
|
|
|
|
|
13,489 |
22,433 |
|
17.1 |
20.1 |
16.7 |
|
4.4 |
|
4.5 |
4.4 |
2.8 |
2.8 |
|
|
19.1 |
134.4 |
||||||||
Anadarko Petroleum |
APC US |
|
$ |
|
|
52.5 |
|
|
|
|
27,080 |
44,426 |
|
20.2 |
15.4 |
12.2 |
|
5.7 |
5.0 |
4.5 |
1.7 |
2.1 |
|
|
30.9 |
181.1 |
||||||||||
Cap-weighted average |
|
|
|
|
|
|
|
|
|
|
|
|
|
|
|
|
16.5 |
13.3 |
10.9 |
|
6.0 |
|
5.2 |
4.6 |
2.6 |
2.8 |
|
|
15.8 |
124.1 |
||||||
|
|
|
|
|
|
|
|
|
|
|
|
|
|
|
|
|
|
|
|
|
|
|
|
|
|
|
|
Source: Company data, Bloomberg, Renaissance Capital estimates |
||||||||
Figure 23: Comparable multiples analysis for pipeline operators |
|
|
|
|
|
|
|
|
|
|
|
|
|
|
|
|
|
|
|
|
|
|
|
|
|
|
|
|
|
|
|
|
||||
Company name |
|
Ticker |
|
Currency Rating |
TP |
Current price |
Potential upside / |
|
MktCap, |
EV, |
|
|
|
|
|
P/E, x |
|
|
|
EV/EBITDA, x |
|
Div yield, % |
||||||||||||||
|
|
|
29-Nov-18 |
|
downside |
|
$mn |
|
$mn |
|
2018E |
2019E |
2020E |
|
2018E |
2019E |
|
2020E |
|
2018E |
2019E |
|||||||||||||||
|
|
|
|
|
|
|
|
|
|
|
|
|
|
|
|
|||||||||||||||||||||
Russian pipeline operators |
|
|
|
|
|
|
|
|
|
|
|
|
|
|
|
|
|
|
|
|
|
|
|
|
|
|
|
|
|
|
|
|
|
|
|
|
Transneft (RenCap estimates) |
|
TRNFP RX |
RUB |
BUY |
215,000.0 |
|
171,350.0 |
|
25% |
18,445 |
24,118 |
6.0 |
|
|
6.2 |
6.4 |
|
2.8 |
2.7 |
2.7 |
|
8.4 |
8.1 |
|||||||||||||
Transneft (consensus estimates) |
|
TRNFP RX |
|
|
|
|
|
|
|
|
|
|
|
|
|
|
|
|
6.1 |
|
|
5.6 |
4.9 |
|
3.6 |
3.4 |
|
3.2 |
|
5.9 |
6.5 |
|||||
Gazprom (RenCap estimates) |
|
GAZP RX |
RUB |
BUY |
220.0 |
|
165.0 |
|
33% |
59,021 |
92,297 |
2.9 |
|
|
3.2 |
3.2 |
|
2.6 |
2.9 |
2.8 |
|
4.9 |
4.9 |
|||||||||||||
Gazprom (consensus estimates) |
|
GAZP RX |
|
|
|
|
|
|
|
|
|
|
|
|
|
|
|
|
3.0 |
|
|
2.9 |
2.9 |
|
2.6 |
2.5 |
|
2.5 |
|
5.9 |
7.6 |
|||||
Weighted average |
|
|
|
|
|
|
|
|
|
|
|
|
|
|
|
|
|
|
3.7 |
|
|
3.9 |
4.0 |
|
2.6 |
2.9 |
2.8 |
|
5.7 |
5.6 |
||||||
Premium/(discount) to International, % |
|
|
|
|
|
|
|
|
|
|
|
|
|
|
|
|
|
|
|
(74.4) |
|
(71.5) |
(70.8) |
|
(74.1) |
(69.9) |
|
(70.4) |
|
25.1 |
16.2 |
|||||
European pipeline operators |
|
|
|
|
|
|
|
|
|
|
|
|
|
|
|
|
|
|
|
|
|
|
|
|
|
|
|
|
|
|
|
|
|
|
|
|
Elia |
|
ELI BB |
|
EUR |
|
|
|
|
57.9 |
|
|
|
|
4,012 |
7,246 |
|
13.6 |
|
13.5 |
13.0 |
|
8.6 |
7.4 |
|
7.0 |
|
2.9 |
2.9 |
||||||||
Red Electrica |
|
REE SM |
|
EUR |
|
|
|
|
19.0 |
|
|
|
11,669 |
17,890 |
14.6 |
|
14.1 |
14.7 |
|
10.2 |
10.0 |
10.2 |
|
5.1 |
5.5 |
|||||||||||
Transelectrica |
|
TEL RO |
|
RON |
|
|
|
|
23.8 |
|
|
|
|
425 |
|
421 |
|
19.9 |
|
11.2 |
9.1 |
|
n/a |
|
n/a |
|
n/a |
|
n/a |
n/a |
||||||
Terna |
|
TRN IM |
|
EUR |
|
|
|
|
4.9 |
|
|
|
11,170 |
20,011 |
14.1 |
|
13.4 |
13.0 |
|
10.8 |
10.2 |
9.9 |
|
4.7 |
5.1 |
|||||||||||
Cap-weighted average |
|
|
|
|
|
|
|
|
|
|
|
|
|
|
|
|
|
|
|
14.3 |
|
13.7 |
13.6 |
|
10.0 |
9.5 |
|
9.5 |
|
4.6 |
4.9 |
|||||
Source: Company data, Bloomberg, Renaissance Capital estimates
7

vk.com/id446425943
Renaissance Capital
3 December 2018
Oil & Gas
Figure 24: E&Ps – comparable multiples analysis
|
|
Country of |
|
Current price |
|
MktCap, |
EV, |
|
Earnings |
EBITDA |
P/E, x |
EV/EBITDA, x 2P reserves, 2C resources, Production, EV/2P |
EV/(2P+2C), |
EV/production |
|||||||||||||||
Company name |
Ticker major operations Currency |
|
29-Nov-18 |
|
|
|
$mn |
$mn |
2017, $mn 2017, $mn |
2017 |
|
2017 |
mn boe |
mn boe |
kboe |
|
$/boe, 2017 |
$/boe |
$/boe, 2017 |
||||||||||
Nostrum Oil&Gas |
NOG LN |
Kazakhstan |
GBp |
|
134.6 |
|
|
|
323.7 |
1321.9 |
-23.88 |
253.63 |
n/m |
|
5.2 |
488.0 |
221.8 |
14308 |
|
|
2.7 |
1.9 |
92.4 |
||||||
Exillon Energy |
EXI LN |
Russia |
GBp |
|
71.1 |
|
|
|
146.7 |
271.5 |
47.6 |
80.5 |
3.1 |
|
3.4 |
500.3 |
0 |
|
3874 |
|
|
0.5 |
0.5 |
70.1 |
|||||
Petroneft resources |
PTR LN |
Russia |
GBp |
|
1.5 |
|
|
|
13.6 |
14.6 |
n/m |
|
n/m |
n/m |
|
n/m |
65.0 |
16 |
|
817 |
|
|
0.2 |
0.2 |
17.8 |
||||
Volga Gas |
VGAS LN |
Russia |
GBp |
|
56.0 |
|
|
|
56.3 |
44.0 |
0.3 |
8.8 |
170.6 |
|
5.0 |
26.5 |
0 |
|
1806 |
|
|
1.7 |
1.7 |
24.4 |
|||||
Zoltav resources |
ZOL LN |
Russia |
GBp |
|
16.5 |
|
|
|
29.9 |
47.4 |
n/m |
|
n/m |
n/m |
|
n/m |
210.4 |
5 |
|
3344 |
|
|
0.2 |
0.2 |
14.2 |
||||
Araca energy |
ARACA NS |
Russia |
NOK |
|
0.1 |
|
|
|
17.3 |
17.6 |
n/m |
|
n/m |
n/m |
|
n/m |
2.6 |
|
|
87 |
|
|
6.9 |
6.9 |
201 |
||||
Urals energy |
UEN LN |
Russia |
GBp |
|
30.0 |
|
|
|
4.8 |
24.1 |
n/m |
|
n/m |
n/m |
|
n/m |
108.2 |
0 |
|
757 |
|
|
0.2 |
0.2 |
31.8 |
||||
JKX |
JKX LN |
Ukraine |
GBp |
|
31.5 |
|
|
|
69.1 |
72.4 |
-17.7 |
25.3 |
n/m |
|
2.9 |
95.1 |
166 |
|
3160 |
|
|
0.8 |
0.3 |
22.9 |
|||||
Regal petroleum |
RPT LN |
Ukraine |
GBp |
|
44.4 |
|
|
|
181.9 |
141.8 |
2.3 |
17.3 |
79.5 |
|
8.2 |
13.5 |
75 |
|
596 |
|
10.5 |
1.6 |
237.9 |
||||||
Caspian Sunrise |
CASP LN |
Kazakhstan |
GBp |
|
6.3 |
|
|
|
135.5 |
131.8 |
n/m |
|
n/m |
n/m |
|
n/m |
29.9 |
|
|
|
|
|
4.4 |
4.4 |
|
||||
Jupiter Energy |
JPR AU |
Kazakhstan |
AUD |
|
0.1 |
|
|
|
5.8 |
5.5 |
|
-6.1 |
-2.2 |
n/m |
|
n/m |
19.2 |
64 |
|
|
|
|
0.3 |
0.1 |
|
||||
Average |
|
|
|
|
|
|
|
|
|
|
|
|
|
|
|
|
84.4 |
|
4.9 |
|
|
|
|
|
|
|
2.6 |
1.6 |
79.2 |
|
|
|
|
|
|
|
|
|
|
|
|
|
|
|
|
|
|
|
|
|
|
|
|
|
|
Source: Company data, Bloomberg, Renaissance Capital |
|||
Figure 25: Comparable valuation multiples for oil refiners |
|
|
|
|
|
|
|
|
|
|
|
|
|
|
|
|
|
|
|
|
|
|
|
|
|
|
|
||
Company name |
|
Ticker |
Currency Rating |
Target |
|
Current price |
Upside/ |
MktCap, Net debt, |
EV, |
|
P/E, x |
|
EV/EBITDA, x |
Div yield, % |
Refining capacity |
EV/production |
|||||||||||||
|
price |
|
29-Nov-18 |
downside |
$mn |
|
$mn |
$mn |
2018E 2019E |
2020E |
2018E |
2019E |
2020E |
2018E |
2019E |
mnt pa, 2017 |
$/boe, 2017 |
||||||||||||
|
|
|
|
|
|
|
|
||||||||||||||||||||||
Our coverage universe |
|
|
|
|
|
|
|
|
|
|
|
|
|
|
|
|
|
|
|
|
|
|
|
|
|
|
|
|
|
Tupras (RenCap estimates) |
|
TUPRS TI |
TRY |
|
BUY |
176.0 |
125.8 |
|
|
40% |
6,085 |
1,729 |
7,814 |
7.4 |
4.8 |
4.6 |
5.9 |
4.3 |
4.2 |
10.8 |
16.7 |
|
28.1 |
37.9 |
|||||
Tupras (consensus estimates) |
|
TUPRS TI |
|
|
|
|
|
|
|
|
|
|
|
|
|
|
|
9.5 |
6.8 |
5.4 |
5.8 |
5.3 |
4.7 |
11.9 |
16.3 |
|
|
|
|
MOL (RenCap estimates) |
|
MOL HB |
HUF |
|
BUY |
4,200 |
3,178 |
|
|
32% |
7,835 |
2,317 |
10,153 |
8.3 |
9.0 |
9.4 |
4.0 |
4.1 |
4.2 |
2.9 |
3.2 |
|
20.9 |
66.3 |
|||||
MOL (consensus estimates) |
|
MOL HB |
|
|
|
|
|
|
|
|
|
|
|
|
|
|
|
8.2 |
7.5 |
7.0 |
4.1 |
4.0 |
3.9 |
3.7 |
3.6 |
|
|
|
|
PKN ORLEN (RenCap estimates) |
PKN PW |
PLN |
|
HOLD |
|
98.0 |
112.9 |
|
|
-13% |
12,802 |
1,378 |
14,179 |
8.3 |
9.3 |
9.2 |
5.9 |
5.8 |
5.8 |
2.8 |
2.9 |
|
35.2 |
55.0 |
|||||
PKN ORLEN (consensus estimates) |
PKN PW |
|
|
|
|
|
|
|
|
|
|
|
|
|
|
|
9.8 |
10.2 |
9.8 |
5.9 |
6.1 |
5.8 |
2.9 |
3.0 |
|
|
|
||
Grupa LOTOS (RenCap estimates) |
LTS PW |
PLN |
|
BUY |
|
92.0 |
81.2 |
|
|
13% |
3,984 |
994 |
4,978 |
10.8 |
7.5 |
6.4 |
7.2 |
5.2 |
4.6 |
1.4 |
1.4 |
|
10.5 |
64.7 |
|||||
Grupa LOTOS (consensus estimates) |
LTS PW |
|
|
|
|
|
|
|
|
|
|
|
|
|
|
|
9.8 |
10.1 |
8.2 |
6.0 |
6.0 |
5.1 |
2.2 |
2.6 |
|
|
|
||
OMV Petrom (RenCap estimates) |
SNP RE |
RON |
BUY |
|
0.46 |
0.37 |
|
|
25% |
5,060 |
(1,171) |
3,889 |
6.6 |
7.1 |
8.0 |
2.2 |
2.2 |
2.4 |
5.7 |
6.0 |
|
4.5 |
117.9 |
||||||
OMV Petrom (consensus estimates) |
SNP RE |
|
|
|
|
|
|
|
|
|
|
|
|
|
|
|
6.4 |
5.8 |
6.0 |
2.1 |
2.1 |
2.1 |
7.8 |
7.8 |
|
|
|
||
Cap-weighted average |
|
|
|
|
|
|
|
|
|
|
|
|
|
|
|
|
|
8.2 |
8.0 |
8.0 |
5.1 |
4.6 |
4.5 |
4.4 |
5.6 |
|
23.8 |
64.5 |
|
Comparable companies |
|
|
|
|
|
|
|
|
|
|
|
|
|
|
|
|
|
|
|
|
|
|
|
|
|
|
|
|
|
Motor Oil (consensus estimates) |
MOH GA |
EUR |
|
|
|
|
|
20.2 |
|
|
|
2,540 |
337 |
2,825 |
8.0 |
8.3 |
7.0 |
4.5 |
4.6 |
4.0 |
6.9 |
7.6 |
|
9.2 |
41.8 |
||||
Neste Oil (consensus estimates) |
NESTE FH |
EUR |
|
|
|
|
|
|
69.6 |
|
|
|
20,311 |
|
489 |
20,498 |
17.1 |
15.2 |
14.4 |
10.9 |
9.9 |
9.5 |
3.3 |
3.5 |
|
15.0 |
186.4 |
||
Hellenic Petroleum (consensus estimates) |
ELPE GA |
EUR |
|
|
|
|
|
7.0 |
|
|
|
2,441 |
2,166 |
4,576 |
7.2 |
7.8 |
7.2 |
5.4 |
5.7 |
5.6 |
5.9 |
6.6 |
|
17.0 |
36.7 |
||||
Saras (consensus estimates) |
|
SRS IM |
EUR |
|
|
|
|
|
|
1.7 |
|
|
|
1,857 |
|
(94) |
1,775 |
15.7 |
8.9 |
6.6 |
4.0 |
3.5 |
2.8 |
5.8 |
7.5 |
|
15.0 |
16.1 |
|
Phillips 66 (consensus estimates) |
PSX US |
USD |
|
|
|
|
|
92.6 |
|
|
|
42,737 |
6,991 |
55,626 |
10.1 |
9.6 |
8.4 |
7.0 |
6.7 |
6.0 |
3.7 |
3.9 |
|
109.5 |
69.3 |
||||
Valero (consensus estimates) |
|
VLO US |
USD |
|
|
|
|
|
|
79.4 |
|
|
|
33,720 |
|
3,022 |
40,295 |
12.5 |
8.7 |
6.6 |
6.6 |
5.3 |
4.4 |
4.4 |
4.6 |
|
154.4 |
35.6 |
|
Marathon Petroleum (consensus estimates) |
MPC US |
USD |
|
|
|
|
|
65.3 |
|
|
|
44,836 |
9,935 |
63,161 |
16.5 |
9.4 |
7.6 |
8.2 |
5.1 |
4.6 |
3.1 |
3.3 |
|
93.7 |
92.0 |
||||
Cap-weighted average |
|
|
|
|
|
|
|
|
|
|
|
|
|
|
|
|
|
13.6 |
10.0 |
8.5 |
7.7 |
6.2 |
5.6 |
3.7 |
4.0 |
|
97.6 |
82.9 |
|
Source: Company data, Bloomberg, Renaissance Capital estimates
8

vk.com/id446425943
Renaissance Capital
3 December 2018
Oil & Gas
Figure 26: Comparable valuation table for petrochemical companies
Company name |
Ticker |
Currency |
Rating |
Target |
Current price |
Upside/ |
MktCap, |
Net Debt, |
EV, |
|
P/E, x |
|
EV/EBITDA, x |
Div yield, % |
EBITDA |
EBITDA, |
||||
price |
29-Nov-18 |
downside |
$mn |
$mn |
$mn |
2018E |
2019E |
2020E |
2018E |
2019E |
2020E |
2018E |
2019E |
margin 2017 |
$mn 2017 |
|||||
|
|
|
|
|||||||||||||||||
|
|
|
|
|
|
|
|
|
|
|
|
|
|
|
|
|
|
|
|
|
EM petrochemicals |
|
|
|
|
|
|
|
|
|
|
|
|
|
|
|
|
|
|
|
|
Saudi Basic Industries |
SABIC AB |
SAR |
|
|
117.2 |
|
93,857 |
(1,420) |
106,993 |
14.6 |
14.5 |
14.8 |
7.6 |
7.6 |
7.7 |
4.2 |
4.2 |
29.3 |
11,691 |
|
Formosa Petrochemical |
6505 TT |
TWD |
|
|
111.0 |
|
34,484 |
(2,169) |
32,450 |
13.7 |
15.8 |
15.0 |
9.4 |
10.6 |
10.2 |
4.9 |
5.3 |
17.7 |
3,627 |
|
Petronas Chemicals |
PCHEM MK |
MYR |
|
|
9.3 |
|
17,610 |
(1,631) |
15,513 |
16.1 |
15.9 |
14.7 |
9.4 |
9.1 |
8.6 |
3.2 |
3.5 |
39.2 |
1,589 |
|
Braskem |
BRKM3 BZ |
BRL |
|
|
51.7 |
|
11,081 |
8,236 |
18,193 |
12.1 |
14.2 |
15.1 |
5.8 |
6.1 |
6.1 |
n/a |
n/a |
24.9 |
3,837 |
|
PTT Global Chemical |
PTTGC TB |
THB |
|
|
78.5 |
|
10,688 |
1,313 |
12,130 |
8.1 |
8.4 |
8.0 |
6.1 |
6.2 |
5.9 |
5.6 |
6.0 |
13.8 |
1,796 |
|
Yanbu National Petrocemical |
YANSAB AB |
SAR |
|
|
64.9 |
|
9,744 |
(509) |
9,043 |
13.2 |
12.6 |
15.0 |
8.9 |
8.4 |
9.5 |
6.7 |
7.1 |
48.5 |
934 |
|
Indorama |
IVL TB |
THB |
|
|
53.5 |
|
9,129 |
2,725 |
12,606 |
11.3 |
10.4 |
9.7 |
8.8 |
7.8 |
7.5 |
3.0 |
3.1 |
12.5 |
1,053 |
|
Saudi Kayan Petrochemical |
KAYAN AB |
SAR |
|
|
14.0 |
|
5,556 |
5,753 |
10,735 |
9.3 |
10.4 |
12.1 |
7.8 |
7.9 |
8.1 |
0.1 |
1.8 |
39.5 |
1,051 |
|
Petkim (Rencap estimates) |
PETKM TI |
TRY |
HOLD |
8.0 |
5.3 |
50% |
1,702 |
632 |
2,334 |
9.0 |
3.6 |
3.2 |
10.0 |
6.7 |
4.8 |
0.0 |
13.8 |
n/a |
n/a |
|
Petkim |
PETKM TI |
TRY |
|
|
5.3 |
|
1,702 |
632 |
2,334 |
8.8 |
7.6 |
6.3 |
8.1 |
6.9 |
7.1 |
7.9 |
9.1 |
23.9 |
483 |
|
Cap-weighted average |
|
|
|
|
|
|
|
|
|
13.7 |
14.0 |
14.0 |
8.0 |
8.1 |
8.1 |
4.0 |
4.3 |
27.2 |
6,895 |
|
European petrochemicals |
|
|
|
|
|
|
|
|
|
|
|
|
|
|
|
|
|
|
|
|
BASF |
BAS GY |
EUR |
|
|
64.9 |
|
67,782 |
13,807 |
89,833 |
10.8 |
10.3 |
9.5 |
7.7 |
7.3 |
6.9 |
5.2 |
5.3 |
19.0 |
13,856 |
|
Solvay |
SOLB BB |
EUR |
|
|
96.4 |
|
11,618 |
3,888 |
18,183 |
11.9 |
11.0 |
9.8 |
7.4 |
6.8 |
6.5 |
3.8 |
4.0 |
19.2 |
2,366 |
|
Arkema |
AKE FP |
EUR |
|
|
84.6 |
|
7,374 |
1,270 |
8,800 |
9.4 |
9.1 |
8.5 |
5.3 |
5.1 |
4.9 |
3.2 |
3.4 |
16.2 |
1,521 |
|
Lanxess |
LXS GR |
EUR |
|
|
50.1 |
|
5,207 |
2,740 |
9,405 |
10.6 |
11.4 |
10.2 |
8.4 |
7.8 |
7.3 |
2.1 |
2.4 |
11.1 |
1,211 |
|
Cap-weighted average |
|
|
|
|
|
|
|
|
|
10.8 |
10.4 |
9.5 |
7.5 |
7.1 |
6.7 |
4.7 |
4.8 |
18.4 |
10,700 |
|
US Petrochemicals |
|
|
|
|
|
|
|
|
|
|
|
|
|
|
|
|
|
|
|
|
LyondellBasell Industries |
LYB US |
USD |
|
|
92.0 |
|
35,688 |
5,789 |
43,040 |
7.6 |
8.2 |
7.1 |
5.9 |
6.1 |
5.6 |
4.6 |
4.9 |
19.2 |
6,634 |
|
Celanese |
CE US |
USD |
|
|
100.5 |
|
13,449 |
3,033 |
16,542 |
9.0 |
9.0 |
8.4 |
7.6 |
7.6 |
7.2 |
2.3 |
2.7 |
19.7 |
1,212 |
|
Eastman Chemical |
EMN US |
USD |
|
|
79.1 |
|
11,069 |
6,345 |
17,571 |
9.1 |
8.7 |
8.1 |
7.6 |
7.4 |
7.1 |
3.0 |
3.2 |
22.2 |
2,119 |
|
Westlake Chemical |
WLK US |
USD |
|
|
70.1 |
|
9,277 |
2,306 |
11,642 |
8.3 |
8.7 |
7.5 |
5.3 |
5.4 |
4.9 |
1.4 |
1.5 |
22.8 |
1,834 |
|
Cap-weighted average |
|
|
|
|
|
|
|
|
|
8.2 |
8.5 |
7.6 |
6.4 |
6.5 |
6.0 |
3.5 |
3.7 |
20.3 |
4,224 |
|
Global cap-weighted average |
|
|
|
|
|
|
|
|
|
11.9 |
12.0 |
11.6 |
7.6 |
7.6 |
7.3 |
4.1 |
4.4 |
23.6 |
7,325 |
|
Source: Company data, Bloomberg, Renaissance Capital estimates
9

vk.com/id446425943
Renaissance Capital
3 December 2018
Oil & Gas
Figure 27: Price performance of oil and gas companies in Russia, FSU and EM
|
|
|
Current price |
MktCap, |
52 weeks |
Share price performance, |
Share price performance |
Share price performance |
Share price performance (rel. to |
|||||||||||||
Company name |
Ticker |
Currency |
|
(abs),% |
|
(rel. to RTS Index), % |
(rel. to MSCI EM Index), % |
Bloomberg World Oil & Gas Index), % |
||||||||||||||
|
|
|
29-Nov-18 |
$mn |
High |
Low |
1W |
1M |
3M |
12M |
1W |
1M |
3M |
12M |
1W |
1M |
3M |
12M |
1W |
1M |
3M |
12M |
|
|
|
|
|
||||||||||||||||||
|
|
|
|
|
|
|
|
|
|
|
|
|
|
|
|
|
|
|
|
|
|
|
Gazprom |
GAZP RX |
RUB |
165.0 |
59,021 |
177.0 |
128.2 |
8.2 |
5.6 |
9.5 |
24.3 |
5.7 |
3.8 |
7.2 |
8.8 |
4.6 |
0.1 |
16.6 |
20.1 |
4.7 |
8.1 |
20.8 |
9.0 |
NOVATEK |
NVTK RM |
RUB |
1,167.8 |
53,580 |
1,215.0 |
647.3 |
5.2 |
11.8 |
8.4 |
80.6 |
2.8 |
9.9 |
6.1 |
58.3 |
1.7 |
6.2 |
15.4 |
69.5 |
1.8 |
14.2 |
19.6 |
58.5 |
Rosneft |
ROSN RX |
RUB |
417.0 |
66,781 |
522.8 |
281.7 |
3.4 |
-9.0 |
-3.8 |
42.7 |
1.0 |
-10.7 |
-6.3 |
25.0 |
-0.1 |
-14.4 |
3.1 |
36.3 |
0.0 |
-6.4 |
7.2 |
25.2 |
LUKOIL |
LKOH RX |
RUB |
4,766.0 |
54,014 |
5,192.5 |
3,262.5 |
3.3 |
-2.4 |
2.6 |
46.5 |
0.9 |
-4.2 |
0.3 |
28.4 |
-0.2 |
-7.9 |
9.6 |
39.6 |
-0.1 |
0.1 |
13.8 |
28.6 |
Surgutneftegas |
SNGS RX |
RUB |
27.2 |
19,012 |
30.9 |
26.0 |
0.6 |
3.0 |
-4.8 |
-0.5 |
-1.8 |
1.2 |
-7.2 |
-12.9 |
-2.9 |
-2.5 |
2.1 |
-1.7 |
-2.8 |
5.5 |
6.3 |
-12.7 |
Surgutneftegas Prefs |
SNGSP RX |
RUB |
37.1 |
4,323 |
39.0 |
27.5 |
-1.8 |
-1.8 |
0.1 |
31.9 |
-4.2 |
-3.6 |
-2.3 |
15.6 |
-5.3 |
-7.2 |
7.0 |
26.8 |
-5.2 |
0.7 |
11.2 |
15.8 |
Gazprom Neft |
SIBN RX |
RUB |
359.1 |
25,728 |
404.6 |
241.2 |
2.8 |
-6.2 |
7.5 |
43.8 |
0.4 |
-7.9 |
5.2 |
26.0 |
-0.7 |
-11.6 |
14.6 |
37.2 |
-0.6 |
-3.7 |
18.7 |
26.2 |
Tatneft |
TATN RM |
RUB |
714.0 |
24,649 |
847.1 |
452.3 |
-1.4 |
-8.7 |
-8.5 |
56.9 |
-3.8 |
-10.3 |
-11.0 |
37.5 |
-4.9 |
-14.0 |
-1.7 |
48.7 |
-4.8 |
-6.1 |
2.5 |
37.7 |
Tatneft Prefs |
TATNP RX |
RUB |
512.8 |
1,143 |
597.3 |
341.0 |
1.5 |
-3.0 |
-3.0 |
44.2 |
-1.0 |
-4.7 |
-5.4 |
26.4 |
-2.1 |
-8.4 |
3.9 |
37.6 |
-2.0 |
-0.5 |
8.1 |
26.6 |
Bashneft |
BANE RX |
RUB |
1,939.0 |
5,165 |
2,495.0 |
1,853.0 |
1.3 |
1.3 |
-2.4 |
-14.4 |
-1.1 |
-0.5 |
-4.8 |
-25.1 |
-2.2 |
-4.2 |
4.6 |
-13.8 |
-2.1 |
3.8 |
8.7 |
-24.9 |
Bashneft prefs |
BANEP RX |
RUB |
1,851.0 |
833 |
1,952.5 |
1,282.0 |
2.0 |
2.1 |
9.6 |
23.5 |
-0.5 |
0.3 |
7.4 |
8.2 |
-1.6 |
-3.4 |
16.7 |
19.4 |
-1.5 |
4.5 |
20.9 |
8.4 |
Russneft |
RNFT RM |
RUB |
527.6 |
2,337 |
634.0 |
462.2 |
1.1 |
-5.6 |
-14.4 |
n/a |
-1.3 |
-7.3 |
-17.0 |
n/a |
-2.4 |
-10.9 |
-7.6 |
n/a |
-2.3 |
-3.0 |
-3.5 |
n/a |
Transneft pref |
TRNFP RX |
RUB |
171,350.0 |
18,445 |
182,496.5 |
138,200.0 |
2.6 |
1.1 |
21.3 |
-1.0 |
0.2 |
-0.6 |
19.2 |
-13.3 |
-0.9 |
-4.3 |
28.6 |
-2.1 |
-0.8 |
3.6 |
32.7 |
-13.1 |
Cap-weighted average |
|
|
|
|
|
|
3.8 |
(0.2) |
3.4 |
41.0 |
1.4 |
(2.0) |
1.1 |
23.7 |
0.3 |
(5.7) |
10.4 |
34.8 |
0.4 |
2.3 |
14.6 |
23.9 |
Transport companies |
|
|
|
|
|
|
|
|
|
|
|
|
|
|
|
|
|
|
|
|
|
|
Transneft |
TRNFP RX |
RUB |
171,350.0 |
18,445 |
182,496.5 |
138,200.0 |
2.6 |
1.1 |
21.3 |
-1.0 |
0.2 |
-0.6 |
19.2 |
-13.3 |
-0.9 |
-4.3 |
28.6 |
-2.1 |
-0.8 |
3.6 |
32.7 |
-13.1 |
KazTransOil |
KZTO KZ |
KZT |
1,297.1 |
1,343 |
1,620.0 |
1,230.0 |
-1.9 |
0.0 |
-4.1 |
-2.0 |
-5.6 |
-1.7 |
-10.4 |
-13.2 |
-6.7 |
-5.3 |
-1.0 |
-2.0 |
-6.6 |
2.6 |
3.1 |
-13.0 |
Cap-weighted average |
|
|
|
|
|
|
2.3 |
1.1 |
19.6 |
(1.0) |
(0.2) |
(0.7) |
17.2 |
(13.3) |
(1.3) |
(4.4) |
26.6 |
(2.1) |
(1.2) |
3.6 |
30.7 |
(13.1) |
Alternatives |
|
|
|
|
|
|
|
|
|
|
|
|
|
|
|
|
|
|
|
|
|
|
Nostrum |
NOG LN |
GBp |
134.6 |
324 |
374.0 |
130.8 |
-24.4 |
-34.7 |
-47.1 |
-59.1 |
-26.1 |
-35.5 |
-50.2 |
-57.0 |
-27.2 |
-39.2 |
-40.9 |
-45.8 |
-27.1 |
-31.2 |
-36.7 |
-56.8 |
Exillon Energy |
EXI LN |
GBp |
71.1 |
147 |
105.0 |
63.2 |
2.2 |
3.5 |
-3.9 |
-30.6 |
0.5 |
2.6 |
-6.4 |
-26.9 |
-0.6 |
-1.0 |
2.9 |
-15.6 |
-0.5 |
6.9 |
7.1 |
-26.7 |
PetroNeft Resources |
PTR LN |
GBp |
1.5 |
14 |
2.1 |
1.3 |
0.0 |
11.1 |
-3.2 |
-3.2 |
-1.6 |
10.2 |
-5.7 |
2.2 |
-2.7 |
6.6 |
3.6 |
13.4 |
-2.6 |
14.5 |
7.8 |
2.4 |
Volga Gas |
VGAS LN |
GBp |
56.0 |
56 |
61.5 |
49.0 |
-2.7 |
0.9 |
0.0 |
-6.8 |
-4.3 |
0.1 |
-2.5 |
-1.7 |
-5.4 |
-3.6 |
6.9 |
9.5 |
-5.3 |
4.3 |
11.1 |
-1.5 |
Urals Energy |
UEN LN |
GBp |
30.0 |
5 |
130.0 |
20.0 |
20.0 |
0.0 |
-68.4 |
-50.8 |
18.4 |
-0.9 |
-71.8 |
-48.2 |
17.3 |
-4.5 |
-62.5 |
-37.0 |
17.4 |
3.4 |
-58.3 |
-48.0 |
Zoltav Resources |
ZOL LN |
GBp |
16.5 |
30 |
30.5 |
12.8 |
3.1 |
13.8 |
3.1 |
11.9 |
1.5 |
12.9 |
0.7 |
18.1 |
0.4 |
9.2 |
10.1 |
29.3 |
0.5 |
17.2 |
14.2 |
18.3 |
JKX Petroleum |
JKX LN |
GBp |
31.5 |
69 |
48.0 |
10.3 |
-12.5 |
-30.0 |
6.8 |
147.1 |
-14.2 |
-30.8 |
4.4 |
161.2 |
-15.3 |
-34.5 |
13.8 |
172.4 |
-15.2 |
-26.6 |
17.9 |
161.4 |
Regal Petroleum |
RPT LN |
GBp |
44.4 |
182 |
64.0 |
6.2 |
-5.5 |
-23.4 |
33.7 |
557.8 |
-7.2 |
-24.3 |
31.7 |
595.9 |
-8.3 |
-28.0 |
41.1 |
607.1 |
-8.2 |
-20.0 |
45.3 |
596.1 |
Cadogan Petroleum |
CAD LN |
GBp |
6.6 |
20 |
10.0 |
6.3 |
2.0 |
-10.3 |
-19.0 |
-17.5 |
0.3 |
-11.2 |
-21.7 |
-12.9 |
-0.8 |
-14.9 |
-12.4 |
-1.7 |
-0.7 |
-6.9 |
-8.2 |
-12.7 |
Caspian Sunrise |
CASP LN |
GBp |
6.3 |
135 |
14.0 |
5.8 |
2.4 |
-16.4 |
-31.4 |
-44.8 |
0.8 |
-17.3 |
-34.3 |
-41.8 |
-0.3 |
-21.0 |
-24.9 |
-30.6 |
-0.2 |
-13.0 |
-20.7 |
-41.6 |
Cap-weighted average |
|
|
|
|
|
|
(9.1) |
(18.9) |
(11.3) |
83.1 |
(10.7) |
(19.8) |
(14.1) |
93.2 |
(11.8) |
(23.5) |
(4.7) |
104.4 |
(11.8) |
(15.5) |
(0.6) |
93.4 |
FSU Cap-weighted average |
|
|
|
|
|
3.7 |
(0.2) |
4.3 |
38.8 |
1.2 |
(2.0) |
1.9 |
21.8 |
0.1 |
(5.7) |
11.3 |
32.9 |
0.2 |
2.3 |
15.4 |
22.0 |
|
EM refiners |
|
|
|
|
|
|
|
|
|
|
|
|
|
|
|
|
|
|
|
|
|
|
Tupras |
TUPRS TI |
TRY |
125.8 |
6,085 |
144.2 |
93.1 |
2.5 |
-5.1 |
5.9 |
3.1 |
0.0 |
-6.8 |
3.6 |
-9.7 |
-1.1 |
-10.5 |
13.0 |
1.5 |
-1.0 |
-2.5 |
17.1 |
-9.5 |
MOL |
MOL HB |
HUF |
3,178.0 |
7,835 |
3,190.0 |
2,488.0 |
1.0 |
5.7 |
10.7 |
5.8 |
-1.5 |
3.9 |
8.5 |
-7.4 |
-2.6 |
0.2 |
17.8 |
3.8 |
-2.5 |
8.2 |
22.0 |
-7.2 |
PKN ORLEN |
PKN PW |
PLN |
112.9 |
12,802 |
116.4 |
80.2 |
10.5 |
22.3 |
14.9 |
1.9 |
8.0 |
20.3 |
12.7 |
-10.8 |
6.9 |
16.7 |
22.0 |
0.4 |
7.0 |
24.6 |
26.2 |
-10.6 |
Grupa LOTOS |
LTS PW |
PLN |
81.2 |
3,984 |
81.4 |
51.6 |
6.2 |
17.3 |
16.2 |
44.3 |
3.8 |
15.3 |
14.1 |
26.4 |
2.7 |
11.6 |
23.4 |
37.6 |
2.8 |
19.6 |
27.6 |
26.6 |
OMV Petrom |
SNP RE |
RON |
0.4 |
5,060 |
0.4 |
0.3 |
1.9 |
-4.6 |
13.3 |
29.4 |
-0.5 |
-6.3 |
11.1 |
13.4 |
-1.6 |
-10.0 |
20.4 |
24.6 |
-1.5 |
-2.1 |
24.6 |
13.6 |
Petkim |
PETKM TI |
TRY |
5.3 |
1,702 |
7.8 |
3.8 |
2.5 |
5.3 |
-2.9 |
-9.7 |
0.1 |
3.5 |
-5.3 |
-21.0 |
-1.0 |
-0.2 |
4.0 |
-9.8 |
-0.9 |
7.8 |
8.2 |
-20.8 |
Cap-weighted average |
|
|
|
|
|
|
5.2 |
9.5 |
11.7 |
10.6 |
2.8 |
7.6 |
9.4 |
(3.2) |
1.7 |
3.9 |
18.8 |
8.1 |
1.8 |
11.9 |
23.0 |
(3.0) |
RTS Index |
|
|
|
|
|
|
1.9 |
0.7 |
3.9 |
0.3 |
|
|
|
|
|
|
|
|
|
|
|
|
MSCI EM Index |
|
|
|
|
|
|
3.0 |
4.4 |
(5.5) |
(11.0) |
|
|
|
|
|
|
|
|
|
|
|
|
Bloomberg World Oil & Gas Index |
|
|
|
|
|
2.9 |
(3.5) |
(9.7) |
0.1 |
|
|
|
|
|
|
|
|
|
|
|
|
|
Source: Company data, Bloomberg, Renaissance Capital
10