

vk.com/id446425943 |
|
Russia |
|
Energy: Integrated Oil & Gas |
|
13 November 2018 |
Change of Recommendation |
|
|
|
Oil Sector |
|
Oil price fall |
Equities
Russian oil stocks have thus far been resilient amid the 20% drop in Dated Brent, but we believe that the safety cushion in these stocks’ valuations has now been exhausted and do not anticipate them resisting further oil price pressure. Our ‘inside out’ approach does not raise an ‘undervaluation’ flag for the oil industry in general, or for any specific stocks in particular. Incorporating the current futures curve into our standard DCF-based valuation framework results in decreases of 7-23% to our 12-month Target Prices, and recommendation downgrades for Gazprom Neft and Lukoil (from Buy to Hold), and for Tatneft ords (from Hold to Sell).
In our Russian Oils Upstream – The Metamorphoses. Rise of Titans, of 5 October, we argued that Russian oil companies were seriously undervalued relative to the prevailing macro environment and the structural changes that have happened in the Russian oil industry this year (the significant increase in the sensitivity of the segment to oil prices). Despite the 20% drop in oil prices, Russian oil stocks have proven surprisingly resilient to this commodity price pressure. Most Russian oil stocks have outperformed the broad RTS index (with Rosneft an exception (-6.8%)) and some stocks have bucked the declining trend (Lukoil +2.1%, Tatneft +0.3%).
However, we believe that the cushion of the undervaluation has been exhausted and this resilience has its limits. As our ‘inside-out’ approach argues (see the aforementioned report), the undervaluation of the segment was factored by the increased value of tax breaks in the overall segment valuation and large sensitivity of the tax breaks to oil prices. This combination results in an unusual ‘discrepancy’ phenomenon, with Russian oil companies trading below the value of the tax breaks provided. Historically, all dislocations of this nature had been resolved on a one quarter horizon, either through an increase in stock prices, or though the decline in oil prices.
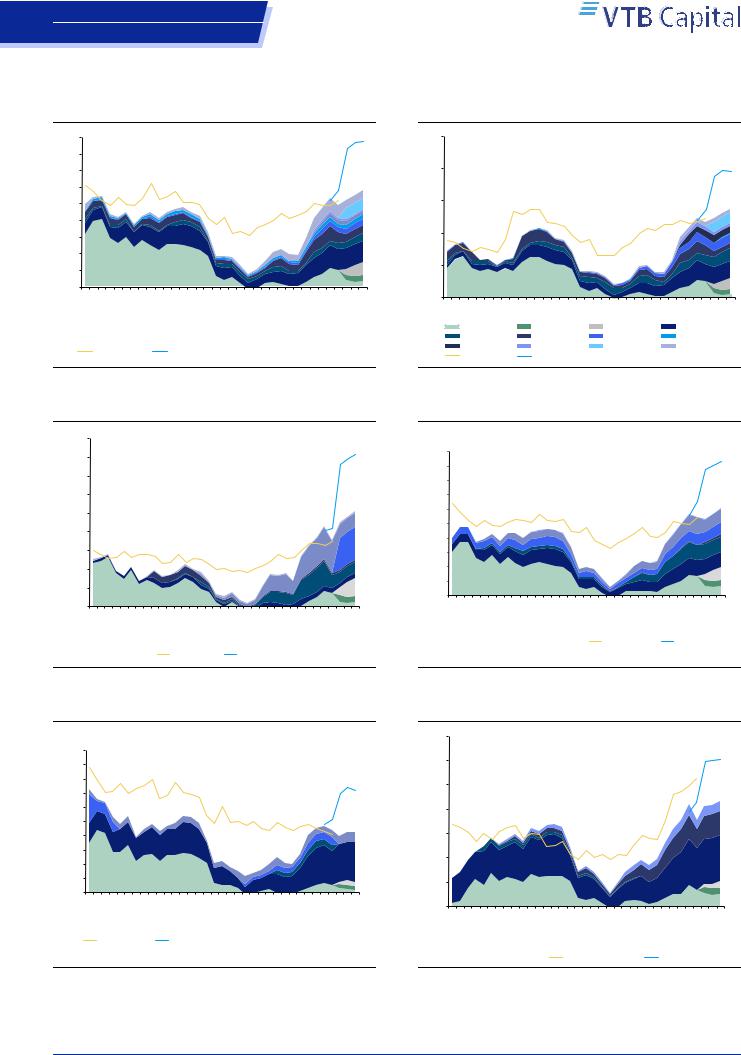
This time, the ‘discrepancy’ has been ‘resolved’ through the 20% decline in oil prices and associated drop in the value of taxes (by USD 148bn on the industry level in 2019 at prevailing prices; see the graphs below). As a result, neither the Russian oil industry in general, nor any specific oil stocks, flag as ‘undervalued’ according to our ‘inside out’ approach.
Following our long-standing cautious view on oil prices, we adjust our oil price forecast to the prevailing futures curve (reducing it additionally by USD 5/bbl to USD 1/bbl for the next five quarters). As a result, we reduce our 12-month Target Prices for Russian oils 7-23%, and downgrade Gazprom Neft and Lukoil (from Buy to Hold), and Tatneft (from Hold to Sell). Oil price movements remain the main risk to our recommendations.
Dmitry Loukashov, CFA, Equities Analyst
+7 495 663 46 34 // dmitry.loukashov@vtbcapital.com
Ekaterina Rodina, Equities Analyst
+7 495 663 47 33 // ekaterina.rodina@vtbcapital.com
Alexander Donskoy, Equities Analyst
+7 495 660 67 88 // alexander.donskoy@vtbcapital.com
Artur Muradyants, Equity analyst
+7 495 663 46 38 // artur.muradyants@vtbcapital.com
Aydar Safin, Equities Analyst
+7 495 663 46 32 // aydar.safin@vtbcapital.com
Prices cited in the body of this report are as of the last close before, or the close on, 09 Nov 2018 (except where indicated otherwise). VTB Capital analysts update their recommendations periodically as required.
Please refer to the Disclosures section of this report for other important disclosures, including the analyst certification and information as required by EU-MAR. Additional disclosures regarding the subject company(ies) discussed in this report can be found at http://research.vtbcapital.com/ServicePages/Disclosures.aspx.

vk.com/id446425943 |
Oil Sector |
|
|
|
|
|
||
|
Russia |
|
|
|
|
|
|
|
|
Energy: Integrated Oil & Gas |
|
|
|
|
|
|
|
|
Companies Stocks mentioned |
|
|
|
|
|
|
|
|
Stock |
Rec. |
Previous |
Target Price |
Last Price |
ETR |
Upside |
DY, next 12mo |
|
Tatneft DRs (ATAD LI,USD) |
Sell(from Hold) |
Hold (19 Feb 2018, |
66.00 |
72.00 (09 Nov 2018, |
-2% |
-8% |
6% |
|
|
|
05:02 UTC ) |
|
close) |
|
|
|
|
Gazprom Neft DRs (GAZ |
Hold(from Buy) |
Buy (8 Oct 2018, 06:10 |
30.50 |
27.90 (09 Nov 2018, |
18% |
9% |
9% |
|
LI,USD) |
|
UTC ) |
|
close) |
|
|
|
|
Lukoil DRs (LKOD LI,USD) |
Hold(from Buy) |
Buy (12 Jan 2018, |
85.00 |
75.40 (09 Nov 2018, |
17% |
13% |
5% |
|
|
|
13:01 UTC ) |
|
close) |
|
|
|
|
Lukoil ords (LKOH RX,USD) |
Hold(from Buy) |
Buy (12 Jan 2018, |
85.00 |
74.97 (09 Nov 2018, |
18% |
13% |
5% |
|
|
|
13:01 UTC ) |
|
close) |
|
|
|
|
Surgutneftegas DRs (SGGD |
Hold(8 Oct 2018, |
Sell (19 Feb 2018, |
4.20 |
3.97 (09 Nov 2018, |
8% |
6% |
2% |
|
LI,USD) |
06:10 UTC) |
05:02 UTC) |
|
close) |
|
|
|
|
Gazprom Neft ords (SIBN |
Hold(from Buy) |
Buy (8 Oct 2018, 06:10 |
6.10 |
5.55 (09 Nov 2018, |
19% |
10% |
9% |
|
RX,USD) |
|
UTC ) |
|
close) |
|
|
|
|
Surgutneftegas ords (SNGS |
Hold(8 Oct 2018, |
Sell (19 Feb 2018, |
0.42 |
0.40 (09 Nov 2018, |
7% |
4% |
2% |
|
RX,USD) |
06:10 UTC) |
05:02 UTC) |
|
close) |
|
|
|
|
Surgutneftegas prefs |
Buy(23 Mar 2017, |
Hold (12 Oct 2015, |
0.69 |
0.56 (09 Nov 2018, |
39% |
22% |
17% |
|
(SNGSP RX,USD) |
12:03 UTC) |
06:10 UTC) |
|
close) |
|
|
|
|
Tatneft ords (TATN |
Sell(from Hold) |
Hold (19 Feb 2018, |
11.00 |
11.97 (09 Nov 2018, |
-2% |
-8% |
6% |
|
RX,USD) |
|
05:02 UTC ) |
|
close) |
|
|
|
|
Tatneft prefs (TATNP |
Buy(30 Mar 2018, |
Hold (7 Nov 2017, 15:11 |
12.80 |
8.14 (09 Nov 2018, |
67% |
57% |
10% |
|
RX,USD) |
06:03 UTC) |
UTC) |
|
close) |
|
|
|
13 November 2018 |
2 |
vk.com/id446425943 |
Oil Sector |
Russia |
|
Energy: Integrated Oil & Gas |
|
|
‘Inside out’ approach |
Figure 1: Industry
450 |
|
|
|
|
|
|
|
|
400 |
|
|
|
|
|
|
|
|
350 |
|
|
|
|
|
|
|
|
300 |
|
|
|
|
|
|
|
|
bn250 |
|
|
|
|
|
|
||
USD200 |
|
|
|
|
|
|
||
150 |
|
|
|
|
|
|
|
|
100 |
|
|
|
|
|
|
|
|
50 |
|
|
|
|
|
|
|
|
0 |
1Q11 2Q11 3Q11 4Q11 1Q12 2Q12 3Q12 4Q12 1Q13 2Q13 3Q13 4Q13 1Q14 2Q14 3Q14 4Q14 1Q15 2Q15 3Q15 4Q15 1Q16 2Q16 3Q16 4Q16 1Q17 2Q17 3Q17 4Q17 1Q18 2Q18 3Q18F 4Q18F 1Q19F 2Q19F 3Q19F |
|||||||
|
||||||||
|
|
Downstream relief |
|
Negative excise |
|
Floating excise |
|
Depletion relief |
|
|
Other |
|
Regional relief |
|
Permeability relief |
|
Viscosity relief |
|
|
|
|
|
||||
|
|
Tuymen |
|
Samotlor |
|
EPT |
|
Export duty relief |
|
|
|
|
|
||||
|
|
Mcap + ND |
|
Previous forecast |
|
|
|
|
Source: Company data, VTB Capital Research
Figure 2: Rosneft
250 |
|
|
|
|
|
|
|
|
|
|
|
|
|
|
|
|
|
|
|
|
|
|
|
|
|
|
|
|
|
|
|
|
|
|
200 |
|
|
|
|
|
|
|
|
|
|
|
|
|
|
|
|
|
|
|
|
|
|
|
|
|
|
|
|
|
|
|
|
|
|
150 |
|
|
|
|
|
|
|
|
|
|
|
|
|
|
|
|
|
|
|
|
|
|
|
|
|
|
|
|
|
|
|
|
|
|
USD bn |
|
|
|
|
|
|
|
|
|
|
|
|
|
|
|
|
|
|
|
|
|
|
|
|
|
|
|
|
|
|
|
|
|
|
100 |
|
|
|
|
|
|
|
|
|
|
|
|
|
|
|
|
|
|
|
|
|
|
|
|
|
|
|
|
|
|
|
|
|
|
50 |
|
|
|
|
|
|
|
|
|
|
|
|
|
|
|
|
|
|
|
|
|
|
|
|
|
|
|
|
|
|
|
|
|
|
0 |
|
|
|
|
|
|
|
|
|
|
|
|
|
|
|
|
|
|
|
|
|
|
|
|
|
|
|
|
|
3Q18F |
4Q18F |
1Q19F |
2Q19F |
3Q19F |
1Q11 |
2Q11 |
3Q11 |
4Q11 |
1Q12 |
2Q12 |
3Q12 |
4Q12 |
1Q13 |
2Q13 |
3Q13 |
4Q13 |
1Q14 |
2Q14 |
3Q14 |
4Q14 |
1Q15 |
2Q15 |
3Q15 |
4Q15 |
1Q16 |
2Q16 |
3Q16 |
4Q16 |
1Q17 |
2Q17 |
3Q17 |
4Q17 |
1Q18 |
2Q18 |
|||||
|
|
Downstream relief |
|
Negative excise |
|
|
Floating excise |
|
|
|
Depletion relief |
|
||||||||||||||||||||||
|
|
Other |
|
|
|
|
|
Regional relief |
|
|
|
Permeability relief |
|
|
Viscosity relief |
|
|
|||||||||||||||||
|
|
Tuymen |
|
|
|
|
|
Samotlor |
|
|
|
|
|
EPT |
|
|
|
|
|
|
|
Export duty relief |
|
|||||||||||
|
|
Mcap + ND |
|
|
|
|
Previous forecast |
|
|
|
|
|
|
|
|
|
|
|
|
|
|
|
|
|
|
|||||||||
Source: Company data, VTB Capital Research
Figure 3: Gazprom Neft
|
90 |
|
|
80 |
|
|
70 |
|
|
60 |
|
USD bn |
50 |
|
40 |
||
|
||
|
30 |
|
|
20 |
|
|
10 |
|
|
0 |
1Q11 |
2Q11 |
3Q11 |
4Q11 |
1Q12 |
2Q12 |
3Q12 |
4Q12 |
1Q13 |
2Q13 |
3Q13 |
4Q13 |
1Q14 |
2Q14 |
3Q14 |
4Q14 |
1Q15 |
2Q15 |
3Q15 |
4Q15 |
1Q16 |
2Q16 |
3Q16 |
4Q16 |
1Q17 |
2Q17 |
3Q17 |
4Q17 |
1Q18 |
2Q18 |
3Q18F |
4Q18F |
1Q19F |
2Q19F |
3Q19F |
||||
|
|
Downstream relief |
|
|
Negative excise |
|
|
|
|
Floating excise |
|
|
|
|
Depletion relief |
|
||||||||||||||||||||||
|
|
|
|
|
|
|
|
|
|
|
|
|
||||||||||||||||||||||||||
|
|
Regional relief |
|
|
|
|
Permeability relief |
|
|
|
|
EPT |
|
|
|
|
|
|
|
|
Export duty relief |
|
||||||||||||||||
|
|
|
|
|
|
|
|
|
|
|
|
|
|
|
|
|
|
|
||||||||||||||||||||
|
|
Other |
|
|
|
|
|
|
|
Mcap + ND |
|
|
|
|
|
|
Previous forecast |
|
|
|
|
|
|
|
|
|
|
|||||||||||
|
|
|
|
|
|
|
|
|
|
|
|
|
|
|
|
|
|
|
|
|
|
|
|
|
||||||||||||||
Source: Company data, VTB Capital Research
Figure 4: Lukoil
|
100 |
|
|
90 |
|
|
80 |
|
|
70 |
|
bn |
60 |
|
50 |
||
USD |
||
40 |
||
|
||
|
30 |
|
|
20 |
|
|
10 |
|
|
0 |
1Q11 |
2Q11 |
3Q11 |
4Q11 |
1Q12 |
2Q12 |
3Q12 |
4Q12 |
1Q13 |
2Q13 |
3Q13 |
4Q13 |
1Q14 |
2Q14 |
3Q14 |
4Q14 |
1Q15 |
2Q15 |
3Q15 |
4Q15 |
1Q16 |
2Q16 |
3Q16 |
4Q16 |
1Q17 |
2Q17 |
3Q17 |
4Q17 |
1Q18 |
2Q18 |
3Q18F |
4Q18F |
1Q19F |
2Q19F |
3Q19F |
||||
|
Downstream relief |
|
|
|
Negative excise |
|
|
|
|
|
Floating excise |
|
|
|
|
Depletion relief |
|
|||||||||||||||||||||
|
Regional relief |
|
|
|
|
|
Permeability relief |
|
|
|
|
Viscosity relief |
|
|
|
|
EPT |
|
|
|
|
|||||||||||||||||
|
|
|
|
|
|
|
|
|
|
|
|
|
|
|
|
|
|
|||||||||||||||||||||
|
Export duty relief |
|
|
|
|
Other |
|
|
|
|
|
|
|
|
Mcap + ND |
|
|
|
|
|
Previous forecast |
|||||||||||||||||
|
|
|
|
|
|
|
|
|
|
|
|
|
|
|
|
|
|
|||||||||||||||||||||
Source: Company data, VTB Capital Research
Figure 5: Surgutneftegas
|
50 |
|
|
45 |
|
|
40 |
|
|
35 |
|
bn |
30 |
|
25 |
||
USD |
||
20 |
||
|
||
|
15 |
|
|
10 |
|
|
5 |
|
|
0 |
1Q11 |
2Q11 |
3Q11 |
4Q11 |
1Q12 |
2Q12 |
3Q12 |
4Q12 |
1Q13 |
2Q13 |
3Q13 |
4Q13 |
1Q14 |
2Q14 |
3Q14 |
4Q14 |
1Q15 |
2Q15 |
3Q15 |
4Q15 |
1Q16 |
2Q16 |
3Q16 |
4Q16 |
1Q17 |
2Q17 |
3Q17 |
4Q17 |
1Q18 |
2Q18 |
3Q18F |
4Q18F |
1Q19F |
2Q19F |
3Q19F |
|||||
|
|
Downstream relief |
|
|
|
|
Negative excise |
|
|
|
|
Floating excise |
|
|
|
|
|
Depletion relief |
|||||||||||||||||||||
|
|
Regional relief |
|
|
|
|
|
EPT |
|
|
|
|
|
|
|
|
Export duty relief |
|
|
|
|
|
Other |
|
|
|
|||||||||||||
|
|
|
|
|
|
|
|
|
|
|
|
|
|
|
|
|
|
|
|
|
|
|
|||||||||||||||||
|
|
Mcap + ND |
|
|
|
|
|
|
Previous forecast |
|
|
|
|
|
|
|
|
|
|
|
|
|
|
|
|
|
|
|
|
|
|||||||||
Source: Company data, VTB Capital Research
Figure 6: Tatneft
|
35 |
|
|
30 |
|
|
25 |
|
USD mn |
20 |
|
15 |
||
|
||
|
10 |
|
|
5 |
|
|
0 |
1Q11 2Q11 3Q11 4Q11 1Q12 2Q12 3Q12 4Q12 1Q13 2Q13 3Q13 4Q13 1Q14 2Q14 3Q14 4Q14 1Q15 2Q15 3Q15 4Q15 1Q16 2Q16 3Q16 4Q16 1Q17 2Q17 3Q17 4Q17 1Q18 2Q18 3Q18F 4Q18F 1Q19F 2Q19F 3Q19F |
||||||
|
|
Downstream relief |
|
Negative excise |
|
Floating excise |
|
|
Depletion relief |
|
60-66 |
|
Viscosity relief |
|
|
Export duty relief |
|
Mcap + ND |
|
Previous forecast |
|
|
|
|
|||
Source: Company data, VTB Capital Research
13 November 2018 |
3 |

vk.com/id446425943
Russia
Energy: Integrated Oil & Gas
VTB Capital Facts & Forecasts
Russia
Energy / Integrated Oil & Gas
Gazprom Neft
Prices as of: 9 November 2018
Ticker |
CCY |
Current |
12mo TP |
Rating |
SIBN RX |
USD |
5.55 |
6.10 |
Hold |
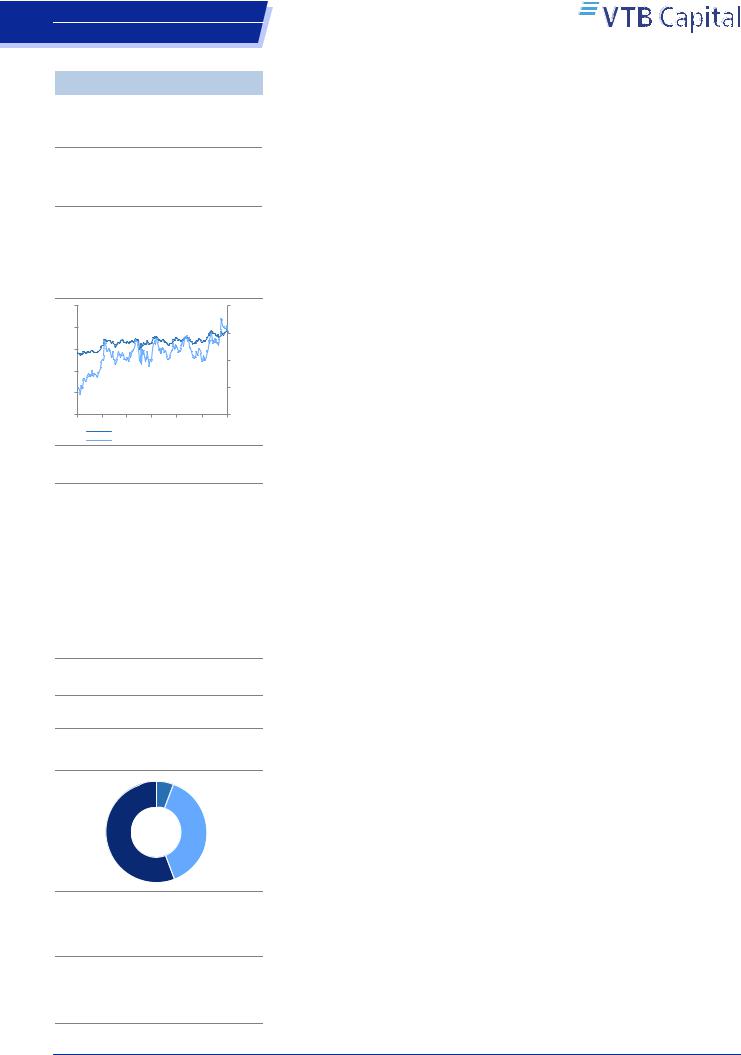
Share price performance, 12-mo
8 |
30% |
6 |
20% |
4 |
10% |
2 |
0% |
0 |
-10% |
Nov Jan Mar May Jul Sep Nov
SIBN RX, USD, lhs
Relative to MOEX Index, %, rhs
Company description
Gazprom Neft's proved reserves exceed 11,218mmboe, which makes it one of the world's largest oil companies. The main upstream assets are located in Western Siberia, with the Priobskoye field being the jewel in its portfolio. In 2016, the company (excluding joint ventures) produced 45.8mmt of liquids, a YoY increase of 8.1%. The main drivers of the ramp up were the Novoportovskoye and Prirazlomnoye greenfields, which together produced 5mmt of liquids last year. The company's main oil processing asset, the 21.6mmt/a Omsk Oil Refinery, is one of the most advanced oil refineries in Russia. In 2016, Gazprom Neft refined 41.9mmt of crude oil, down 3% on the year before.
Company website
http://www.gazprom-neft.com/
Shareholder structure
Free float 4%
Gazprom
96%
Source: Company data, VTB Capital Research
Research team
Dmitry Loukashov, CFA / +7 495 663 46 34
Ekaterina Rodina / +7 495 663 47 33
Alexander Donskoy / +7 495 660 67 88
Aydar Safin / +7 495 663 46 32
Artur Muradyants / +7 495 663 46 38
Oil Sector
Last model update on: 12 November 2018
|
IFRS |
2016 |
2017 |
2018F |
2019F |
2020F |
|
2021F |
|
|
Company data |
|
|
|
|
|
|
|
|
|
Weighted avg # shares, mn |
4,718 |
4,718 |
4,718 |
4,718 |
4,718 |
|
4,718 |
|
|
Avg market cap, USD mn |
11,847 |
17,587 |
26,303 |
26,303 |
26,303 |
|
26,303 |
|
|
EV, USD mn |
21,750 |
27,646 |
34,900 |
33,639 |
31,613 |
|
30,205 |
|
|
Ratios & analysis |
|
|
|
|
|
|
|
|
|
P/E, x |
4.0x |
4.1x |
4.2x |
3.5x |
3.1x |
|
3.3x |
|
|
EV/EBITDA, x |
4.0x |
3.6x |
3.3x |
3.0x |
2.6x |
|
2.7x |
|
|
P/B, x |
0.5x |
0.6x |
0.7x |
0.6x |
0.5x |
|
0.5x |
|
|
FCF yield, % |
-7.9% |
6.5% |
9.9% |
12.7% |
17.7% |
|
16.7% |
|
|
Dividend yield (ords), % |
7.3% |
6.4% |
7.9% |
10.0% |
11.4% |
|
10.4% |
|
|
Dividend yield (prefs), % |
|
|
|
|
|
|
|
|
|
EPS(ords), USD |
0.63 |
0.92 |
1.32 |
1.59 |
1.81 |
|
1.66 |
|
|
CFPS, USD |
1.02 |
1.53 |
1.79 |
1.96 |
2.12 |
1.95 |
|
|
|
Free CFPS, USD |
(0.20) |
0.24 |
0.55 |
0.70 |
0.98 |
0.93 |
|
|
|
DPS (ords), USD |
0.18 |
0.24 |
0.44 |
0.55 |
0.63 |
0.58 |
|
|
|
Payout ratio (ords), % |
28.9% |
26.0% |
33.2% |
34.8% |
34.8% |
34.8% |
|
|
|
BPS(ords), USD |
5.05 |
6.11 |
7.66 |
9.19 |
10.75 |
12.07 |
|
|
|
Revenues growth, % |
-7% |
36% |
21% |
-2% |
5% |
-2% |
|
|
|
EBITDA, chg |
9% |
38% |
37% |
7% |
9% |
-7% |
|
|
|
EPS growth, % |
66% |
45% |
43% |
21% |
14% |
-8% |
|
|
|
EBIT margin, % |
14% |
15% |
18% |
20% |
22% |
21% |
|
|
|
EBITDA margin, % |
21.7% |
22.1% |
24.9% |
27.2% |
28.3% |
|
26.9% |
|
|
Net margin, % |
11.8% |
12.6% |
14.9% |
18.3% |
19.9% |
18.7% |
|
|
|
ROE, % |
13.3% |
16.1% |
18.3% |
18.4% |
18.0% |
|
14.7% |
|
|
ROIC, % |
7.1% |
9.0% |
11.4% |
11.7% |
12.6% |
10.8% |
|
|
|
Capex/Revenues, % |
23% |
18% |
14% |
14% |
13% |
11% |
|
|
|
Capex/Depreciation, x |
3.0x |
2.5x |
2.1x |
2.0x |
2.1x |
|
2.0x |
|
|
Net debt/Equity, % |
42% |
35% |
24% |
17% |
10% |
7% |
|
|
|
Net debt/EBITDA, x |
1.8x |
1.3x |
0.8x |
0.7x |
0.4x |
|
0.3x |
|
|
Net interest cover, x |
|
|
|
|
|
|
|
|
|
Income statement summary, USD mn |
|
|
|
|
|
|
|
|
|
Revenues |
25,286 |
34,336 |
41,642 |
41,000 |
42,862 |
41,856 |
|
|
|
Cost of sales |
(18,153) |
(24,891) |
(29,361) |
(28,024) |
(28,876) |
(28,724) |
|
|
|
SG&A and other opexp. |
(1,643) |
(1,844) |
(1,900) |
(1,828) |
(1,872) |
(1,874) |
|
|
|
EBITDA |
5,490 |
7,601 |
10,381 |
11,148 |
12,114 |
11,258 |
|
|
|
Depreciation & amortization |
(1,936) |
(2,416) |
(2,822) |
(2,964) |
(2,623) |
(2,429) |
|
|
|
Operating profit |
3,554 |
5,184 |
7,559 |
8,184 |
9,491 |
8,829 |
|
|
|
Non-operating gains /(exp.) |
154 |
(134) |
(610) |
(69) |
(77) |
(142) |
|
|
|
EBIT |
3,554 |
5,184 |
7,559 |
8,184 |
9,491 |
8,829 |
|
|
|
Net interest income/(exp.) |
(346) |
(258) |
(266) |
(190) |
(223) |
|
(223) |
|
|
Profit before tax |
3,870 |
5,573 |
8,132 |
9,374 |
10,640 |
|
9,913 |
|
|
Income tax |
(743) |
(951) |
(1,520) |
(1,402) |
(1,550) |
|
(1,563) |
|
|
Minority interests |
(142) |
(281) |
(402) |
(485) |
(553) |
(508) |
|
|
|
Net income |
2,985 |
4,340 |
6,210 |
7,487 |
8,537 |
7,842 |
|
|
|
Cash flow statement summary, USD mn |
|
|
|
|
|
|
|
|
|
Cash flow from operations |
4,791 |
7,227 |
8,459 |
9,261 |
10,011 |
|
9,187 |
|
|
Working capital changes |
227 |
905 |
- |
- |
- |
|
- |
|
|
Capex |
(5,738) |
(6,120) |
(5,869) |
(5,941) |
(5,378) |
|
(4,806) |
|
|
Other investing activities |
924 |
854 |
- |
- |
- |
- |
|
|
|
Free cash flow |
(932) |
1,145 |
2,590 |
3,320 |
4,633 |
4,381 |
|
|
|
Dividends paid |
(57) |
(907) |
(1,129) |
(2,060) |
(2,607) |
(2,973) |
|
|
|
Net change in borrowings |
(953) |
61 |
|
|
|
|
|
|
|
Other financing cash flow |
(10) |
(20) |
|
|
|
|
|
|
|
Movement in cash |
(1,201) |
977 |
1,461 |
1,261 |
2,026 |
1,408 |
|
|
|
Balance sheet summary, USD mn |
|
|
|
|
|
|
|
|
|
Cash and equivalents |
554 |
1,573 |
3,034 |
4,295 |
6,321 |
7,729 |
|
|
|
PP&E |
28,461 |
35,630 |
41,499 |
47,440 |
52,818 |
57,624 |
|
|
|
Goodwill |
1,157 |
1,288 |
1,288 |
1,288 |
1,288 |
1,288 |
|
|
|
Investments |
694 |
181 |
181 |
181 |
181 |
181 |
|
|
|
Other assets |
11,154 |
12,196 |
12,196 |
12,196 |
12,196 |
12,196 |
|
|
|
Total assets |
42,020 |
50,868 |
58,198 |
65,400 |
72,804 |
79,018 |
|
|
|
Interest bearing debt |
11,151 |
11,813 |
11,812 |
11,812 |
11,812 |
11,812 |
|
|
|
Other liabilities |
7,060 |
10,251 |
10,252 |
10,252 |
10,252 |
10,252 |
|
|
|
Total liabilities |
18,211 |
22,064 |
22,064 |
22,064 |
22,064 |
|
22,064 |
|
|
Total shareholder's equity |
22,424 |
26,966 |
33,894 |
40,611 |
47,462 |
53,168 |
|
|
|
Minority interest |
1,385 |
1,838 |
2,240 |
2,725 |
3,278 |
3,786 |
|
|
|
Net working capital |
1,989 |
454 |
453 |
453 |
453 |
453 |
|
|
|
Net Debt |
9,903 |
10,058 |
8,597 |
7,336 |
5,310 |
3,902 |
|
|
|
Capital |
33,575 |
38,779 |
45,706 |
52,423 |
59,274 |
64,980 |
|
|
|
|
|
|
|
|
|
|
|
|
13 November 2018 |
4 |
vk.com/id446425943
Russia
Energy: Integrated Oil & Gas
VTB Capital Facts & Forecasts
Russia
Energy / Integrated Oil & Gas
Lukoil
Prices as of: 9 November 2018
Ticker |
CCY |
Current |
12mo TP |
Rating |
LKOH RX |
USD |
74.97 |
85.00 |
Hold |
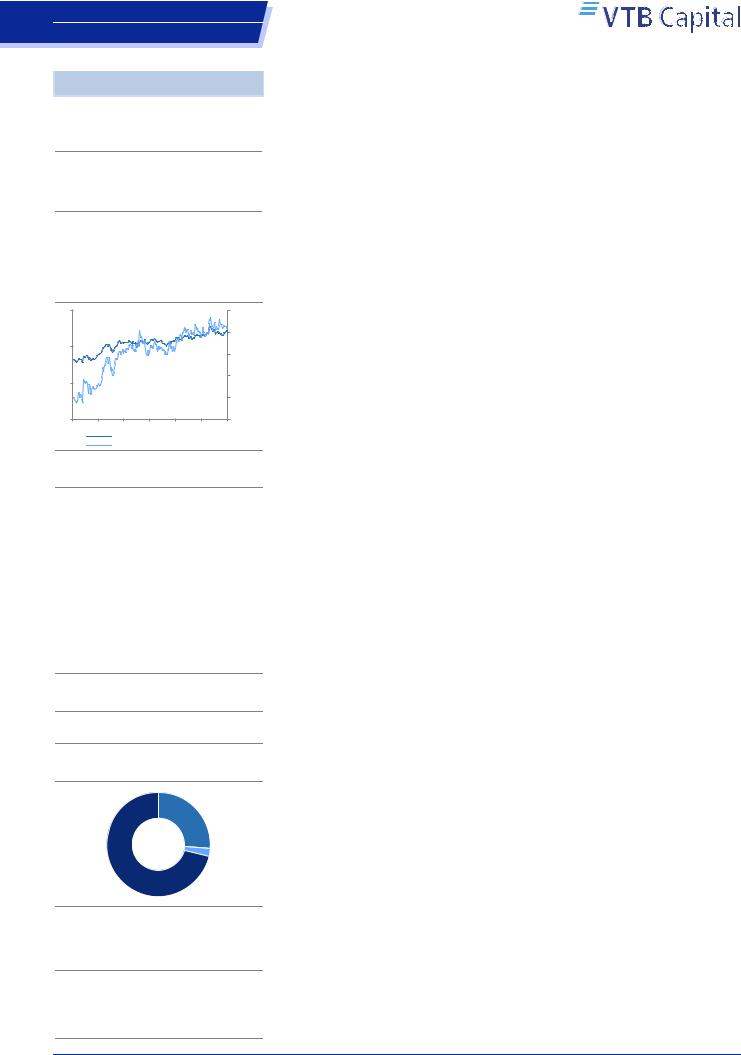
Share price performance, 12-mo
100 |
30% |
80 |
20% |
|
|
60 |
|
|
10% |
40 |
|
20 |
0% |
|
|
0 |
-10% |
Nov Jan Mar May Jul Sep Nov
LKOH RX, USD, lhs
Relative to MOEX Index, %, rhs
Company description
Lukoil is Russia's largest non-state-owned integrated oil and gas company, and it is likely the most diversified company in the Russian oils universe. Its active operations range from pure exploration (which not all Russian companies are engaged in) to the sale of complementary goods at filling stations and the distribution of LPG through the company's retail network. In 2016, Lukoil produced 84.8mmt (down 5% YoY) of crude oil (including oil produced within international projects) which makes it the second largest oil producer in Russia. Refining occurs in Russia (in the Central region and TimanoPechora) and abroad (Romania, Bulgaria, Italy and the Netherlands). Total refining in 2016 was 73.8mmt (up 11% YoY).
Company website
http://www.lukoil.com/
Shareholder structure
Other/Free |
Treasury |
float |
shares |
56% |
5% |
Management of the company 39%
Source: Company data, VTB Capital Research
Research team
Dmitry Loukashov, CFA / +7 495 663 46 34
Ekaterina Rodina / +7 495 663 47 33
Alexander Donskoy / +7 495 660 67 88
Aydar Safin / +7 495 663 46 32
Artur Muradyants / +7 495 663 46 38
Oil Sector
Last model update on: 12 November 2018
|
IFRS |
2016 |
2017 |
2018F |
2019F |
2020F |
|
2021F |
|
|
Company data |
|
|
|
|
|
|
|
|
|
Weighted avg # shares, mn |
850.6 |
850.6 |
750.6 |
750.6 |
750.6 |
|
750.6 |
|
|
Avg market cap, USD mn |
30,536 |
37,177 |
53,199 |
53,199 |
53,199 |
|
53,199 |
|
|
EV, USD mn |
37,465 |
41,802 |
53,141 |
48,665 |
43,836 |
|
40,205 |
|
|
Ratios & analysis |
|
|
|
|
|
|
|
|
|
P/E, x |
11.8x |
6.2x |
5.0x |
5.6x |
5.4x |
|
6.1x |
|
|
EV/EBITDA, x |
4.0x |
3.4x |
2.9x |
2.9x |
2.6x |
|
2.5x |
|
|
P/B, x |
0.7x |
0.7x |
0.8x |
0.7x |
0.6x |
|
0.5x |
|
|
FCF yield, % |
10.5% |
9.6% |
14.4% |
13.5% |
13.9% |
|
11.9% |
|
|
Dividend yield (ords), % |
7.8% |
6.6% |
4.7% |
4.8% |
4.9% |
|
5.1% |
|
|
Dividend yield (prefs), % |
|
|
|
|
|
|
|
|
|
EPS(ords), USD |
3.63 |
8.44 |
14.85 |
13.36 |
13.77 |
|
12.33 |
|
|
CFPS, USD |
13.19 |
15.28 |
21.84 |
20.70 |
21.02 |
19.70 |
|
|
|
Free CFPS, USD |
4.51 |
5.01 |
10.79 |
10.09 |
10.41 |
8.90 |
|
|
|
DPS (ords), USD |
3.34 |
3.43 |
3.54 |
3.60 |
3.69 |
3.80 |
|
|
|
Payout ratio (ords), % |
77.3% |
34.0% |
22.5% |
25.5% |
25.3% |
29.1% |
|
|
|
BPS(ords), USD |
62.56 |
71.24 |
98.02 |
114.6 |
131.6 |
147.3 |
|
|
|
Revenues growth, % |
-17% |
31% |
23% |
-9% |
2% |
-4% |
|
|
|
EBITDA, chg |
-19% |
31% |
36% |
-7% |
2% |
-6% |
|
|
|
EPS growth, % |
-35% |
133% |
76% |
-10% |
3% |
-10% |
|
|
|
EBIT margin, % |
8% |
9% |
11% |
11% |
11% |
11% |
|
|
|
EBITDA margin, % |
14.0% |
14.0% |
15.5% |
15.8% |
15.9% |
|
15.6% |
|
|
Net margin, % |
4.0% |
7.1% |
8.9% |
8.8% |
8.9% |
8.3% |
|
|
|
ROE, % |
5.8% |
11.9% |
15.2% |
11.7% |
10.5% |
|
8.4% |
|
|
ROIC, % |
7.0% |
8.5% |
12.0% |
10.1% |
9.5% |
7.9% |
|
|
|
Capex/Revenues, % |
10% |
9% |
7% |
7% |
7% |
7% |
|
|
|
Capex/Depreciation, x |
1.6x |
1.6x |
1.5x |
1.5x |
1.4x |
|
1.5x |
|
|
Net debt/Equity, % |
13% |
8% |
0% |
-5% |
-9% |
-12% |
|
|
|
Net debt/EBITDA, x |
0.6x |
0.3x |
0.0x |
(0.3x) |
(0.5x) |
|
(0.8x) |
|
|
Net interest cover, x |
8.9x |
18.5x |
27.4x |
28.2x |
45.2x |
|
41.6x |
|
|
Income statement summary, USD mn |
|
|
|
|
|
|
|
|
|
Revenues |
77,941 |
101,739 |
125,002 |
113,689 |
115,482 |
111,103 |
|
|
|
Cost of sales |
(64,120) |
(84,655) |
(102,968) |
(93,150) |
(94,519) |
(91,100) |
|
|
|
SG&A and other opexp. |
(2,925) |
(2,833) |
(2,659) |
(2,589) |
(2,650) |
(2,725) |
|
|
|
EBITDA |
10,896 |
14,251 |
19,375 |
17,950 |
18,313 |
17,278 |
|
|
|
Depreciation & amortization |
(4,646) |
(5,571) |
(5,651) |
(5,474) |
(5,544) |
(5,533) |
|
|
|
Operating profit |
6,250 |
8,680 |
13,724 |
12,476 |
12,769 |
11,745 |
|
|
|
Non-operating gains /(exp.) |
(1,824) |
223 |
227 |
(224) |
(233) |
(322) |
|
|
|
EBIT |
6,250 |
8,680 |
13,724 |
12,476 |
12,769 |
11,745 |
|
|
|
Net interest income/(exp.) |
(481) |
(209) |
(182) |
104 |
305 |
|
305 |
|
|
Profit before tax |
4,063 |
8,983 |
14,096 |
12,657 |
13,138 |
|
12,017 |
|
|
Income tax |
(967) |
(1,778) |
(2,908) |
(2,590) |
(2,764) |
|
(2,723) |
|
|
Minority interests |
(13) |
(28) |
(43) |
(39) |
(40) |
(36) |
|
|
|
Net income |
3,084 |
7,177 |
11,145 |
10,029 |
10,334 |
9,258 |
|
|
|
Cash flow statement summary, USD mn |
|
|
|
|
|
|
|
|
|
Cash flow from operations |
11,217 |
12,998 |
16,389 |
15,540 |
15,775 |
|
14,785 |
|
|
Working capital changes |
749 |
(428) |
|
|
|
|
|
|
|
Capex |
(7,413) |
(8,766) |
(8,287) |
(7,969) |
(7,963) |
|
(8,103) |
|
|
Other investing activities |
(299) |
(112) |
- |
- |
- |
- |
|
|
|
Free cash flow |
3,835 |
4,261 |
8,102 |
7,571 |
7,812 |
6,682 |
|
|
|
Share issue (reacquisition) |
|
(162) |
|
|
|
|
|
|
|
Dividends paid |
(1,949) |
(2,425) |
(2,917) |
(2,653) |
(2,700) |
(2,768) |
|
|
|
Net change in borrowings |
(175) |
(987) |
|
|
|
|
|
|
|
Other financing cash flow |
(755) |
(665) |
(502) |
(442) |
(282) |
(282) |
|
|
|
Movement in cash |
61 |
1,183 |
4,683 |
4,476 |
4,829 |
3,631 |
|
|
|
Balance sheet summary, USD mn |
|
|
|
|
|
|
|
|
|
Cash and equivalents |
4,309 |
5,736 |
10,419 |
14,895 |
19,724 |
23,355 |
|
|
|
PP&E |
55,911 |
62,069 |
70,356 |
78,325 |
86,288 |
94,391 |
|
|
|
Goodwill |
711 |
717 |
717 |
717 |
717 |
717 |
|
|
|
Investments |
2,957 |
3,192 |
3,192 |
3,192 |
3,192 |
3,192 |
|
|
|
Other assets |
18,785 |
19,019 |
19,019 |
19,019 |
19,019 |
19,019 |
|
|
|
Total assets |
82,673 |
90,733 |
103,703 |
116,148 |
128,940 |
140,674 |
|
|
|
Interest bearing debt |
11,517 |
10,701 |
10,701 |
10,701 |
10,701 |
10,701 |
|
|
|
Other liabilities |
17,944 |
19,435 |
19,435 |
19,435 |
19,435 |
|
19,435 |
|
|
Total liabilities |
29,461 |
30,136 |
30,136 |
30,136 |
30,136 |
30,136 |
|
|
|
Total shareholder's equity |
53,100 |
60,468 |
73,395 |
85,801 |
98,553 |
110,251 |
|
|
|
Minority interest |
112 |
129 |
172 |
211 |
251 |
287 |
|
|
|
Net working capital |
3,543 |
4,453 |
4,453 |
4,453 |
4,453 |
4,453 |
|
|
|
Net Debt |
6,929 |
4,625 |
(58) |
(4,534) |
(9,363) |
(12,994) |
|
|
|
Capital |
64,617 |
71,168 |
84,096 |
96,502 |
109,254 |
120,952 |
|
|
|
|
|
|
|
|
|
|
|
|
13 November 2018 |
5 |

vk.com/id446425943 |
Oil Sector |
|
|
Russia |
|
|
Energy: Integrated Oil & Gas |
|
|
|
|
|
|
|
|
|
|
Russia
Energy / Integrated Oil & Gas
Surgutneftegas
Prices as of: 9 November 2018
Ticker |
CCY |
Current |
12mo TP |
Rating |
SNGS RX |
USD |
0.40 |
0.42 |
Hold |
Share price performance, 12-mo
0.6 |
10% |
0.5 |
0% |
|
|
0.4 |
-10% |
|
|
0.3 |
|
0.2 |
-20% |
|
|
0.1 |
-30% |
|
|
0 |
-40% |
Nov Jan Mar May Jul Sep Nov SNGS RX, USD, lhs
Relative to MOEX Index, %, rhs
Company description
In 2016, Surgutneftegas accounted for 11% of Russia's crude output, producing 61.8mmt of oil and 9.8bcm of gas, almost all of it in West Siberia. Surgutneftegas owns the Talakanskoye field in East Siberia and the Shpilman field in West Siberia which, in our view, will partly compensate for declining brownfield production in West Siberia in the coming years. Surgutneftegas also owns the Kirishi Oil Refinery, located in northwest Russia, which has total installed capacity of 20mmt per year.
Company website
http://www.surgutneftegas.ru/en/main/
Shareholder structure
Free float 27%
NCPs incorporated by Surgutneftegas 73%
Source: Company data, VTB Capital Research
Research team
Dmitry Loukashov, CFA / +7 495 663 46 34 Ekaterina Rodina / +7 495 663 47 33 Alexander Donskoy / +7 495 660 67 88 Aydar Safin / +7 495 663 46 32
Artur Muradyants / +7 495 663 46 38
|
IFRS |
2016 |
2017 |
2018F |
2019F |
2020F |
|
2021F |
||
|
Company data |
|
|
|
|
|
|
|
|
|
|
Weighted avg # shares, mn |
|
43,428 |
43,428 |
43,428 |
43,428 |
43,428 |
|
43,428 |
|
|
Avg market cap, USD mn |
21,940 |
21,539 |
18,729 |
18,729 |
18,729 |
18,729 |
|
||
|
EV, USD mn |
13,653 |
6,230 |
1,965 |
755.1 |
neg |
|
neg |
||
|
Ratios & analysis |
|
|
|
|
|
|
|
|
|
|
P/E, x |
neg |
6.4x |
1.5x |
2.4x |
2.5x |
|
2.5x |
||
|
EV/EBITDA, x |
2.6x |
1.0x |
0.1x |
neg |
neg |
|
neg |
||
|
P/B, x |
|
0.4x |
0.3x |
0.3x |
0.2x |
0.2x |
|
0.2x |
|
|
FCF yield, % |
5.7% |
15.8% |
11.4% |
13.2% |
12.5% |
11.4% |
|
||
|
Dividend yield (ords), % |
2.1% |
2.1% |
2.4% |
2.2% |
2.2% |
2.1% |
|
||
|
Dividend yield (prefs), % |
1.9% |
4.2% |
17.5% |
10.7% |
10.3% |
10.2% |
|
||
|
EPS(ords), USD |
(0.021) |
0.077 |
0.28 |
0.17 |
0.16 |
0.16 |
|
||
|
CFPS, USD |
0.090 |
0.14 |
0.13 |
0.13 |
0.12 |
0.12 |
|
||
|
Free CFPS, USD |
0.028 |
0.078 |
0.046 |
0.053 |
0.050 |
0.046 |
|
||
|
DPS (ords), USD |
0.010 |
0.010 |
0.0096 |
0.0088 |
0.0087 |
0.0084 |
|
||
|
DPS (prefs) |
0.010 |
0.022 |
0.099 |
0.060 |
0.058 |
0.058 |
|
||
|
Payout ratio (ords), % |
n/a |
11.1% |
2.9% |
4.4% |
4.5% |
4.4% |
|
||
|
Payout ratio (prefs), % |
|
n/a |
5.1% |
6.4% |
6.4% |
6.4% |
|
6.4% |
|
|
BPS(ords), USD |
|
1.31 |
1.44 |
1.56 |
1.66 |
1.77 |
|
1.87 |
|
|
Revenues growth, % |
|
-7% |
32% |
24% |
-5% |
6% |
|
-1% |
|
|
EBITDA, chg |
|
-2% |
15% |
40% |
-13% |
-2% |
|
-5% |
|
|
EPS growth, % |
|
-107% |
-460% |
259% |
-40% |
-4% |
|
-1% |
|
|
EBIT margin, % |
26% |
23% |
28% |
26% |
23% |
22% |
|
||
|
EBITDA margin, % |
33.1% |
28.8% |
32.6% |
30.0% |
27.7% |
26.5% |
|
||
|
Net margin, % |
neg |
16.6% |
48.0% |
30.4% |
27.6% |
27.7% |
|
||
|
ROE, % |
n/m |
5.3% |
17.7% |
10.0% |
9.0% |
8.5% |
|
||
|
ROIC, % |
15.5% |
13.2% |
13.8% |
13.0% |
11.3% |
9.5% |
|
||
|
Capex/Revenues, % |
18% |
14% |
14% |
14% |
13% |
12% |
|
||
|
Capex/Depreciation, x |
2.3x |
2.4x |
3.3x |
3.2x |
3.0x |
|
2.8x |
||
|
Net debt/Equity, % |
-15% |
-24% |
-25% |
-25% |
-25% |
-25% |
|
||
|
Net debt/EBITDA, x |
(1.6x) |
(2.6x) |
(2.1x) |
(2.5x) |
(2.8x) |
|
(3.1x) |
||
|
Net interest cover, x |
|
(29.5x) |
(17.0x) |
(35.8x) |
(30.7x) |
(29.7x) |
|
(27.7x) |
|
|
Income statement summary, USD mn |
|
|
|
|
|
|
|
|
|
|
Revenues |
15,222 |
20,137 |
24,951 |
23,682 |
25,102 |
24,884 |
|
||
|
Cost of sales |
(8,780) |
(12,709) |
(15,255) |
(15,077) |
(16,574) |
(16,746) |
|
||
|
SG&A and other opexp. |
(1,407) |
(1,624) |
(1,552) |
(1,502) |
(1,585) |
(1,556) |
|
||
|
EBITDA |
5,035 |
5,804 |
8,144 |
7,103 |
6,943 |
6,582 |
|
||
|
Depreciation & amortization |
|
(1,150) |
(1,136) |
(1,059) |
(1,024) |
(1,069) |
|
(1,103) |
|
|
Operating profit |
3,885 |
4,668 |
7,085 |
6,079 |
5,874 |
5,479 |
|
||
|
Non-operating gains /(exp.) |
|
(6,570) |
(2,104) |
5,845 |
950 |
19 |
|
19 |
|
|
EBIT |
3,885 |
4,668 |
7,085 |
6,079 |
5,874 |
5,479 |
|
||
|
Net interest income/(exp.) |
1,610 |
1,659 |
1,717 |
1,667 |
2,551 |
2,915 |
|
||
|
Profit before tax |
(1,077) |
4,223 |
14,647 |
8,696 |
8,444 |
8,413 |
|
||
|
Income tax |
152 |
(886) |
(2,655) |
(1,500) |
(1,507) |
(1,527) |
|
||
|
Minority interests |
(1) |
(1) |
(4) |
(2) |
(2) |
(2) |
|
||
|
Net income |
(926) |
3,336 |
11,988 |
7,194 |
6,935 |
6,884 |
|
||
|
Cash flow statement summary, USD mn |
|
|
|
|
|
|
|
|
|
|
Cash flow from operations |
3,913 |
6,102 |
5,466 |
5,582 |
5,415 |
5,034 |
|
||
|
Working capital changes |
(164) |
294 |
(19) |
(19) |
(19) |
(19) |
|
||
|
Capex |
(2,696) |
(2,745) |
(3,472) |
(3,268) |
(3,238) |
(3,048) |
|
||
|
Other investing activities |
(306) |
(2,238) |
- |
- |
- |
- |
|
||
|
Free cash flow |
1,222 |
3,366 |
1,994 |
2,314 |
2,177 |
1,986 |
|
||
|
Dividends paid |
(1,107) |
(447) |
(540) |
(1,104) |
(779) |
(756) |
|
||
|
Net change in borrowings |
372 |
1,406 |
- |
- |
- |
- |
|
||
|
Other financing cash flow |
(103) |
(205) |
- |
- |
- |
- |
|
||
|
Movement in cash |
|
26 |
1,886 |
1,454 |
1,210 |
1,399 |
|
1,230 |
|
|
Balance sheet summary, USD mn |
|
|
|
|
|
|
|
|
|
|
Cash and equivalents |
1,787 |
3,812 |
5,266 |
6,476 |
7,875 |
9,105 |
|
||
|
PP&E |
21,953 |
24,839 |
28,311 |
31,579 |
34,817 |
37,865 |
|
||
|
Goodwill |
|
3 |
0 |
- |
- |
- |
|
- |
|
|
Investments |
|
36,904 |
41,219 |
41,219 |
41,219 |
41,219 |
|
41,219 |
|
|
Other assets |
|
4,005 |
3,735 |
3,736 |
3,736 |
3,736 |
|
3,736 |
|
|
Total assets |
|
64,652 |
73,605 |
78,532 |
83,010 |
87,647 |
|
91,925 |
|
|
Interest bearing debt |
|
1,480 |
3,202 |
3,202 |
3,202 |
3,202 |
|
3,202 |
|
|
Other liabilities |
6,371 |
7,674 |
7,674 |
7,674 |
7,674 |
7,674 |
|
||
|
Total liabilities |
7,850 |
10,877 |
10,876 |
10,876 |
10,876 |
10,876 |
|
||
|
Total shareholder's equity |
56,798 |
62,724 |
67,651 |
72,129 |
76,766 |
81,044 |
|
||
|
Minority interest |
4 |
5 |
9 |
11 |
13 |
15 |
|
||
|
Net working capital |
2,029 |
2,168 |
2,168 |
2,168 |
2,168 |
2,168 |
|
||
|
Net Debt |
(8,287) |
(15,309) |
(16,764) |
(17,974) |
(19,373) |
(20,603) |
|
||
|
Capital |
58,277 |
65,926 |
70,853 |
75,331 |
79,968 |
84,246 |
|
||
13 November 2018 |
6 |
vk.com/id446425943
Russia
Energy: Integrated Oil & Gas
VTB Capital Facts & Forecasts
Russia
Energy / Integrated Oil & Gas
Tatneft
Prices as of: 9 November 2018
Ticker |
CCY |
Current |
12mo TP |
Rating |
TATN RX |
USD |
11.97 |
11.00 |
Sell |
Share price performance, 12-mo
15 |
40% |
|
30% |
10 |
20% |
|
|
5 |
10% |
|
|
|
0% |
0 |
-10% |
Nov Jan Mar May Jul Sep Nov
TATN RX, USD, lhs
Relative to MOEX Index, %, rhs
Company description
Tatneft is one of largest oil producers in Russia, producing 28.7mmt in 2016. The majority of its operations are located in the Volga-Urals, with the Romashkinskoye field being the company's core producing asset (in 2016, it accounted for 30% of Tatneft's reserves and 58% of its total production volumes). At the end of 2011, Tatneft constructed the first line of its oil refinery (TANECO) in Nizhnekamsk. TANECO is a greenfield refinery and petrochemical complex with a current throughput capacity of 8.5mmt per annum. Since then the company has launched a hydrocracker unit in 2014 and coking unit in 2H16 within the refinery. Tatneft is also developing the Ashalchinskoye natural bitumen field, where 843kt of high viscous crude oil was produced in 2016.
Company website
http://www.tatneft.ru/
Shareholder structure
Svyazinvestneftekhim
26%
Other/Free
float
71% Quasi-
Treasury
3%
Source: Company data, VTB Capital Research
Research team
Dmitry Loukashov, CFA / +7 495 663 46 34
Ekaterina Rodina / +7 495 663 47 33
Alexander Donskoy / +7 495 660 67 88
Aydar Safin / +7 495 663 46 32
Artur Muradyants / +7 495 663 46 38
Oil Sector
Last model update on: 12 November 2018
|
IFRS |
2016 |
2017 |
2018F |
2019F |
2020F |
|
2021F |
|
|
Company data |
|
|
|
|
|
|
|
|
|
Weighted avg # shares, mn |
2,257 |
2,251 |
2,251 |
2,251 |
2,251 |
|
2,251 |
|
|
Avg market cap, USD mn |
11,183 |
15,146 |
26,445 |
26,445 |
26,445 |
|
26,445 |
|
|
EV, USD mn |
9,849 |
14,019 |
24,707 |
24,121 |
23,897 |
|
23,459 |
|
|
Ratios & analysis |
|
|
|
|
|
|
|
|
|
P/E, x |
7.2x |
7.3x |
7.4x |
7.5x |
7.1x |
|
7.0x |
|
|
EV/EBITDA, x |
4.1x |
4.5x |
5.1x |
5.1x |
4.6x |
|
4.4x |
|
|
P/B, x |
1.0x |
1.2x |
1.8x |
1.5x |
1.3x |
|
1.1x |
|
|
FCF yield, % |
6.0% |
11.9% |
7.8% |
5.8% |
7.7% |
|
6.3% |
|
|
Dividend yield (ords), % |
7.7% |
9.3% |
7.7% |
6.7% |
7.7% |
|
6.9% |
|
|
Dividend yield (prefs), % |
13.8% |
13.6% |
11.3% |
9.8% |
11.3% |
|
10.1% |
|
|
EPS(ords), USD |
0.71 |
0.94 |
1.62 |
1.60 |
1.68 |
|
1.70 |
|
|
CFPS, USD |
0.93 |
1.45 |
1.79 |
1.76 |
1.89 |
1.94 |
|
|
|
Free CFPS, USD |
0.31 |
0.81 |
0.93 |
0.69 |
0.93 |
0.76 |
|
|
|
DPS (ords), USD |
0.39 |
0.64 |
0.92 |
0.80 |
0.92 |
0.82 |
|
|
|
DPS (prefs) |
0.39 |
0.64 |
0.92 |
0.80 |
0.92 |
0.82 |
|
|
|
Payout ratio (ords), % |
51.5% |
63.5% |
53.1% |
46.8% |
51.3% |
45.2% |
|
|
|
Payout ratio (prefs), % |
3.6% |
4.5% |
3.7% |
3.3% |
3.6% |
3.2% |
|
|
|
BPS(ords), USD |
5.18 |
5.54 |
6.67 |
8.00 |
9.07 |
10.45 |
|
|
|
Revenues growth, % |
-8% |
34% |
22% |
-2% |
8% |
1% |
|
|
|
EBITDA, chg |
-3% |
29% |
52% |
-1% |
9% |
2% |
|
|
|
EPS growth, % |
-1% |
32% |
73% |
-1% |
5% |
|
2% |
|
|
EBIT margin, % |
22% |
21% |
27% |
28% |
28% |
29% |
|
|
|
EBITDA margin, % |
25.1% |
24.2% |
30.1% |
30.7% |
31.1% |
|
31.4% |
|
|
Net margin, % |
16.1% |
15.9% |
22.5% |
22.7% |
22.1% |
22.1% |
|
|
|
ROE, % |
13.8% |
17.1% |
24.5% |
20.1% |
18.6% |
16.4% |
|
|
|
ROIC, % |
11.0% |
13.0% |
19.3% |
16.7% |
16.2% |
14.9% |
|
|
|
Capex/Revenues, % |
14% |
11% |
12% |
15% |
13% |
15% |
|
|
|
Capex/Depreciation, x |
4.4x |
3.4x |
4.4x |
5.5x |
4.7x |
|
5.7x |
|
|
Net debt/Equity, % |
-11% |
-9% |
-12% |
-13% |
-12% |
-13% |
|
|
|
Net debt/EBITDA, x |
(0.5x) |
(0.4x) |
(0.4x) |
(0.5x) |
(0.5x) |
|
(0.5x) |
|
|
Net interest cover, x |
37.0x |
52.5x |
95.4x |
94.7x |
103.9x |
|
106.5x |
|
|
Income statement summary, USD mn |
|
|
|
|
|
|
|
|
|
Revenues |
9,917 |
13,292 |
16,246 |
15,863 |
17,080 |
17,322 |
|
|
|
Cost of sales |
(6,603) |
(8,917) |
(10,554) |
(10,182) |
(10,884) |
(10,947) |
|
|
|
SG&A and other opexp. |
(829) |
(1,162) |
|
|
|
|
|
|
|
EBITDA |
2,485 |
3,213 |
4,898 |
4,865 |
5,315 |
5,445 |
|
|
|
Depreciation & amortization |
(322) |
(426) |
(438) |
(439) |
(459) |
(467) |
|
|
|
Operating profit |
2,162 |
2,786 |
4,460 |
4,426 |
4,856 |
4,978 |
|
|
|
Non-operating gains /(exp.) |
(28) |
(14) |
91 |
5 |
2 |
|
5 |
|
|
EBIT |
2,162 |
2,786 |
4,460 |
4,426 |
4,856 |
|
4,978 |
|
|
Net interest income/(exp.) |
23 |
58 |
49 |
157 |
65 |
|
65 |
|
|
Profit before tax |
2,102 |
2,803 |
4,599 |
4,588 |
4,922 |
5,047 |
|
|
|
Income tax |
(520) |
(679) |
(951) |
(994) |
(1,157) |
(1,187) |
|
|
|
Minority interests |
19 |
(13) |
8 |
8 |
8 |
(23) |
|
|
|
Net income |
1,601 |
2,110 |
3,656 |
3,602 |
3,773 |
3,836 |
|
|
|
Cash flow statement summary, USD mn |
|
|
|
|
|
|
|
|
|
Cash flow from operations |
2,108 |
3,261 |
4,026 |
3,963 |
4,265 |
|
4,368 |
|
|
Working capital changes |
184 |
(113) |
|
|
|
|
|
|
|
Capex |
(1,427) |
(1,456) |
(1,933) |
(2,403) |
(2,178) |
(2,664) |
|
|
|
Other investing activities |
(396) |
(69) |
- |
- |
- |
- |
|
|
|
Free cash flow |
696 |
1,834 |
2,093 |
1,560 |
2,087 |
1,704 |
|
|
|
Share issue (reacquisition) |
- |
- |
|
|
|
|
|
|
|
Dividends paid |
(369) |
(1,859) |
(1,482) |
(2,145) |
(1,863) |
(2,141) |
|
|
|
Net change in borrowings |
(120) |
(60) |
|
|
|
|
|
|
|
Other financing cash flow |
- |
0 |
|
|
|
|
|
|
|
Movement in cash |
890 |
(588) |
611 |
(586) |
224 |
(438) |
|
|
|
Balance sheet summary, USD mn |
|
|
|
|
|
|
|
|
|
Cash and equivalents |
1,271 |
743 |
1,354 |
1,354 |
1,578 |
1,578 |
|
|
|
PP&E |
9,622 |
11,310 |
13,243 |
15,646 |
17,824 |
20,488 |
|
|
|
Goodwill |
- |
26 |
26 |
26 |
26 |
26 |
|
|
|
Investments |
1,687 |
2,106 |
2,106 |
2,106 |
2,106 |
2,106 |
|
|
|
Other assets |
5,466 |
5,042 |
5,042 |
5,042 |
5,042 |
5,042 |
|
|
|
Total assets |
18,046 |
19,227 |
21,771 |
24,174 |
26,576 |
|
29,240 |
|
|
Interest bearing debt |
892 |
813 |
813 |
227 |
227 |
(211) |
|
|
|
Other liabilities |
5,466 |
5,936 |
5,936 |
5,936 |
5,936 |
5,936 |
|
|
|
Total liabilities |
6,359 |
6,749 |
6,749 |
6,163 |
6,163 |
5,725 |
|
|
|
Total shareholder's equity |
11,598 |
12,359 |
14,911 |
17,908 |
20,318 |
23,397 |
|
|
|
Minority interest |
89 |
119 |
111 |
103 |
95 |
118 |
|
|
|
Net working capital |
852 |
926 |
926 |
926 |
926 |
926 |
|
|
|
Net Debt |
(1,334) |
(1,127) |
(1,738) |
(2,324) |
(2,548) |
(2,986) |
|
|
|
Capital |
12,491 |
13,171 |
15,724 |
18,135 |
20,545 |
23,186 |
|
|
|
|
|
|
|
|
|
|
|
|
13 November 2018 |
7 |