

PGM_outlook-100119_watermark
.pdfvk.com/id446425943
Platinum Group Metals
Momentum could fade
Earnings momentum remains positive for platinum group metals (PGM) miners as commodity prices have recovered. We increase our earnings forecasts and TPs for the PGM miners under our coverage, as we mark-to-market our commodity price forecasts. However, we see potential downside risk to the spot PGM basket price, which we calculate is trading above cost support for the first time in seven years, making it more vulnerable to escalating fears of a global slowdown. Despite the recovery in sector margins, we struggle to calculate much value in the sector and believe poor capital allocation risk could be increasing, given the improving returns and the sector’s lack of commitment towards dividends. Our top picks are Norilsk Nickel and Impala Platinum.
Increases in TPs for PGM miners, but ratings unchanged
We increase our earnings forecasts and TPs for the PGM miners (as shown in Figure 1), as we incorporate up to a 5% higher PGM basket price forecast and a slightly weaker rand forecast. The increases to our TPs are: Impala Platinum (+29% to ZAR45), Sibanye-Stillwater (+23% to ZAR11.1), Lonmin (+17% to ZAR7.0), Anglo American Platinum (+15% to ZAR540), Royal Bafokeng Platinum (+14% to ZAR25) and Norilsk Nickel (+4% to $24).
Positive earnings momentum could fade in a global slowdown
Earnings momentum for the PGM miners continues to remain positive into 2019 on the back of: 1) the low base for consensus earnings; 2) a PGM basket price recovery; and 3) a weaker rand. We calculate 51% further upside to consensus earnings for the SA-listed PGM producers if spot commodity prices prevail. However, we believe the positive momentum could slow over the medium term, as we remain cautious on a sustained commodity price recovery against a weak economic outlook, and prices trading above cost support. In addition, we believe stronger producer currencies and rising costs could erode miners’ earnings more than forecast.
Value not that compelling, despite recovery in margins
PGM margins and returns have recovered back to historical averages. Share prices have risen sharply, making it more difficult to calculate value, in our view. Improving returns, healthy balance sheets and a lack of commitment to dividends could increase the risk of poor capital allocation. We believe that in a world where growth expectations are fading due to trade wars, high debt levels and rising interest rates, investors may target companies that screen well on near-term valuation metrics. We calculate that most of the PGM miners still screen poorly on near-term FCF yields, due to their high capex commitments, poor cost position or elevated share prices.
Sector update
Equity Research 10 January 2019
Metals & Mining
Global
Steven Friedman +27 (11) 750-1481
SFriedman@rencap.com
Derick Deale
+27 (11) 750-1458 DDeale@rencap.com
Johann Pretorius +27 (11) 750-1450
JPretorius2@rencap.com
Kabelo Moshesha +27 (11) 750-1472
KMoshesha@rencap.com
Siphelele Mhlongo +27 (11) 750-1420
SMhlongo@rencap.com
PGM sector ratings and TPs (ranked by total potential 12M return, including estimated dividends)
Company |
New |
Old |
Current |
Rating |
|
TP |
TP |
price* |
|||
|
|
||||
Norilsk, $ |
24.0 |
23.0 |
19.5 |
BUY |
|
Implats, ZAR |
45.0 |
35.0 |
37.1 |
BUY |
|
Sibanye, ZAR |
11.1 |
9.0 |
10.4 |
HOLD |
|
Amplats, ZAR |
540 |
470 |
537 |
HOLD |
|
Northam, ZAR |
40.0 |
35.0 |
42.8 |
SELL |
|
RBPlats, ZAR |
25.0 |
22.0 |
28.0 |
SELL |
|
Lonmin, ZAR |
7.0 |
6.0 |
9.0 |
SELL |
*Priced as at market close on 8 January 2019.
Source: Thomson Reuters Datastream, Renaissance Capital estimates
Important disclosures are found at the Disclosures Appendix. Communicated by Renaissance Securities (Cyprus) Limited, regulated by the Cyprus Securities & Exchange Commission, which together with non-US affiliates operates outside of the USA under the brand name of Renaissance Capital.

vk.com/id446425943
TP changes and ranking table
Renaissance Capital
10 January 2019
Metals & Mining
Figure 1 shows PGM mining companies ranked by potential 12-month returns, based on our TPs.
We increase our earnings forecasts and TPs for the PGM miners (as shown in Figure 1), as we incorporate higher PGM basket price forecasts. Detailed commodity price revisions are contained on page 3.
The biggest increases to our TPs are: Impala Platinum +29% to ZAR45, SibanyeStillwater +23% to ZAR11.1, Lonmin +17% to ZAR7.0 and Anglo American Platinum +15% to ZAR540.
Figure 1: Summary sector ratings and TPs (ranked by total potential 12M return, including estimated dividends)*
Company |
Unit |
New |
Previous |
Current |
12M target |
12M fwd |
Total 12M |
12M forward |
Rating |
|
12M TP |
12M TP |
price* |
capital return |
dividend yield |
return |
rolling P/E |
||||
|
|
|
||||||||
Norilsk |
$ |
24.0 |
23.0 |
19.5 |
23.1% |
10.9% |
33.9% |
9.3x |
BUY |
|
Impala Platinum |
ZAR |
45.0 |
35.0 |
37.1 |
21.3% |
0.0% |
21.3% |
7.9x |
BUY |
|
Sibanye-Stillwater |
ZAR |
11.1 |
9.0 |
10.4 |
6.7% |
0.1% |
6.8% |
5.3x |
HOLD |
|
Anglo American Platinum |
ZAR |
540 |
470 |
537 |
0.6% |
2.3% |
2.9% |
13.6x |
HOLD |
|
Northam |
ZAR |
40.0 |
35.0 |
42.8 |
-6.5% |
0.0% |
-6.5% |
11.9x |
SELL |
|
RBPlats |
ZAR |
25.0 |
22.0 |
28.0 |
-10.7% |
0.0% |
-10.7% |
8.0x |
SELL |
|
Lonmin |
ZAR |
7.0 |
6.0 |
9.0 |
-22.6% |
0.0% |
-22.6% |
1.6x |
SELL |
*Price as at market close 08 January 2019
Source: Thomson Reuters Datastream, Renaissance Capital estimates
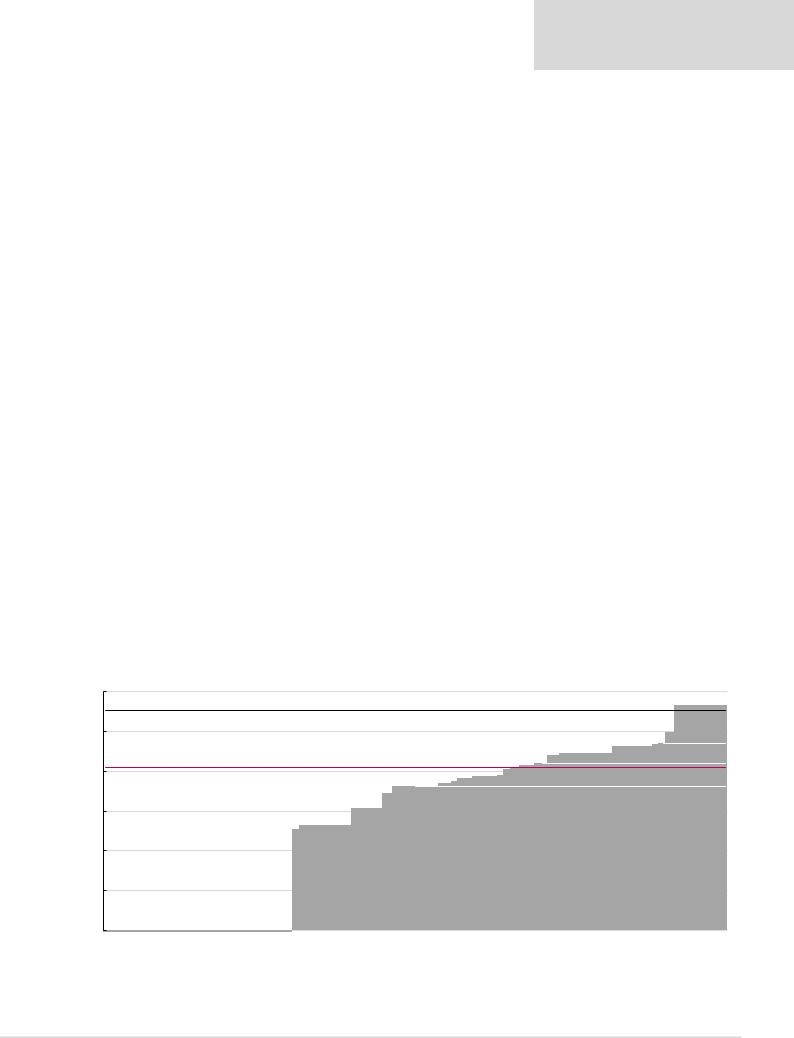
PGM mining companies are trading around 72% above their 12-month lows in rand terms.
Figure 2: PGM company share price compared with 12-month lows
160% |
|
|
|
|
|
|
|
|
138% |
|
|
|
|
|
|
||
140% |
|
|
|
|
|
|
||
|
|
|
|
|
|
|
||
|
|
|
|
|
|
|
||
120% |
|
|
|
|
|
|
|
|
|
|
|
|
|
|
|
||
100% |
|
|
|
|
|
|
|
|
|
87% |
80% |
|
|
|
|
||
|
|
|
72% |
|
|
|
||
80% |
|
|
|
|
|
|
||
|
|
|
|
52% |
|
|
||
60% |
|
|
|
|
|
|
||
|
|
|
|
|
|
|||
|
|
|
|
|
39% |
35% |
||
|
|
|
|
|
|
|||
40% |
|
|
|
|
|
|
||
|
|
|
|
|
|
|
||
20% |
|
|
|
|
|
|
|
|
|
|
|
|
|
|
|
||
0% |
|
|
|
|
|
|
|
|
IMP 15-8-2018 (ZAR15.9) |
RBP 29-6-2018 (ZAR19.9) |
AMS 13-4-2018 (ZAR312.0) |
Average |
SGL 19-7-2018 (ZAR7.1) |
LON 26-7-2018 (ZAR6.7) |
NHM 24-5-2018 (ZAR34.8) |
||
|
Note: Priced as at market close on 8 January 2019.
Source: Thomson Reuters
2
vk.com/id446425943
Commodity revisions
Renaissance Capital
10 January 2019
Metals & Mining
The table below shows changes to our PGM prices and currency forecasts. We mark-to- market our near-term commodity price forecasts, resulting in a 4% increase to our PGM basket price. Our long-term commodity price forecasts are around the 90th percentile of industry cash costs. We increase our long-term 3PGM basket price by 5%, as we incorporate a higher rhodium price to reflect our expectations of rising cost support on the back of high industry inflation.
Figure 3: RenCap’s commodity price forecast revisions
Average per calendar year |
2019E |
2020E |
2021E |
2022E |
LT real |
Platinum, $/oz |
|
|
|
|
|
New |
870 |
1,070 |
1,153 |
1,177 |
1,100 |
Old |
925 |
1,093 |
1,165 |
1,188 |
1,100 |
% change |
-6% |
-2% |
-1% |
-1% |
0% |
Palladium, $/oz |
|
|
|
|
|
New |
1,216 |
1,088 |
1,049 |
1,070 |
1,000 |
Old |
1,050 |
1,051 |
1,059 |
1,080 |
1,000 |
% change |
16% |
4% |
-1% |
-1% |
0% |
Rhodium, $/oz |
|
|
|
|
|
New |
2,379 |
2,163 |
2,097 |
2,139 |
2,000 |
Old |
2,146 |
1,579 |
1,377 |
1,405 |
1,300 |
% change |
11% |
37% |
52% |
52% |
54% |
3PGM basket (57% Pt, 36% Pd, 7% Rh), $/oz |
|
|
|
|
|
New |
1,100 |
1,153 |
1,182 |
1,206 |
1,127 |
Old |
1,056 |
1,112 |
1,142 |
1,165 |
1,078 |
% change |
4% |
4% |
4% |
4% |
5% |
Gold, $/oz |
|
|
|
|
|
New |
1,350 |
1,338 |
1,311 |
1,337 |
1,250 |
Old |
1,264 |
1,300 |
1,324 |
1,350 |
1,250 |
% change |
7% |
3% |
-1% |
-1% |
0% |
ZAR/$ |
|
|
|
|
|
New |
14.31 |
14.14 |
14.17 |
14.45 |
13.00 |
Old |
14.00 |
13.98 |
14.04 |
14.32 |
12.75 |
% change |
2% |
1% |
1% |
1% |
2% |
Source: Renaissance Capital estimates
The cost curve below shows total quality-adjusted cash costs plus sustaining capex, net of by-product credits. We calculate “all-in” quality adjusted cash cost as follows: 1) we divide EBITDA in dollar terms by 3PGM sales volumes to get EBITDA per 3PGM ounce; 2) we then subtract EBITDA per 3PGM ounce from the 3PGM benchmark price and add sustaining capex per 3PGM ounce; 3) the result is quality-adjusted “all-in” unit costs plus sustaining capex, which takes product premiums or discounts into account.
Figure 4: 2018E cash costs plus sustaining capex per 3PGM ounce (realisation adjusted) by mine, $/oz
|
1,200 |
|
|
|
|
|
|
|
|
|
3PGM price: $1,107/oz* |
|
|
|
|
|
|
|
1,000 |
|
|
|
|
90th percentile: $943/oz |
||
|
|
|
|
|
|
|||
|
|
|
|
|
|
|
|
935 |
|
|
Average cash cost: $822/oz |
|
|
(AMS),Kroondal739 (AMS),Unki749 (IMP),RiversTwo767 (IMP),Zimplats776 (AMS),Modikwa778 (IMP),Mimosa808 (ARI),RiversTwo 813 (NHM),Zondereinde827 (RBP),BRPM842 Kroondal(SGL), 879 |
Lonmin, 888 |
Rustenburg(SGL),928 |
943 |
|
800 |
|
|
|
(ARI), |
|||
|
|
|
|
|
||||
$/oz |
|
Norilsk |
528(AMS),Mogalakwena |
613(SGL),Stillwater 692(NHM),Booysendal (AMS),Mototolo726 (AMS),Amandelbult726 |
(AMS), |
|||
|
Modikwa |
|||||||
|
600 |
|
|
|
|
|
|
Union |
|
|
|
|
|
|
|
|
|
|
400 |
|
|
|
|
|
|
|
|
200 |
|
|
|
|
|
|
|
|
0 |
|
|
|
|
|
|
|
Marula (IMP), 997
Rustenburg lease (IMP), 1,134
*Priced as at market close on 8 January 2019.
Source: Bloomberg, Company data, Renaissance Capital estimates
3

vk.com/id446425943
Earnings revisions
Figures 5-6 summarise the changes to our earnings forecasts, as we incorporate revised commodity price forecasts and make slight changes to our cost and volume assumptions in some cases. Our medium-term earnings forecasts are above consensus in most cases.
Figure 5: Earnings for December year-ends |
|
|
|
|
|
Dec-YE |
2018E |
2019E |
2020E |
2021E |
2022E |
Anglo American Platinum – HEPS forecasts, ZAc |
|
|
|
|
|
New |
3,018 |
4,037 |
4,412 |
4,424 |
4,452 |
Old |
2,949 |
3,329 |
3,870 |
3,725 |
3,923 |
% change |
2% |
21% |
14% |
19% |
13% |
Thomson Reuters consensus |
2,610 |
3,009 |
3,608 |
|
|
RenCap compared with consensus |
16% |
34% |
22% |
|
|
NorNickel–underlying EPS forecasts, USc |
|
|
|
|
|
New |
212 |
209 |
222 |
205 |
203 |
Old |
206 |
210 |
206 |
200 |
200 |
% change |
3% |
-1% |
8% |
3% |
1% |
Thomson Reuters consensus |
238 |
249 |
256 |
|
|
RenCap compared with consensus |
-11% |
-16% |
-13% |
|
|
Royal Bafokeng Platinum – HEPS forecasts, ZAc |
|
|
|
|
|
New |
21 |
380 |
568 |
598 |
662 |
Old |
12 |
308 |
515 |
544 |
594 |
% change |
72% |
23% |
10% |
10% |
11% |
Thomson Reuters consensus |
28.2 |
138 |
368 |
|
|
RenCap compared with consensus |
-26% |
175% |
54% |
|
|
Sibanye-Stillwater – HEPS forecasts, ZAc |
|
|
|
|
|
New |
29 |
202 |
174 |
156 |
182 |
Old |
14 |
83 |
112 |
131 |
155 |
% change |
107% |
143% |
55% |
19% |
17% |
Thomson Reuters consensus |
33 |
128 |
157 |
|
|
RenCap compared with consensus |
-13% |
58% |
11% |
|
|
Source: Thomson Reuters, Renaissance Capital estimates
Figure 6: Earnings for June and September year-ends |
|
|
|
|
|
Jun/Sep-YE |
2019E |
2020E |
2021E |
2022E |
2013E |
Impala Platinum – HEPS forecasts, ZAc |
|
|
|
|
|
New |
392 |
539 |
784 |
842 |
888 |
Old |
302 |
369 |
639 |
682 |
719 |
% change |
30% |
46% |
23% |
24% |
23% |
Thomson Reuters consensus |
189 |
272 |
410 |
|
|
RenCap compared with consensus |
108% |
98% |
91% |
|
|
Northam – Normalised HEPS forecasts, ZAc |
|
|
|
|
|
New |
288 |
424 |
533 |
695 |
745 |
Old |
243 |
340 |
429 |
570 |
611 |
% change |
19% |
25% |
24% |
22% |
22% |
Thomson Reuters consensus |
-70 |
54 |
365 |
|
|
RenCap compared with consensus |
511% |
681% |
46% |
|
|
Lonmin – underlying EPS forecasts, USc |
|
|
|
|
|
New |
44 |
25 |
9 |
2 |
-1 |
Old |
9 |
9 |
11 |
4 |
3 |
% change |
387% |
194% |
-17% |
-60% |
-127% |
Thomson Reuters consensus |
11 |
12 |
12 |
|
|
RenCap compared with consensus |
290% |
115% |
-27% |
|
|
Source: Thomson Reuters, Renaissance Capital estimates
Renaissance Capital
10 January 2019
Metals & Mining
4
vk.com/id446425943
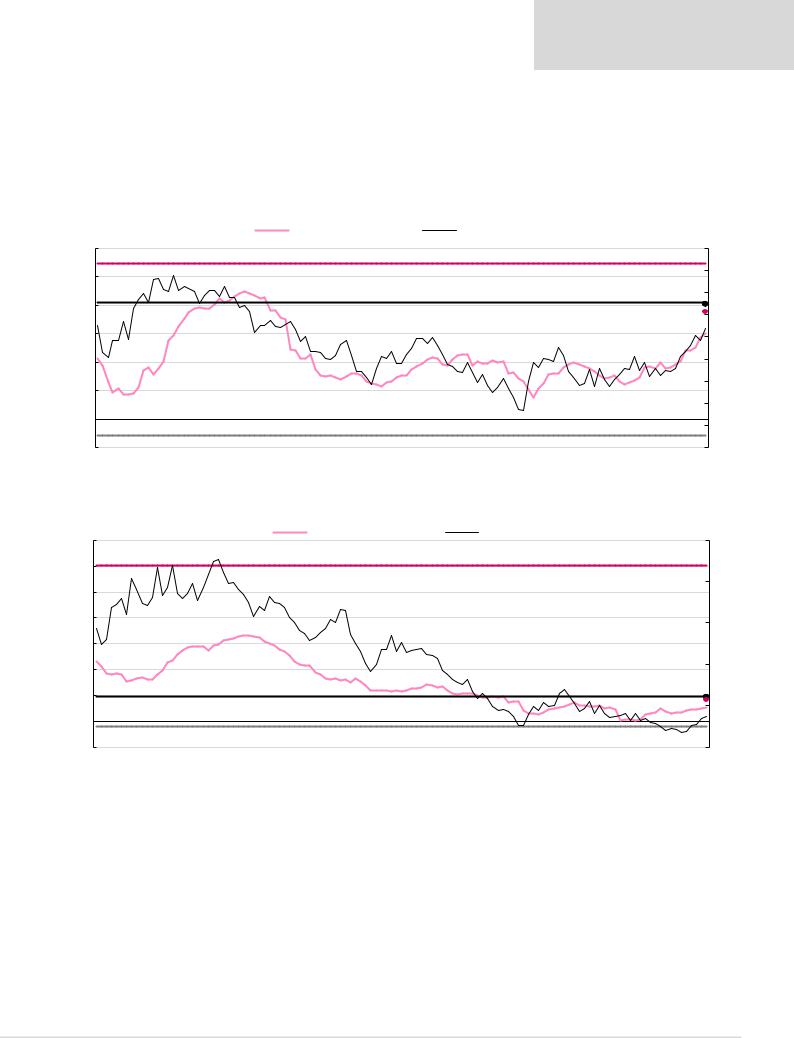
Share prices rose with positive earnings momentum…
Earnings momentum in the PGM sector remains positive on the back of higher commodity prices and weaker producer currencies.
The figures below show PGM mining company one-year forward consensus earnings over time relative to share price performance. The graphs also show: 1) peak reported earnings; 2) trough reported earnings; 3) our estimate of mid-cycle earnings; 4) our one- year-forward earnings estimate; and 5) spot earnings.
Renaissance Capital
10 January 2019
Metals & Mining
Figure 7: Amplats – consensus 12M forward earnings vs share price
Forward 12M EPS
|
60 |
|
2008 estimated peak EPS, 54.58 |
|
|
|
|
|
|
|
|
|
|
||
|
50 |
|
|
|
|
|
|
|
40 |
|
Mid-cycle EPS, 41.12 |
|
|
|
|
ZAR/share |
|
|
|
|
|
|
|
30 |
|
|
|
|
|
|
|
|
|
|
|
|
|
|
|
|
20 |
|
|
|
|
|
|
|
10 |
|
|
|
|
|
|
|
0 |
|
|
|
|
|
|
|
|
2012 estimated trough EPS, (5.63) |
|
|
|
||
|
-10 |
|
|
|
|
|
|
|
|
2009 |
2010 |
2011 |
2012 |
2013 |
2014 |
Figure 8: Impala – consensus 12M forward earnings vs share price |
|
||||||
|
35 |
|
|
|
|
Forward 12M EPS |
|
|
|
|
|
|
|
|
|
|
|
|
2008 estimated peak EPS, 30.12 |
|
|
|
|
|
30 |
|
|
|
|
|
|
|
25 |
|
|
|
|
|
|
|
20 |
|
|
|
|
|
|
ZAR/share |
|
|
|
|
|
|
|
|
15 |
|
|
|
|
|
|
|
10 |
|
|
|
|
|
|
|
5 |
Mid-cycle EPS, 4.84 |
|
|
|
|
|
|
|
|
|
|
|
|
|
|
0 |
|
2016 estimated trough EPS, (1.12) |
|
|
|
|
|
|
|
|
|
|
|
|
|
-5 |
|
|
|
|
|
|
|
|
2009 |
2010 |
2011 |
2012 |
2013 |
2014 |
Share price, ZAR (RHS)
|
|
|
|
|
900 |
|
|
|
|
|
800 |
|
|
12M forward RenCap EPS est., 40.35 |
700 |
||
|
|
|
|||
|
|
12M forward spot EPS est., |
37.71 |
600 |
|
|
|
|
|
|
|
|
|
|
|
|
500 |
|
|
|
|
|
400 |
|
|
|
|
|
300 |
|
|
|
|
|
200 |
|
|
|
|
|
100 |
|
|
|
|
|
0 |
2015 |
2016 |
2017 |
2018 |
2019 |
|
Source: Company data, Thomson Reuters DataStream, Bloomberg, Renaissance Capital estimates
|
Share price, ZAR (RHS) |
|
|
250 |
|
|
|
|
|
|
|
|
|
|
|
|
200 |
|
|
|
|
|
150 |
|
|
|
|
|
100 |
|
|
12M forward RenCap EPS est., 4.69 |
|
||
|
|
12M forward spot EPS est., 4.09 |
50 |
||
|
|
|
|
|
|
|
|
|
|
|
0 |
2015 |
2016 |
2017 |
2018 |
2019 |
|
Source: Company data, Thomson Reuters DataStream, Bloomberg, Renaissance Capital estimates
5
vk.com/id446425943
Renaissance Capital
10 January 2019
Metals & Mining
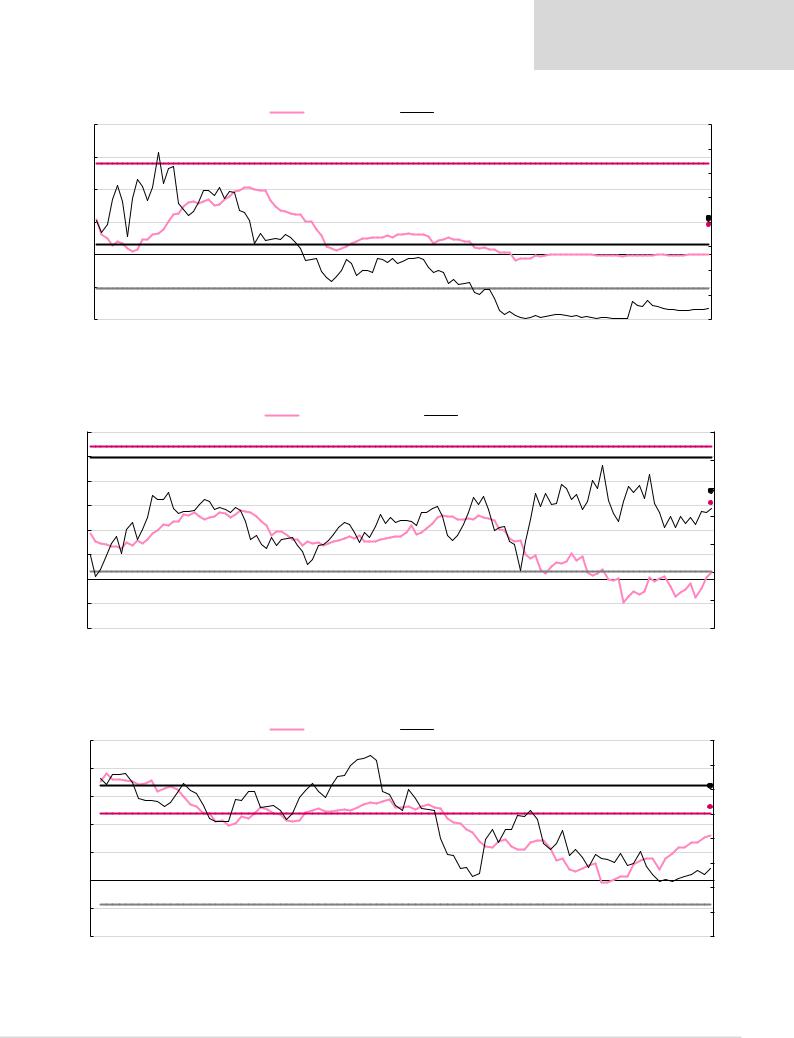
Figure 9: Lonmin – consensus 12M forward earnings vs share price
ZAR/share
20
15
10
5
0
-5
-10
|
|
|
|
Forward 12M EPS |
|
Share price, ZAR (RHS) |
|
|
|
|
|
|
|
|
|
|
|
|
|
|
|
|
160 |
|
2008 estimated peak EPS, 14.11 |
|
|
|
|
|
|
|
|
140 |
|
|
|
|
|
|
|
|
|
|
|
||
|
|
|
|
|
|
|
|
|
|
|
120 |
|
|
|
|
|
|
|
|
|
|
|
100 |
|
|
|
|
|
|
|
|
12M forward RenCap EPS est., 5.56 |
80 |
||
|
|
|
|
|
|
|
|
12M forward spot EPS est., 4.57 |
|
||
|
Mid-cycle EPS, 1.50 |
|
|
|
|
|
|
|
|
|
60 |
|
|
|
|
|
|
|
|
|
|
|
|
|
|
|
|
|
|
|
|
|
|
|
40 |
|
2016 estimated trough EPS, (5.19) |
|
|
|
|
|
|
|
|
|
|
|
|
|
|
|
|
|
|
|
|
|
20 |
|
|
|
|
|
|
|
|
|
|
|
0 |
2009 |
2010 |
2011 |
2012 |
2013 |
2014 |
2015 |
2016 |
2017 |
2018 |
2019 |
|
Source: Company data, Thomson Reuters DataStream, Bloomberg, Renaissance Capital estimates
Figure 10: Northam – consensus 12M forward earnings vs share price
Forward 12M EPS |
Share price, ZAR (RHS) |
ZAR/share
6
5
4
3
2
1
0
-1
-2
|
|
|
|
|
|
|
|
|
|
70 |
|
2008 estimated peak EPS, 5.41 |
|
|
|
|
|
|
|
60 |
|
|
Mid-cycle EPS, 4.97 |
|
|
|
|
|
|
|
|
|
|
|
|
|
|
|
|
|
|
|
|
|
|
|
|
|
|
|
|
12M forward RenCap EPS est., 3.60 |
50 |
|
|
|
|
|
|
|
|
|
|
||
|
|
|
|
|
|
|
|
12M forward spot EPS est., 3.09 |
|
|
|
|
|
|
|
|
|
|
|
|
40 |
|
|
|
|
|
|
|
|
|
|
30 |
2015 estimated trough EPS, 0.32 |
|
|
|
|
|
|
|
20 |
||
|
|
|
|
|
|
|
|
|
|
|
|
|
|
|
|
|
|
|
|
|
10 |
|
|
|
|
|
|
|
|
|
|
0 |
2009 |
2010 |
2011 |
2012 |
2013 |
2014 |
2015 |
2016 |
2017 |
2018 |
2019 |
Source: Company data, Thomson Reuters DataStream, Bloomberg, Renaissance Capital estimates
Figure 11: RBPlats – consensus 12M forward earnings vs share price
ZAR/share
|
|
|
Forward 12M EPS |
|
Share price, ZAR (RHS) |
|
|
|
5 |
|
|
|
|
|
|
|
80 |
4 |
|
|
|
|
|
|
|
70 |
|
|
|
|
|
|
|
|
|
|
Mid-cycle EPS, 3.40 |
|
|
|
|
12M forward RenCap EPS est., 3.39 |
60 |
|
3 |
|
|
|
|
|
|
|
|
|
|
|
|
|
|
|
|
|
|
2014 estimated peak EPS, 2.39 |
|
|
|
|
|
12M forward spot EPS est., 2.62 |
50 |
|
|
|
|
|
|
|
|
|
2 |
|
|
|
|
|
|
|
|
|
|
|
|
|
|
|
|
40 |
1 |
|
|
|
|
|
|
|
|
|
|
|
|
|
|
|
|
30 |
0 |
|
|
|
|
|
|
|
20 |
|
2015 estimated trough EPS, (0.83) |
|
|
|
|
|
||
|
|
|
|
|
|
|
||
-1 |
|
|
|
|
|
|
|
10 |
|
|
|
|
|
|
|
|
|
-2 |
|
|
|
|
|
|
|
0 |
2011 |
2012 |
2013 |
2014 |
2015 |
2016 |
2017 |
2018 |
2019 |
Source: Company data, Thomson Reuters DataStream, Bloomberg, Renaissance Capital estimates
6
vk.com/id446425943
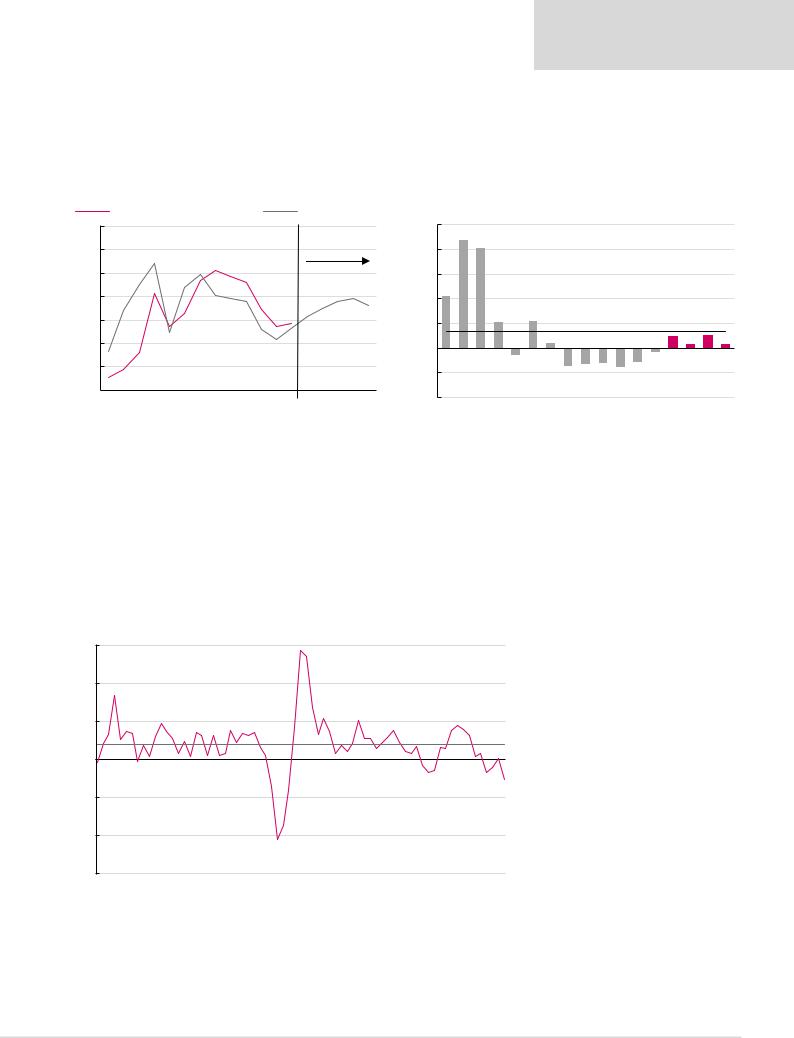
…but we believe the momentum could fade
Basket price above marginal cost of production
The chart below on the left shows historical annual average 3PGM prices compared with the 90th percentile of the cost curve over time. The chart on the right shows the 3PGM price premium or discount to the 90th percentile.
Renaissance Capital
10 January 2019
Metals & Mining
Figure 12: 3PGM basket price vs cash costs at the 90th percentile |
Figure 13: 3PGM basket price premium (discount) relative to the 90th percentile |
|
|
90th percentile of 3PGM cost curve* |
|
|
|
3PGM basket price** |
|
|
87% |
|
|
|
|
|
||||||||||
1,800 |
|
1,226 |
946 |
1,053 |
1,339 |
1,421 |
1,370 |
1,320 |
1,088 |
947 |
970 |
1,028 |
1,100 |
1,153 |
1,182 |
1,127 |
100% |
42% |
81% |
21% |
|
21% |
|
|
$/oz |
|
|
|
|
||||||||||||||||||||
1,600 |
|
|
|
|
|
|
|
|
|
|
|
|
Forecasts |
|
80% |
|
|
|
|
|
|
|
||
1,400 |
|
|
|
|
|
|
|
|
|
|
|
|
|
|
|
|
60% |
|
|
|
|
|
|
|
1,200 |
|
|
|
|
|
|
|
|
|
|
|
|
|
|
|
|
40% |
|
|
|
|
|
|
|
1,000 |
|
580 720 |
|
|
|
|
|
|
|
|
|
|
|
|
|
|
20% |
|
|
|
|
|
|
3% |
|
514 |
|
|
|
|
|
|
|
|
933 |
|
|
|
|
|
|
|
|
|
6%- |
|
|||
800 |
|
|
|
|
|
|
|
|
|
|
|
|
|
-20% |
|
|
|
|
|
|||||
|
|
|
|
|
|
|
|
|
|
|
|
|
|
|
|
|
0% |
|
|
|
|
|
|
|
600 |
|
|
|
|
|
|
|
|
|
|
|
|
|
|
|
|
|
|
|
|
|
|
|
|
400 |
2005 |
2006 2007 2008 2009 2010 2011 |
2012 |
2013 |
2014 |
2015 |
2016 |
2017 |
2018E |
2019E |
2020E |
2021E |
LT (real) |
-40% |
|
|
|
|
|
|
|
|||
|
2005 |
2006 |
2007 |
2008 |
2009 |
2010 |
2011 |
|||||||||||||||||
|
|
|||||||||||||||||||||||
*Cash costs including sustaining capex adjusted for realisations and by-products. |
|
|
|
|
|
|
|
|
|
|
|
|
|
|||||||||||
**3PGM basket (57% Pt, 36% Pd, 7% Rh), $/oz. |
|
|
|
|
|
|
|
|
|
|
|
|
|
|
|
|
|
|
|
|||||
|
|
|
|
|
|
Source: Bloomberg, Company data, Renaissance Capital estimates |
|
|
|
|
|
|
|
|
||||||||||
Historical average, 14%9% |
3% |
10% |
3% |
-15% |
-14% |
-12% |
-16% |
-12% |
-4% |
|
|
|
|
2012 |
2013 |
2014 |
2015 |
2016 |
2017 |
2018E |
2019E |
2020E |
2021E |
Source: Bloomberg, CRU, Renaissance Capital estimates
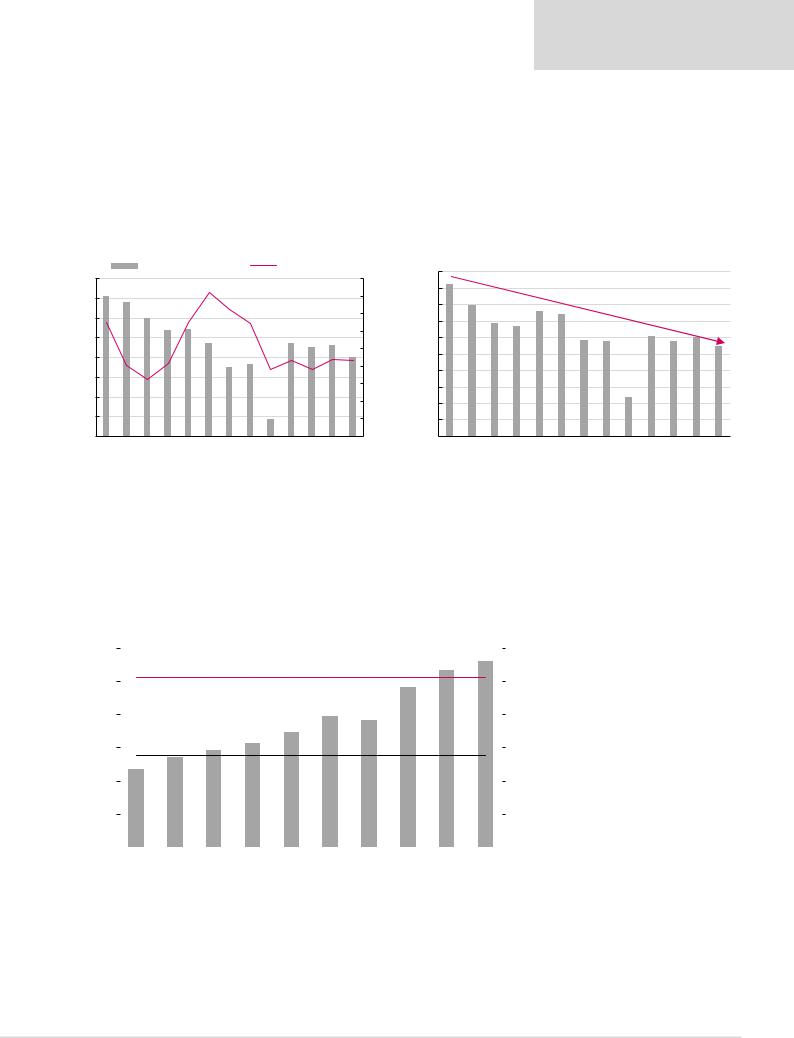
Weak economic outlook could weigh on industrial demand
We believe increasing geopolitical uncertainty and escalating fears of a global slowdown could weigh on industrial demand for PGMs. The chart below highlights the recent declining trend in global vehicle sales, with sales contracting the most since the global financial crisis.
Figure 14: Global vehicle sales growth, YoY
30% |
|
|
|
|
|
|
|
|
|
|
|
|
|
|
|
|
|
20% |
|
|
|
|
|
|
|
|
|
|
|
|
|
|
|
|
|
10% |
|
|
|
|
|
|
|
|
|
|
|
|
|
|
|
|
|
|
|
|
|
|
|
|
|
|
|
|
|
|
|
Average, 4% |
|
|
|
0% |
|
|
|
|
|
|
|
|
|
|
|
|
|
|
|
|
|
|
|
|
|
|
|
|
|
|
|
|
|
|
|
|
|
|
-5% |
-10% |
|
|
|
|
|
|
|
|
|
|
|
|
|
|
|
|
|
-20% |
|
|
|
|
|
|
|
|
|
|
|
|
|
|
|
|
|
-30% |
|
|
|
|
|
|
|
|
|
|
|
|
|
|
|
|
|
2001 |
2002 |
2003 |
2004 |
2005 |
2006 |
2007 |
2008 |
2009 |
2010 |
2011 |
2012 |
2013 |
2014 |
2015 |
2016 |
2017 |
2018 |
Source: Bloomberg
7
vk.com/id446425943
Renaissance Capital
10 January 2019
Metals & Mining
Cost inflation through mining complexity and wage inflation
Western Limb mines are some of the more mature platinum mines in SA; they suffer from increasing mining complexity as they go deeper, and grade declines, given their finite lives. Miners generally need either to spend more capex to maintain volumes as mining complexity increases or achieve major technological advances that could offset increasing mining complexity in deep-level, labour-intensive mines. Neither of these events have occurred on the Western Limb over the past decade, resulting in production falling by around 25% over the period due to lower tonnes milled and falling grades.
Figure 15: Western Limb* tonnes milled and 3PGM grades |
|
|
|
|
Figure 16: Western Limb* 3PGM production, mn oz |
|
|
|
|
|
|||||||||||||||||
|
|
|
Tonnes milled (LHS) |
|
|
|
3PGM grades (RHS) |
|
7.0 |
|
|
|
|
|
|
|
|
|
|
|
|
||||||
|
70 |
|
|
|
|
|
|
|
|
|
|
|
|
3.5 |
|
|
|
|
|
|
|
|
|
|
|
|
|
|
|
|
|
|
|
|
|
|
|
|
|
|
6.5 |
|
|
|
|
|
|
|
|
|
|
|
|
||
|
|
|
|
|
|
|
|
|
|
|
|
|
|
3.4 |
|
|
|
|
|
|
|
|
|
|
|
|
|
|
65 |
|
|
|
|
|
|
|
|
|
|
|
|
6.0 |
|
|
|
|
|
|
|
|
|
|
|
|
|
|
|
|
|
|
|
|
|
|
|
|
|
|
|
3.3 |
|
|
|
|
|
|
|
|
|
|
|
|
|
|
60 |
|
|
|
|
|
|
|
|
|
|
|
|
5.5 |
|
|
|
|
|
|
|
|
|
|
|
|
|
|
|
|
|
|
|
|
|
|
|
|
|
|
|
|
|
|
|
|
|
|
|
|
|
|
|
||
|
|
|
|
|
|
|
|
|
|
|
|
|
|
|
|
|
|
|
|
|
|
|
|
|
|
|
|
|
55 |
|
|
|
|
|
|
|
|
|
|
|
|
3.2 |
5.0 |
|
|
|
|
|
|
|
|
|
|
|
|
|
|
|
|
|
|
|
|
|
|
|
|
|
|
|
|
|
|
|
|
|
|
|
|
|
|
||
mnt |
50 |
|
|
|
|
|
|
|
|
|
|
|
|
3.1 |
4.5 |
|
|
|
|
|
|
|
|
|
|
|
|
|
|
|
|
|
|
|
|
|
|
|
|
|
|
|
|
|
|
|
|
|
|
|
|
|
|||
|
|
|
|
|
|
|
|
|
|
|
|
3.0 g/t |
|
|
|
|
|
|
|
|
|
|
|
|
|
||
|
|
|
|
|
|
|
|
|
|
|
|
|
4.0 |
|
|
|
|
|
|
|
|
|
|
|
|
||
|
45 |
|
|
|
|
|
|
|
|
|
|
|
|
|
|
|
|
|
|
|
|
|
|
|
|
|
|
|
|
|
|
|
|
|
|
|
|
|
|
|
2.9 |
3.5 |
|
|
|
|
|
|
|
|
|
|
|
|
|
|
|
|
|
|
|
|
|
|
|
|
|
|
|
|
|
|
|
|
|
|
|
|
|
|
|
||
|
40 |
|
|
|
|
|
|
|
|
|
|
|
|
|
|
|
|
|
|
|
|
|
|
|
|
|
|
|
|
|
|
|
|
|
|
|
|
|
|
|
2.8 |
3.0 |
|
|
|
|
|
|
|
|
|
|
|
|
|
|
|
|
|
|
|
|
|
|
|
|
|
|
|
|
|
|
|
|
|
|
|
|
|
|
|
||
|
35 |
|
|
|
|
|
|
|
|
|
|
|
|
2.7 |
2.5 |
|
|
|
|
|
|
|
|
|
|
|
|
|
30 |
|
|
|
|
|
|
|
|
|
|
|
2018E |
2.6 |
2.0 |
|
|
|
|
|
|
|
|
|
|
|
2018E |
|
2006 |
2007 |
2008 |
2009 |
2010 |
2011 |
2012 |
2013 |
2014 |
2015 |
2016 |
2017 |
|
2006 |
2007 |
2008 |
2009 |
2010 |
2011 |
2012 |
2013 |
2014 |
2015 |
2016 |
2017 |
||
*Includes Lonmin, Zondereinde, BRPM, Impala, Rustenburg, Amandebult, Union, Kroondal and Marikana. |
*Includes Lonmin, Zondereinde, BRPM, Impala, Rustenburg, Amandebult, Union, Kroondal and Marikana. |
Source: Company data, Renaissance Capital estimates |
Source: Company data, Renaissance Capital estimates |
The SA platinum sector has historically suffered from very high wage inflation (2008-2017 CAGR of 10.2%) relative to SA CPI (5.5% over the same period). We believe we could be underestimating the impact of wage inflation, given the historical precedents and improved profitability. Most PGM miners are expected to enter wage negotiations during 2019.
Figure 17: Average wages in the SA platinum sector (LHS) relative to wage and CPI CAGR, 2008-2017
ZAR '000 p/a
300 |
|
|
|
|
|
|
|
|
|
|
12% |
|
PGM wage inflation CAGR (2008-2017), 10.2% |
|
|
|
|
|
|||||||
|
|
|
|
|
|
|
||||||
250 |
|
|
|
|
|
|
|
|
|
|
10% |
|
|
|
|
|
|
|
|
|
|
|
|||
200 |
|
|
|
|
|
|
|
|
|
|
8% |
|
SA CPI CAGR (2008-2017), 5.5% |
|
|
|
|
|
|
||||||
150 |
|
|
|
|
|
|
6% |
|||||
|
|
|
|
|
|
|
|
|
|
|||
100 |
|
|
|
|
|
|
|
|
|
|
4% |
|
|
|
|
|
|
|
|
|
|
|
|||
50 |
|
|
|
|
|
|
|
|
|
|
2% |
|
|
|
|
|
|
|
|
|
|
|
|||
0 |
|
|
|
|
|
|
|
|
|
|
0% |
|
2008 |
2009 |
2010 |
2011 |
2012 |
2013 |
2014 |
2015 |
2016 |
2017 |
|||
|
|
|||||||||||
|
|
|
|
Source: Minerals Council, Department of Mineral Resources, STATSSA, Renaissance Capital |
||||||||
8
vk.com/id446425943
Value not that compelling, despite recovery in margins
Sector margins have recovered…
We estimate that near-term mining sector margins have recovered back to their long-term average over the past decade, which we expect to result in significant earnings growth.
Renaissance Capital
10 January 2019
Metals & Mining
Figure 18: Long-term average margin analysis, % |
Figure 19: Long-term average margin analysis, $/oz |
|
|
|
|
Margin, % |
|
|
Average margin, % |
|
|
|
||||||
70% |
|
|
|
|
|
|
|
|
|
|
|
|
|
|
|
900 |
60% |
|
|
|
|
|
|
|
|
|
|
|
|
|
|
|
800 |
|
|
|
|
|
|
|
|
|
|
|
|
|
|
|
|
|
|
|
|
|
|
|
|
|
|
|
|
|
|
|
|
|
700 |
50% |
|
|
|
|
|
|
|
|
|
|
|
|
|
|
|
600 |
|
|
|
|
|
|
|
|
|
|
|
|
|
|
|
|
|
40% |
|
|
|
|
|
|
|
|
|
|
|
|
|
|
|
500 |
|
|
|
|
|
|
|
|
|
|
|
|
|
|
|
|
|
30% |
|
|
|
|
|
|
|
|
|
|
|
|
|
|
|
400 |
20% |
|
|
|
|
|
|
|
|
|
|
|
|
|
|
|
300 |
|
|
|
|
|
|
|
|
|
|
|
|
|
|
|
|
|
|
|
|
|
|
|
|
|
|
|
|
|
|
|
|
|
200 |
10% |
|
|
|
|
|
|
|
|
|
|
|
|
|
|
|
100 |
|
|
|
|
|
|
|
|
|
|
|
|
|
|
|
|
|
0% |
|
|
|
|
|
|
|
|
|
|
|
|
|
|
|
0 |
2005 |
2006 |
2007 |
2008 |
2009 |
2010 |
2011 |
2012 |
2013 |
2014 |
2015 |
2016 |
2017 |
2018E |
2019E |
2020E |
2021E |
Source: Company data, Renaissance Capital estimates
|
|
|
Margin, $/oz |
|
|
|
Average margin, $/oz |
|
|
|
||||||
2005 |
2006 |
2007 |
2008 |
2009 |
2010 |
2011 |
2012 |
2013 |
2014 |
2015 |
2016 |
2017 |
2018E |
2019E |
2020E |
2021E |
Source: Bloomberg, Company data, Renaissance Capital estimates
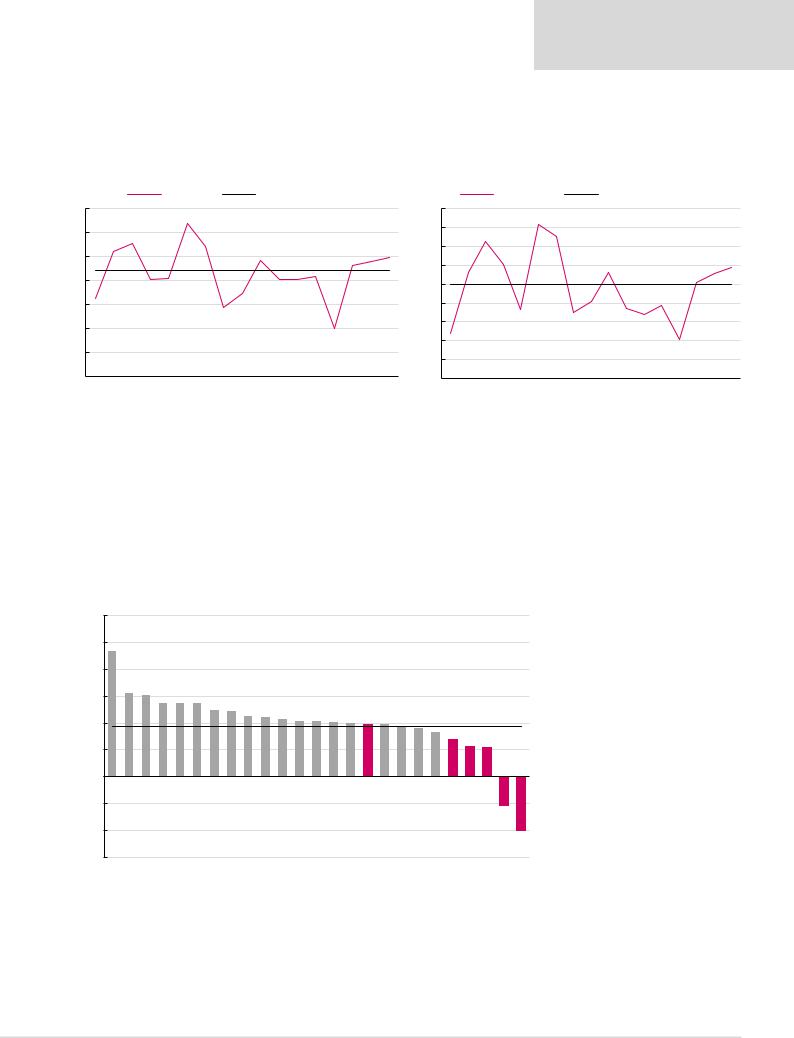
…but yields still uncompelling.
We calculate that most of the PGM miners still screen poorly on near-term FCF yields, due to their high capex commitments, poor cost position or elevated share prices. We believe that in a world where growth expectations are fading due to trade wars, high debt levels and rising interest rates, investors may target companies that screen well on nearterm valuation metrics.
Figure 20: Miners ranked by CY19E FCF yields
30.0%
25.0%
20.0%
15.0%
10.0%
5.0%
0.0% -5.0%
-10.0% -15.0%
23.4%
|
15.4% |
15.2% |
13.7% |
13.7% |
13.7% |
12.4% |
12.2% |
11.2% |
11.0% |
10.6% |
10.4% |
10.3% |
10.0% |
9.9% |
9.8% |
9.7% |
9.3% |
8.9% |
8.3% |
6.8% |
5.6% |
5.5% |
|
|
|
|
|
|
|
|
|
|
|
|
|
|
|
|
|
|
|
|
|
|
Sector average, 9% |
||||
|
|
|
|
|
|
|
|
|
|
|
|
|
|
|
|
|
|
|
|
|
|
|
-5.4% |
|
ARM |
Harmony |
AngloGold |
Alrosa |
Gold Fields |
Exxaro |
Assore |
Anglo |
Polyus |
PhosAgro |
Fortescue |
Sibanye |
Kumba |
South32 |
BHP |
Impala |
Polymetal |
Glencore |
Vale |
Rio Tinto |
Amplats |
Norilsk |
Northam |
Lonmin |
RBPlats-10.0% |
*Priced at market close on 8 January 2019.
Source: Bloomberg, Company data, Renaissance Capital estimates
9
vk.com/id446425943
Renaissance Capital
10 January 2019
Metals & Mining
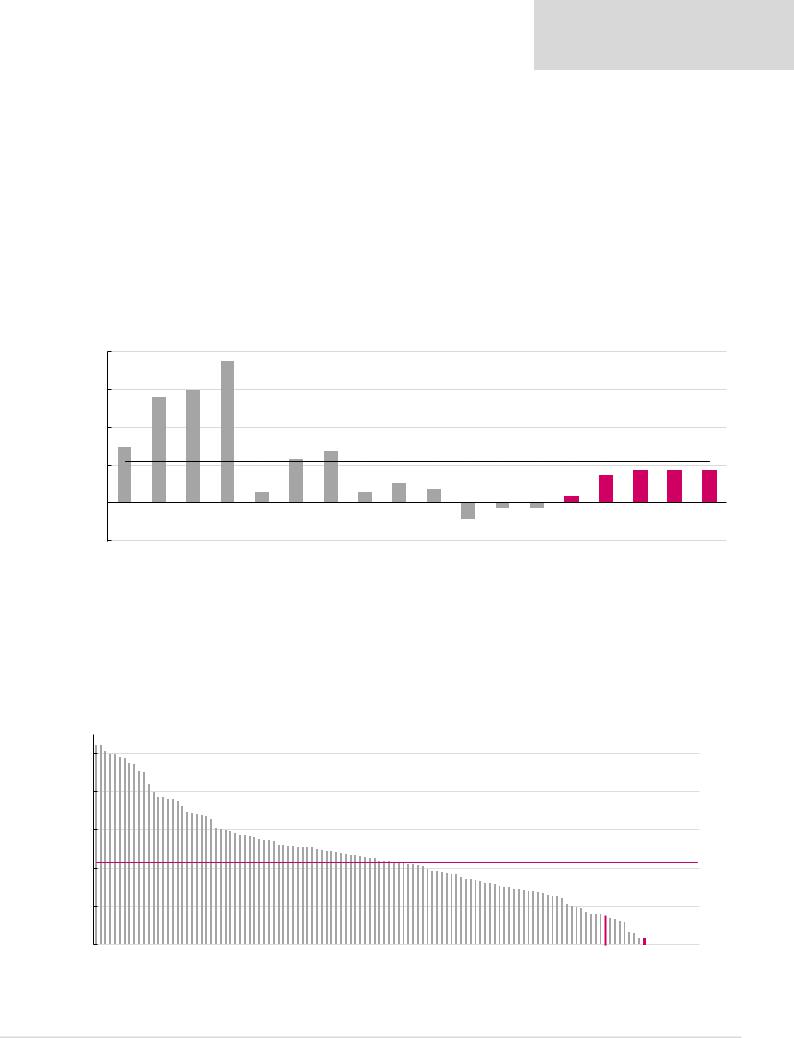
Capital allocation risk on the increase
Improving returns, healthy balance sheets and a lack of commitment to dividends could increase the risk of poor capital allocation, in our view.
We restate the PGM miners’ balance sheets to reflect the replacement cost of productive assets. This eliminates accounting distortions and anomalies such as impairments, revaluations or fully depreciated assets. It also removes capital efficiency discrepancies among companies, as we assume they all pay the same for productive capacity. We forecast returns turning positive in 2018 and recovering back to c. 4% in 2019 (close to their long-term average) on the back of recovering margins. While our long-term returns are still below WACC, we believe rising returns could result in new projects being approved, given the industry’s willingness to invest at value-destructive returns in the hope that PGM prices will recover strongly in the medium-to-long term.
Figure 21: SA PGM sector* average RoE with assets at estimated replacement cost |
|
|
|
|
|
|||
20.0% |
|
18.8% |
|
|
|
|
|
|
|
14.0% |
14.9% |
|
|
|
|
|
|
15.0% |
|
|
|
|
|
|
|
|
|
|
|
|
|
|
|
|
|
10.0% |
7.3% |
|
|
|
|
|
|
|
|
|
6.8% |
|
|
|
|
|
|
|
|
5.8% |
|
|
|
|
|
|
|
|
|
Average RoE, 2005-2017, 5.5% |
4.3% |
4.2% |
4.2% |
||
5.0% |
|
|
|
|
3.6% |
|||
|
|
2.6% |
|
|
|
|
||
|
|
1.4% |
1.8% |
|
|
|
|
|
|
|
1.3% |
0.9% |
|
|
|
||
|
|
|
|
|
|
|||
|
|
|
|
|
|
|
|
|
0.0% |
|
|
|
|
|
|
|
|
|
|
|
|
-0.7% |
-0.8% |
|
|
|
-2.2%
-5.0%
2005 |
2006 |
2007 |
2008 |
2009 |
2010 |
2011 |
2012 |
2013 |
2014 |
2015 |
2016 |
2017 |
2018E |
2019E |
2020E |
2021E |
2022E |
*Five SA PGM miners under coverage.
Source: Company data, Renaissance Capital estimates
We believe investors tend to steer clear of companies with low payout ratios, as this could suggest: 1) management’s desire to spend shareholder cash on potentially low-return acquisitions or projects; and/or 2) a lack of confidence in profitability. Higher dividends reduce the risk of value-destruction through poor capital allocation, in our view
Figure 22: JSE-listed companies ranked by 12M forward consensus dividend yields*
10.0%
8.0%
6.0%
4.0%
2.0%
0.0%
*Priced as at market close on 8 January 2019.
Average dividend yield, 4.3% |
|
Amplats,1.5% |
Sibanye, 0.3% RBPlatt, 0.0% Northam, 0.0% Implats, 0.0% Lonmin, 0.0% |
Source: Thomson Reuters Datastream, Renaissance Capital estimates
10