

Real Estate Watch_181112_watermark
.pdfvk.com/id446425943
Russia
Real Estate
12 November 2018
Equities
Periodical
Real Estate Watch
3Q18; rushing for mortgages and flats
This report launches our quarterly wrap on the operational statistics from the real estate development segment. It saw upbeat volumes in 3Q18, as clients enjoyed a gradual recovery in incomes, the extended offer from homebuilders, a local bottom in mortgage rates, and uncertainties associated with changing regulations. The stock performances overlook that, in our view, with the shares of listed developers down 24% YTD.
The area under construction grew 9% YoY to 131mn sqm, after three flattish quarters.
Mortgage rates lost 45bp YTD to a historical low of 9.4% in September. New issues of RUB 2.07tn in 9mo18 are already greater than for the whole of 2017.
Moscow registered deals went up 35% YoY and 32% YoY in 3Q18 and 9mo18, respectively.
Primary prices increased 9-12% YoY in Moscow and St Petersburg in 3Q18, while the secondary market remained generally flat.
Stock valuations contradict the impressive operations. The market capitalisation discount to NAV is at a historical high of 55-67%.
Maria Kolbina, Equities Analyst
+7 495 663 46 48 // maria.kolbina@vtbcapital.com
Nikolay Kovalev, Equities Analyst
+7 495 287 68 65 // nikolay.kovalev@vtbcapital.com
Alexander Gnusarev, Equities Analyst
+7 495 660 67 99 // Alexander.Gnusarev@vtbcapital.com
Prices cited in the body of this report are as of the last close before, or the close on, 09 Nov 2018 (except where indicated otherwise). VTB Capital analysts update their recommendations periodically as required.
Please refer to the Disclosures section of this report for other important disclosures, including the analyst certification and information as required by EU-MAR. Additional disclosures regarding the subject company(ies) discussed in this report can be found at http://research.vtbcapital.com/ServicePages/Disclosures.aspx.

vk.com/id446425943
Russia
Real Estate
Real Estate Watch
Table of contents |
|
Consumer backdrop: no signs of material improvement......................................................... |
3 |
Supply side: acceleration prior to legislative changes............................................................. |
4 |
Mortgage market: going through the roof.................................................................................. |
5 |
Demand side: fuelled by gradual real incomes recovery and mortgages............................... |
6 |
Residential prices: promising primary trends........................................................................... |
7 |
Valuation....................................................................................................................................... |
8 |
12 November 2018 |
2 |
vk.com/id446425943 |
Real Estate Watch |
Russia |
|
Real Estate |
|
Consumer backdrop: no signs of a material improvement
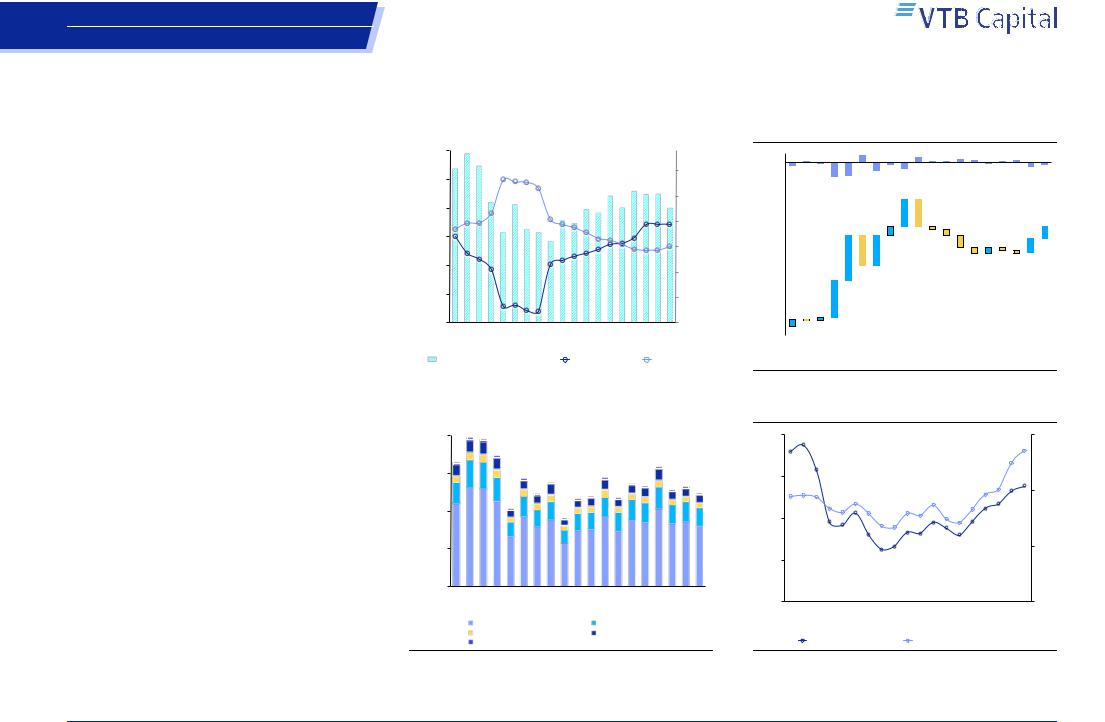
In 3Q18, consumer budgets remained stretched, posting only a gradual recovery from a modest base. Clients remained price-sensitive and highly reactive to promotional activities. Inflation was at 3.0% YoY during the quarter, while the 7.4% YoY advance in real wages reported by Rosstat has not been reflected by the listed constituents of the consumer segment, which reported results worsening from July to September.
USDRUB volatility has direct implications for consumer behaviour in Russia and sales on the residential development segment. The local currency depreciated 11% YoY and 6% QoQ in 3Q18. Clients’ front-loaded inflationary expectations are one reason for the 8.6% YoY growth in the non-food retail categories vs. 3.2% YoY for food turnover.
Residential sales were solid in 3Q18, with primary deals in Russia up 6% YoY. Among the key support factors, we highlight the gradual recovery in consumption, accelerating sales launches, the bottom in mortgage rates having been tested, and FX volatility. Across listed names, blended sales surged 25% YoY as the largest players reacted rapidly to the favourable trend.
Figure 1: Wages* and inflation
|
960 |
941 |
874 |
|
|
|
|
|
|
|
|
|
|
|
|
|
|
|
|
|
|
|
|
|
|
|
|
|
|
858 |
|
|
|
|
|
|
|
|
|
|
|
|
|
|
|
|
|
|
|
|
|
|
|
18% |
|||
|
|
|
|
|
|
|
|
|
|
|
|
|
|
|
|
|
|
|
|
|
|
|
|
|
|
|||
|
800 |
|
|
|
|
|
|
|
|
|
|
|
|
|
|
|
|
|
|
|
|
|
|
|
|
|
||
|
|
|
|
|
|
|
|
|
|
|
|
|
|
|
|
|
|
|
|
|
|
732715717 |
|
|
|
|||
|
|
|
|
|
672 |
|
|
659 |
|
|
|
|
|
|
|
|
|
705 |
|
|
13% |
|||||||
|
640 |
|
|
|
|
|
|
|
|
|
|
632612 |
|
|
640 |
|
|
639 |
||||||||||
|
|
|
|
|
|
|
|
|
|
|
|
|
|
|
|
|
|
|
|
|
||||||||
|
|
|
|
|
|
|
|
|
|
|
|
568 |
553 |
|
|
|
|
|
|
|
|
|||||||
USD |
|
|
|
|
|
|
503 |
|
521 |
503 |
|
|
|
|
|
|
|
|
|
7.4% |
8% |
|||||||
|
|
|
|
|
|
|
|
|
|
|
|
|
|
|
|
|
|
|
|
|
||||||||
480 |
|
|
|
|
|
|
|
|
455 |
|
|
|
|
|
|
|
|
|
|
|
|
|
|
YoY |
||||
|
|
|
|
|
|
|
|
|
|
|
|
|
|
|
|
|
|
|
|
|
|
3.0% |
|
|||||
|
|
|
|
|
|
|
|
|
|
|
|
|
|
|
|
|
|
|
|
|
|
|
|
|
|
|
3% |
|
|
320 |
|
|
|
|
|
|
|
|
|
|
|
|
|
|
|
|
|
|
|
|
|
|
|
|
|
-2% |
|
|
|
|
|
|
|
|
|
|
|
|
|
|
|
|
|
|
|
|
|
|
|
|
|
|
|
|
||
|
160 |
|
|
|
|
|
|
|
|
|
|
|
|
|
|
|
|
|
|
|
|
|
|
|
|
|
-7% |
|
|
|
|
|
|
|
|
|
|
|
|
|
|
|
|
|
|
|
|
|
|
|
|
|
|
|
|
||
|
0 |
|
|
|
|
|
|
|
|
|
|
|
|
|
|
|
|
|
|
|
|
|
|
|
|
|
-12% |
|
|
1Q14 |
2Q14 |
3Q14 |
4Q14 |
1Q15 |
2Q15 |
3Q15 |
|
4Q15 |
1Q16 |
2Q16 |
3Q16 |
4Q16 |
1Q17 |
2Q17 |
3Q17 |
4Q17 |
1Q18 |
2Q18 |
3Q18 |
|
|
||||||
|
Average monthly salary (lhs) |
Real wage (rhs) |
|
CPI (rhs) |
|
|||||||||||||||||||||||
|
|
|
|
|
|
|
|
|
|
|
|
|
|
|
|
|||||||||||||
Source: Rosstat, VTB Capital Research |
|
|
|
|
|
|
|
|
|
|
|
|
|
|
|
|||||||||||||
-* Accrued monthly nominal wages of employees of organizations |
|
|
|
|
||||||||||||||||||||||||
Figure 3: Monthly average income per capita* |
|
|||||||||||||||||||||||||||
|
800 |
780 774 |
|
|
|
|
|
|
|
|
|
|
|
|
|
|
|
|
|
|
|
|
|
|
|
|||
|
651 |
|
|
|
686 |
|
|
|
|
|
|
|
|
|
|
|
|
|
|
|
|
|
|
|
|
|
||
|
|
|
|
|
|
|
|
|
|
|
|
|
|
|
|
|
|
|
|
|
|
|
627 |
|
|
|||
|
|
|
|
|
|
|
|
|
|
|
|
|
|
|
|
|
|
|
|
|
|
|
|
|
|
|
||
|
600 |
|
|
|
|
|
|
|
|
565 |
|
|
546 |
|
|
|
|
|
570 |
|
|
539 525 |
|
|
522 |
|
||
|
|
|
|
|
|
|
|
|
|
|
485 |
|
|
|
|
|
|
|
|
|
|
506 |
489 |
|||||
|
|
|
|
|
|
|
|
|
|
|
|
|
459 471 |
|
|
463 |
|
|
|
|
||||||||
|
|
|
|
|
|
|
|
|
|
|
|
|
|
|
|
|
|
|
|
|||||||||
|
|
|
|
|
|
|
|
|
|
|
|
|
|
|
|
|
|
|
|
|
|
|
||||||
USD |
400 |
|
|
|
|
|
|
405 |
|
|
|
|
|
|
|
|
|
|
|
|
|
|
|
|
|
|
|
|
|
|
|
|
|
|
|
|
|
|
|
|
356 |
|
|
|
|
|
|
|
|
|
|
|
|
|
|||
|
|
|
|
|
|
|
|
|
|
|
|
|
|
|
|
|
|
|
|
|
|
|
|
|
|
|
|
|
|
200 |
|
|
|
|
|
|
|
|
|
|
|
|
|
|
|
|
|
|
|
|
|
|
|
|
|
|
|
|
0 |
|
|
|
|
|
|
|
|
|
|
|
|
|
|
|
|
|
|
|
|
|
|
|
|
|
|
|
|
1Q14 |
2Q14 |
3Q14 |
4Q14 |
1Q15 |
2Q15 |
3Q15 |
4Q15 |
1Q16 |
2Q16 |
3Q16 |
4Q16 |
1Q17 |
2Q17 |
3Q17 |
4Q17 |
1Q18 |
2Q18 |
3Q18 |
|||||||||
|
|
|
|
Labour renumeration |
|
|
|
|
|
Social Transfer |
|
|
|
|
||||||||||||||
|
|
|
|
Property |
|
|
|
|
|
|
|
|
|
|
Entrepreneurial Activities |
|
||||||||||||
|
|
|
|
Others |
|
|
|
|
|
|
|
|
|
|
|
|
|
|
|
|
|
|
|
|
|
|||
Source: Rosstat, VTB Capital Research
-*Includes gains of persons engaged in entrepreneurial business activity, paid remuneration of employees, social transfers (pensions, grants, benefits, insurance compensations), property income in the form of deposits, securities, dividends and other income.
2 USDRUB, quarterly
90 |
0% |
|
|
|
|
|
|
|
|
16% |
|
|
|
|
|
12% 2% 2% 7% 3% |
|
1% 3% |
|
|
|
|
|
|
||||||||||||
-8% |
|
|
|
-4% |
|
|
|
|
|
|
|
|
-20% |
-4%-13% |
|
|
|
|
|
|
-4% |
|
|
-9% -6% |
||||||||||||
|
|
|
|
|
-32%-31% |
|
|
|
|
|
|
|
|
|
|
|
|
|
|
|
|
|
|
|
|
|||||||||||
|
|
|
|
|
|
|
|
|
|
|
|
|
|
|
|
|
|
|
|
|
|
|
|
|
|
|
|
|
||||||||
75 |
|
|
|
|
|
|
|
|
|
|
|
|
|
|
|
|
|
|
75 |
|
|
|
|
|
|
|
|
|
|
|
|
|
|
|
|
|
|
|
|
|
|
|
|
|
63 |
|
|
63 |
66 |
|
|
|
|
|
|
|
|
|
|
|
|
|
|
|
66 |
||||||||
|
|
|
|
|
|
|
|
|
|
|
|
|
|
|
|
|
|
|
|
|
|
|
|
|
|
|||||||||||
|
|
|
|
|
|
|
|
|
|
|
|
|
|
|
|
|
|
|
|
|
|
|
|
|
|
|
|
|||||||||
|
|
|
|
|
|
|
|
|
|
|
|
|
|
66 |
65 |
|
|
|
|
|
|
62 |
|
|
|
|||||||||||
60 |
|
|
|
|
|
|
|
|
|
|
|
|
|
|
|
|
|
|
|
|
|
|
|
|
63 |
59 |
|
59 |
|
|
|
|
|
|
|
|
|
|
|
|
|
|
|
|
|
|
|
|
|
|
|
|
|
|
|
|
|
|
|
|
|
|
|
|
|
|
|
|
|
||||
|
|
|
|
|
|
|
|
|
|
|
|
|
|
|
|
|
|
|
|
|
|
|
|
|
|
|
|
|
|
|
|
|
|
|||
|
|
|
|
|
|
|
|
|
|
|
|
|
|
|
|
|
|
|
|
|
|
|
|
|
|
57 |
|
58 |
57 |
|
|
|
|
|
|
|
|
|
|
|
|
|
|
|
|
|
|
|
|
|
|
|
|
|
|
|
|
|
|
|
|
|
|
|
|
|
|
|
|
||||
|
|
|
|
|
|
|
|
|
|
|
|
|
|
|
|
|
|
|
|
|
|
|
|
|
|
|
|
|
|
|
|
|
|
|
|
|
|
|
|
|
|
48 |
|
|
|
|
53 |
|
|
|
|
|
|
|
|
|
|
|
|
|
|
|
|
|
|
|
|
|
|
|
|||
|
|
|
|
|
|
|
|
|
|
|
|
|
|
|
|
|
|
|
|
|
|
|
|
|
|
|
|
|
|
|
|
|
||||
45 |
|
|
|
|
|
|
|
|
|
|
|
|
|
|
|
|
|
|
|
|
|
|
|
|
|
|
|
|
|
|
|
|
|
|
|
|
35 |
|
|
|
36 |
|
|
|
|
|
|
|
|
|
|
|
|
|
|
|
|
|
|
|
|
|
|
|
|
|
|
|
|
|
|
|
|
|
|
|
|
|
|
|
|
|
|
|
|
|
|
|
|
|
|
|
|
|
|
|
|
|
|
|
|
|
|
|
|
|
|
|
|
|
30 |
35 |
|
|
|
|
|
|
|
|
|
|
|
|
|
|
|
|
|
|
|
|
|
|
|
|
|
|
|
|
|
|
|
|
|
||
|
|
|
|
|
|
|
|
|
|
|
|
|
|
|
|
|
|
|
|
|
|
|
|
|
|
|
|
|
|
|
|
|
||||
|
|
|
|
|
|
|
|
|
|
|
|
|
|
|
|
|
|
|
|
|
|
|
|
|
|
|
|
|
|
|
|
|
|
|
|
|
1Q14 |
2Q14 |
3Q14 |
4Q14 |
1Q15 |
2Q15 |
3Q15 |
4Q15 |
1Q16 |
2Q16 |
3Q16 |
4Q16 |
1Q17 |
2Q17 |
3Q17 |
4Q17 |
1Q18 |
2Q18 |
3Q18 |
||||||||||||||||||
Source: Bloomberg, VTB Capital Research
Figure 4: Oil prices
120 |
108 |
112 |
|
|
|
|
|
|
|
|
|
|
|
|
|
|
|
|
5.4 |
6 |
|
|
|
|
|
|
|
|
|
|
|
|
|
|
|
|
|
|
|||
|
|
|
|
|
|
|
|
|
|
|
|
|
|
|
|
|
|
5.0 |
|
|
90 |
|
|
|
95 |
|
|
|
|
|
|
|
|
|
|
|
|
|
|
|
|
3.8 |
3.8 |
3.7 |
|
3.5 |
|
|
|
|
|
|
|
|
|
3.8 4.0 |
79 |
83 |
4 |
|||
|
|
|
|
3.3 |
3.2 |
3.2 |
|
|
3.2 |
|
3.5 |
|
|
3.3 |
67 |
70 |
|
|
|
|
60 |
|
|
|
64 |
|
|
|
57 |
3.0 |
2.8 |
|
|
|
|
||||||
|
|
|
57 |
55 |
|
|
2.7 |
2.7 |
|
3.1 |
58 |
|
|
|
|
|
||||
|
|
|
|
|
|
|
48 |
|
|
50 |
49 |
|
53 |
48 |
|
|
|
|
|
|
|
|
|
|
|
|
|
|
|
|
|
|
|
|
|
|
|
||||
|
|
|
|
|
|
|
|
37 |
40 |
|
|
|
|
|
|
|
|
|
|
2 |
|
|
|
|
|
|
|
|
|
|
|
|
|
|
|
|
|
|
|
|
|
30 |
|
|
|
|
|
|
|
|
|
|
|
|
|
|
|
|
|
|
|
|
0 |
1Q14 |
2Q14 |
3Q14 |
4Q14 |
1Q15 |
2Q15 |
3Q15 |
4Q15 |
1Q16 |
2Q16 |
3Q16 |
4Q16 |
1Q17 |
2Q17 |
3Q17 |
4Q17 |
1Q18 |
2Q18 |
3Q18 |
0 |
|
|
|||||||||||||||||||
|
|
Brent Oil, USD (lhs) |
|
Brent Oil, 000'RUB (rhs) |
|
|
||||||||||||||
Source: Bloomberg, VTB Capital Research
12 November 2018 |
3 |
vk.com/id446425943 |
Real Estate Watch |
Russia |
Real Estate
Supply side: acceleration prior to legislative changes |
|
|
|
|
|
|
||||||||||||||||||
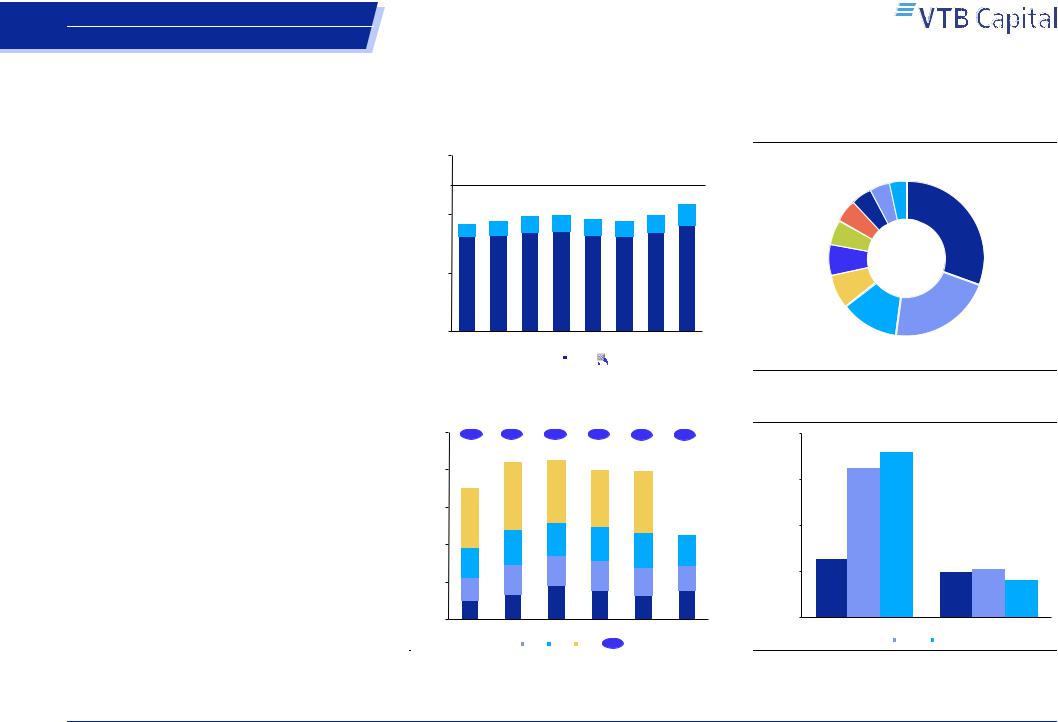
The upcoming |
regulatory changes concerning |
the |
Figure 5: Area under construction in Russia |
|
|
|
||||||||||||||||||
ability to collect client funds during the construction |
|
|
|
|||||||||||||||||||||
|
|
|
|
|
|
|
|
|
|
|
|
|
|
|
|
|||||||||
stage and the |
implementation of |
escrow |
accounts |
|
180 |
6% |
|
10% |
14% |
15% |
|
|
|
9% |
|
|
||||||||
have pushed developers to pre-secure the construction |
|
|
|
|
|
4% |
|
|
|
|
||||||||||||||
|
|
|
|
|
|
|
|
0% |
1% |
|
|
|
||||||||||||
|
|
|
|
|
|
|
|
|
|
|
|
|
||||||||||||
pipeline |
and |
attain additional construction permits. |
|
|
|
|
|
|
|
|
|
|
|
|
|
|
||||||||
|
|
|
|
|
|
|
|
|
|
|
|
|
131 |
|
|
|||||||||
Coupled |
with |
the |
pick-up in residential demand, |
the |
|
|
|
|
|
|
|
|
|
|
|
|
|
|
|
|||||
|
120 |
111 |
|
114 |
119 |
120 |
115 |
114 |
120 |
17% |
|
|
||||||||||||
trend saw the area under construction advance 9% |
|
|
14% |
15% |
15% |
|
|
|||||||||||||||||
mn sqm |
12% |
|
14% |
15% |
15% |
|
|
|
||||||||||||||||
YoY in 3Q18, following three flattish quarters. We also |
|
|
|
|
|
|
|
|||||||||||||||||
|
|
|
|
|
|
|
|
|
|
|
|
|
|
|||||||||||
observed certain market consolidation as the top-10 |
|
|
|
|
|
|
|
|
|
|
|
|
|
|
||||||||||
increased their share of the area currently under |
|
60 |
|
|
|
|
|
|
|
|
|
|
|
83% |
|
|
||||||||
construction to 17%, from 15% last year. |
|
|
|
|
88% |
|
86% |
86% |
85% |
85% |
85% |
85% |
|
|
||||||||||
|
|
|
|
|
|
|
|
|||||||||||||||||
9mo18 completions were down 2% YoY at 45mn sqm, |
|
|
|
|
|
|
|
|
|
|
|
|
|
|
|
|
||||||||
primarily reflecting the unimpressive sales of 2015-16 at |
|
0 |
|
|
|
|
|
|
|
|
|
|
|
|
|
|
||||||||
a time of pressured consumer budgets and a high |
|
4Q16 |
1Q17 |
2Q17 |
3Q17 4Q17 1Q18 2Q18 3Q18 |
|
||||||||||||||||||
|
|
|
||||||||||||||||||||||
interest rate environment. Moscow was less impacted |
|
|
|
|
Top-10 developers |
Other Chng, YoY |
|
|
|
|||||||||||||||
|
|
|
|
|
|
|
||||||||||||||||||
|
|
|
|
|
|
|
||||||||||||||||||
by the downbeat trends and observed an improvement |
|
|
|
|
|
|
|
|
||||||||||||||||
Source: United registry of homebuilders, VTB Capital Research |
|
|
|
|||||||||||||||||||||
early, overall printing 20% YoY advance in YTD |
|
|
|
|
|
|
|
|
|
|
|
|
|
|
|
|
||||||||
completions. |
For |
2018, the ministry of construction |
Figure 7: Residential completions |
|
|
|
|
|
||||||||||||||||
estimates the country’s commissioning reaching 82- |
|
|
|
|
|
|||||||||||||||||||
|
|
|
|
|
|
|
|
|
|
|
|
|
|
|
|
|||||||||
|
100 |
|
|
|
|
|
|
|
|
|
|
|
|
|
|
|||||||||
84mn sqm, a recovery of some 5% YoY. |
|
|
|
7% |
19% |
1% |
-6% |
|
-1% |
-2% |
|
|
||||||||||||
|
|
|
|
|
|
|
||||||||||||||||||
In |
Moscow, |
|
the |
mass-market |
segment |
saw |
an |
|
|
|
|
|
84 |
|
85 |
80 |
|
79 |
|
|
|
|||
|
|
80 |
|
|
|
|
|
|
|
|
|
|
|
|
||||||||||
acceleration in the supply and share of unsold flats in |
|
70 |
|
|
|
|
|
|
|
|
|
|
|
|
||||||||||
|
|
|
36 |
|
|
31 |
|
|
|
|
|
|||||||||||||
the commissioned estates increased to 35%, from 30% |
|
|
|
|
|
|
33 |
|
|
|
|
|
||||||||||||
|
|
|
|
|
|
|
|
|
|
|
|
|
|
|
|
|
|
|
|
|
|
|
|
|
a year ago, according to the latest IRN data. For the |
sqm |
60 |
|
|
|
|
|
|
|
|
|
|
33 |
|
|
|
||||||||
32 |
|
|
|
|
|
|
|
|
|
|
|
|
||||||||||||
City, developers got 21mn sqm pre-approved estates |
|
|
|
|
|
|
|
|
|
|
45 |
|
|
|||||||||||
|
|
|
|
|
|
|
|
|
|
|
|
|
||||||||||||
mn |
|
|
|
|
|
|
|
|
|
|
|
|
|
|
||||||||||
to |
build |
in-line |
with previous legislation, backing |
the |
40 |
|
|
|
19 |
|
18 |
18 |
|
|
|
|
|
|||||||
|
|
|
|
|
|
|
|
|
|
|
|
|
|
|
|
|
|
|
|
|
16 |
|
|
|
pipeline for 5-6 years. |
|
|
|
|
|
|
|
|
|
|
|
|
|
|
|
18 |
|
|
||||||
|
|
|
|
|
16 |
|
|
|
|
|
|
|
|
|
|
|
|
|||||||
|
|
|
|
|
|
|
|
|
|
|
|
|
|
|
|
16 |
|
|
|
|
|
|
||
|
|
|
|
|
|
|
|
|
|
20 |
|
|
|
16 |
|
16 |
|
15 |
13 |
|
|
|||
|
|
|
|
|
|
|
|
|
|
|
|
|
|
|
|
|
|
|||||||
|
|
|
|
|
|
|
|
|
|
12 |
|
|
|
|
|
|
|
|||||||
|
|
|
|
|
|
|
|
|
|
|
|
|
|
|
|
|
|
|
|
|
|
|
||
|
|
|
|
|
|
|
|
|
|
|
10 |
|
14 |
|
18 |
16 |
|
13 |
16 |
|
|
|||
|
|
|
|
|
|
|
|
|
|
0 |
|
|
|
|
|
|
||||||||
|
|
|
|
|
|
|
|
|
|
2013 |
2014 |
2015 |
2016 |
|
2017 |
9m18 |
|
|||||||
|
|
|
|
|
|
|
|
|
|
|
|
|
||||||||||||
|
|
|
|
|
|
|
|
|
|
|
|
|
|
|
|
1Q |
2Q |
3Q |
4Q |
Chng, YoY |
|
|
|
|
|
|
|
|
|
|
|
|
|
|
|
|
|
|
|
|
|
|
|
||||||
|
|
|
|
|
|
|
|
|
|
|
|
|
|
|
|
|
|
|
||||||
Source: Rosstat, VTB Capital Research
Figure 6: Top-10 developers, September 2018*
Etalon,MR Group,
FSK Lider, 0.9 0.8
1.0
PIK, 6.9
Samolet, 1.1
Glavstroi, 1.2
1.5 |
23mn sqm |
Ugstroiinvest, |
|
CDS, 1.6 |
|
LSR, 4.9
Setl Group, 2.7
Source: United registry of homebuilders, VTB Capital Research -*Area under construction, mn sqm
Figure 8: Sales launches of listed developers*
2,000
1,808
|
1,633 |
|
|
|
||
|
1,500 |
|
|
|
|
|
sqm |
1,000 |
|
|
|
|
|
000 |
|
|
|
|
|
|
|
|
|
|
|
|
|
|
644 |
|
|
|
|
532 |
|
500 |
|
|
|
507 |
|
|
|
|
|
|
415 |
|
|
0 |
PIK |
|
|
LSR |
|
|
|
|
|
|||
|
|
|
9m16 |
9m17 |
9m18 |
|
|
|
|
|
|||
|
|
|
|
|||
Source: Company data, VTB Capital Research *-not disclosed by Etalon
12 November 2018 |
4 |

vk.com/id446425943 |
Real Estate Watch |
Russia |
|
Real Estate |
|
Mortgage market: going through the roof
The key rate in Russia had declined 25bp YTD to 7.5% as of September 2018. The mortgage rate followed the path and reached a record low blended level of 9.4% in 3Q18. The spread between the two rates has stabilised at 190bp lately and we see this as sustainable in the medium term.
The local bottom in the mortgage rates and clients’ view on the limited further easing sparked new mortgage origination in 9mo18. The total value surged 61% YoY to RUB 2tn, thus already overtaking the total figure for 2017. The market is consolidated: Sberbank and VTB accounted for 66% and 70%, respectively, of new issues in 3Q18 and 9mo18.
The share of credit sales in the results of public homebuilders has also reached an unmatched level of 55-65% in the mass-market segment. We see the share as capped at 80%, i.e. the level observed for peers at the developed markets.
Figure 9: Mortgage blended rate vs. key rate
15% |
|
|
|
|
|
15.3% |
|
|
|
|
|
|
|
|
|
|
|
|
|
|
||||
|
|
|
|
|
|
|
|
|
|
|
|
|
|
|
|
|
|
|
|
|
|
|
|
|
|
|
|
12.4% |
|
|
|
|
13.1% |
13.0% |
|
|
|
|
|
|
|
|
|||||||
|
|
|
|
|
|
|
|
|
|
|
|
|
11.8% |
|
|
|
|
|
||||||
|
|
|
|
|
|
|
|
|
|
|
11.2% |
|
|
|
|
|
|
|
|
|||||
|
|
|
|
|
|
|
|
|
|
|
10.8% |
|
|
|
10.5% |
|
|
|||||||
|
|
|
|
|
|
|
|
|
|
|
|
|
|
|
|
|
|
|
||||||
|
|
|
|
|
|
|
|
|
|
|
|
|
|
|
|
|
9.9% |
|
|
|||||
10% |
|
|
|
|
|
|
|
|
|
|
|
|
|
|
|
|
|
|
|
9.5% |
||||
|
|
|
|
|
|
|
|
|
|
|
|
|
|
|
|
|
|
|
8.8% |
|
||||
|
|
|
|
|
|
|
|
|
|
|
|
|
|
|
|
|
|
|
|
|
|
|
||
|
8.0% |
|
|
|
|
|
|
|
|
|
|
|
|
|
|
|
|
|
|
7.5% |
||||
|
|
|
|
|
|
|
|
|
|
|
|
|
|
|
|
|
|
|
|
|
|
|
||
5% |
|
|
|
|
|
|
|
|
|
|
|
|
|
|
|
|
|
|
|
|
|
|
|
|
1Q14 |
2Q14 |
3Q14 |
4Q14 |
1Q15 |
2Q15 |
3Q15 |
4Q15 |
1Q16 |
2Q16 |
3Q16 |
4Q16 |
1Q17 |
2Q17 |
3Q17 |
4Q17 |
1Q18 |
2Q18 |
3Q18 |
||||||
|
|
|
|
|
|
|
|
|
Mortgage rate |
Key rate |
|
|
|
|
|
|
||||||||
Source: CBR, VTB Capital Research |
|
|
|
|
|
|
|
|
|
|
|
|
||||||||||||
Figure 11: Share of mortgages in sales |
|
|
|
|
||||||||||||||||||||
70% |
|
|
|
|
|
|
|
|
|
|
|
|
|
|
|
|
|
|
|
|
64% 66% 64% 65% |
|||
60% |
|
|
|
|
|
|
|
|
|
|
|
|
|
|
|
|
|
|
59% 60% |
|
|
|
56% |
|
|
|
|
|
|
|
|
|
|
|
|
|
|
|
|
|
55% 54% |
|
|
|
54% |
|
|||
|
|
|
|
|
|
|
|
|
|
|
|
|
|
|
|
|
52% |
|
|
|
|
|||
|
|
|
|
|
|
|
|
|
|
|
|
|
|
|
49% |
50% |
|
|
|
|
|
|
|
|
50% |
|
|
|
|
|
|
|
|
|
|
|
|
|
|
|
|
|
|
47% |
|
52% |
|
||
|
43% |
|
|
|
|
|
|
44% 42% |
|
45% |
|
45% |
|
45% |
|
45% |
|
|
||||||
|
|
|
|
|
|
|
|
|
|
|
|
|
|
42% |
|
|||||||||
41% |
40% |
|
|
|
|
41% |
|
|
|
|
|
|
41% |
40% |
41% |
|||||||||
40% |
|
|
|
|
|
|
|
39% |
|
|
|
|
|
|
|
|
|
|||||||
|
|
|
35% |
|
|
|
|
|
37% |
32% 34% 34% |
|
42% |
|
33% |
35% |
|
|
|
|
|||||
37% 37% |
32% |
|
|
|
|
|
|
|
|
|
|
|
|
|||||||||||
|
|
|
|
|
|
|
|
|
|
|
|
|
|
|
|
|
|
|
|
|
||||
30% |
|
23% |
28% |
23% 25% |
|
|
|
|
|
21% 22% 23% |
|
|
|
|
|
|
|
|||||||
20% |
|
|
|
20% |
|
|
20% |
|
|
|
|
|
|
|
||||||||||
|
|
|
|
|
|
|
|
|
|
|
|
|
|
|
|
|
|
|
|
|
||||
|
|
|
|
|
22% 22% |
|
|
|
|
|
|
|
|
22% |
|
|
|
|
|
|
||||
17% |
|
|
|
|
|
|
|
|
|
15% 15% |
|
|
|
|
|
|
|
|
|
|
||||
10% |
|
|
|
|
|
|
|
|
|
|
|
|
|
|
|
|
|
|
|
|
||||
|
|
|
|
|
|
|
11% |
|
|
|
|
|
|
|
|
|
|
|
|
|
|
|
||
|
|
|
|
|
|
|
|
|
|
|
|
|
|
|
|
|
|
|
|
|
|
|
||
0% |
|
|
|
|
|
|
|
|
|
|
|
|
|
|
|
|
|
|
|
|
|
|
|
|
1Q14 |
2Q14 |
3Q14 |
4Q14 |
1Q15 |
2Q15 |
3Q15 |
|
4Q15 |
1Q16 |
2Q16 |
3Q16 |
4Q16 |
1Q17 |
2Q17 |
3Q17 |
4Q17 |
1Q18 |
2Q18 |
3Q18 |
|||||
|
|
|
|
|
|
|
|
|
|
PIK |
|
|
LSR |
Etalon |
|
|
|
|
|
|
||||
Source: Company data, VTB Capital Research |
|
|
|
|
|
|
|
|
|
|||||||||||||||
Figure 10: Mortgage origination |
|
|
|
|
|
|
|
||||||||||||||||
|
|
|
2,400 |
|
32% |
|
31% |
|
-34% |
|
27% |
|
37% |
61% |
|
||||||||
|
|
|
|
|
|
|
|
|
|
|
|||||||||||||
|
|
|
|
|
|
|
|
|
|
|
|
|
|
|
|
|
2,021 |
2,071 |
|
||||
|
|
|
|
|
|
|
|
|
|
|
|
|
|
|
|
|
|
|
|
||||
|
|
|
1,800 |
|
|
|
|
1,753 |
|
|
|
|
|
|
|
|
|
761 |
|
||||
|
|
|
|
|
|
|
|
|
|
|
|
|
|
|
1,472 |
|
736 |
|
|||||
|
|
|
|
|
|
|
|
|
|
|
|
|
|
|
|
|
|
|
|||||
|
|
|
|
|
|
1,339 |
|
538 |
|
|
|
|
|
|
|
|
|
|
|||||
|
bn |
|
|
|
|
|
|
|
|
|
|
|
|
|
|
|
|
||||||
|
|
|
|
|
|
|
|
|
|
|
|
|
|
|
|
|
|
|
|||||
|
1,200 |
|
|
|
|
|
|
|
1,158 |
|
446 |
|
|
|
|
|
|
||||||
|
RUB |
|
444 |
|
|
|
|
|
|
|
|
|
|
|
|||||||||
|
|
|
|
|
450 |
|
|
|
|
|
|
|
513 |
|
|
|
|||||||
|
|
|
|
|
|
|
|
|
|
|
|
|
|
|
|
|
|||||||
|
|
|
|
|
|
|
|
|
|
399 |
|
|
|
|
727 |
|
|||||||
|
|
|
|
|
|
|
|
|
|
|
362 |
|
|
|
|
||||||||
|
|
|
|
|
|
359 |
|
|
|
|
|
|
|
|
|
|
|
|
|
||||
|
|
|
600 |
|
|
|
|
|
300 |
|
|
|
|
|
|
|
|
|
|||||
|
|
|
|
|
|
|
433 |
|
|
341 |
|
452 |
|
|
|
||||||||
|
|
|
|
|
|
|
|
|
|
|
|
|
|
|
|
|
|||||||
|
|
|
|
|
|
311 |
|
|
|
|
|
|
|
|
|
|
|
|
|
||||
|
|
|
|
|
|
|
|
|
|
242 |
|
|
|
|
|
|
582 |
|
|||||
|
|
|
|
|
|
|
|
|
|
|
|
|
|
|
|
|
|
|
|||||
|
|
|
|
|
|
|
|
|
333 |
|
|
|
|
323 |
|
321 |
|
||||||
|
|
|
|
|
|
224 |
|
|
217 |
|
|
|
|
|
|||||||||
|
|
|
|
0 |
|
|
|
|
|
|
|
|
|
|
|
|
|
|
|||||
|
|
|
|
|
2013 |
|
2014 |
|
2015 |
|
2016 |
2017 |
9m18 |
|
|||||||||
|
|
|
|
|
|
|
|
|
|
||||||||||||||
|
|
|
|
|
|
|
|
1Q |
2Q |
3Q |
4Q |
|
Chng, YoY |
|
|
||||||||
|
|
|
|
|
|
|
|
|
|
|
|||||||||||||
|
|
|
|
|
|
|
|
|
|
|
|||||||||||||
|
|
|
|
|
|
|
|
|
|
|
|
|
|
|
|
||||||||
Source: CBR, VTB Capital Research |
|
|
|
|
|
|
|
|
|
|
|
|
|||||||||||
Figure 12: Mortgage availability |
|
|
|
|
|
|
|
||||||||||||||||
45 |
68% |
|
67% 66% |
70% |
|
|
|
|
|
|
|
|
|
|
|
|
44 |
|
70% |
||||
|
|
|
65% |
63% |
|
|
|
|
|
|
|
43 |
41 |
42 |
|||||||||
|
|
|
|
|
|
|
|
|
62% |
|
40 59% |
40 |
|
|
|
|
|||||||
|
|
|
|
65% |
|
|
|
|
|
59% |
|
|
|
|
|
||||||||
|
|
|
|
|
|
|
63% |
|
|
|
37 |
38 |
|
|
|
|
60% |
||||||
36 |
|
|
|
|
|
|
|
|
36 |
|
36 |
|
|
|
|
|
|||||||
|
|
|
|
|
35 |
|
|
34 57% |
|
|
53% |
|
|
|
|
||||||||
|
33 |
|
|
|
33 |
33 |
|
|
|
|
|
|
|
|
|||||||||
30 |
32 |
32 |
32 |
|
52% |
52% |
|
|
49% |
|
49% |
50% |
|||||||||||
|
|
|
|
|
|
|
|
|
|
|
|
|
|
|
|
|
|
||||||
27 |
|
|
|
|
|
|
|
|
|
|
|
|
|
|
|
47% |
|
46% |
|
40% |
|||
|
|
|
|
|
|
|
|
|
|
|
|
|
|
|
|
|
|
||||||
000'RUB18 |
|
|
|
|
22 |
22 |
|
|
|
|
|
|
|
|
|
|
|
|
|
||||
20 |
21 |
21 |
21 |
21 |
21 |
21 |
21 |
21 |
21 |
21 |
21 |
20 |
20 |
20 |
20 |
21 |
30% |
||||||
|
|
|
|||||||||||||||||||||
|
|
|
|
|
|
|
|
|
|
|
|
|
|
|
|
||||||||
|
|
|
|
|
|
|
|
|
|
|
|
|
|
|
|
|
|
|
|
|
|
||
|
|
|
|
|
|
|
|
|
|
|
|
|
|
|
|
|
|
|
|
|
|
20% |
|
9 |
|
|
|
|
|
|
|
|
|
|
|
|
|
|
|
|
|
|
|
10% |
|||
|
|
|
|
|
|
|
|
|
|
|
|
|
|
|
|
|
|
|
|
|
|
||
0 |
1Q14 |
2Q14 |
3Q14 |
4Q14 |
1Q15 |
2Q15 |
3Q15 |
4Q15 |
1Q16 |
2Q16 |
3Q16 |
4Q16 |
1Q17 |
2Q17 |
3Q17 |
4Q17 |
1Q18 |
2Q18 |
3Q18 |
0% |
|||
|
|
|
|
||||||||||||||||||||
|
|
Average monthly payment (lhs) |
|
|
Average monthly salary (lhs) |
|
|||||||||||||||||
|
|
|
|
|
|||||||||||||||||||
|
|
Payment as % of average salary (rhs) |
|
|
|
|
|
|
|
|
|
|
|||||||||||
|
|
|
|
|
|
|
|
|
|
|
|
|
|
|
|
|
|
||||||
Source: |
|
VTB Capital Research |
|
|
|
|
|
|
|
|
|
|
|
|
|||||||||
12 November 2018 |
5 |
vk.com/id446425943 |
Real Estate Watch |
Russia |
Real Estate
Demand side: fuelled by a gradual recovery in real incomes and mortgages |
|
|
|
|
|
|
|
|
|
|
|
|
|
|||||||||||||||||||||||||||
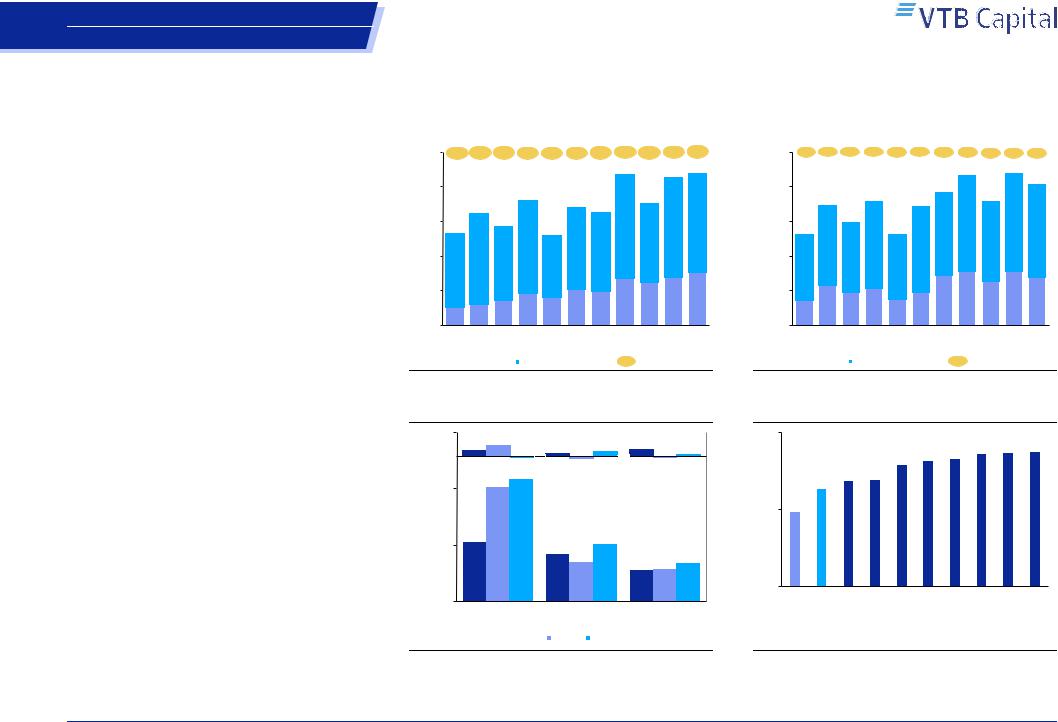
Consolidated |
residential |
demand |
in |
Moscow |
has |
Figure 13: Moscow registered deals |
|
|
|
|
Figure 14: St. Petersburg registered deals |
|
|
|||||||||||||||||||||||||||
surprised on the upside YTD and the total number of |
|
|
|
|
|
|
||||||||||||||||||||||||||||||||||
65 |
3% |
32% |
32% |
21% |
-2% |
5% |
14% |
21% |
36% |
26% |
35% |
50 |
35% |
50% |
24% |
6% |
0% |
-1% |
28% |
21% |
35% |
27% |
6% |
|||||||||||||||||
deals surged 35% YoY in 3Q18 and 32% YoY in |
||||||||||||||||||||||||||||||||||||||||
|
|
|
|
|
|
|
|
|
57.0 |
|
|
57.5 |
|
|
|
|
|
|
|
|
|
|
|
43.6 |
|
44.1 |
|
|||||||||||||
9mo18. The |
|
primary |
market |
(up |
47% |
|
YTD) |
|
|
|
|
|
|
|
|
|
|
56.0 |
|
|
|
|
|
|
|
|
|
|
|
|
40.9 |
|||||||||
|
|
52 |
|
|
|
|
|
|
|
|
|
|
|
|
40 |
|
|
|
|
|
|
|
|
38.6 |
|
|
|
|||||||||||||
outperformed |
the secondary |
(up 25%) |
as |
the |
|
|
|
|
47.2 |
|
|
|
|
|
|
|
|
|
|
|
|
36.0 |
|
|
|
35.9 |
|
|
||||||||||||
|
|
|
|
|
44.6 |
|
|
46.1 |
|
|
|
|
|
34.8 |
|
|
34.7 |
|
|
|
|
|||||||||||||||||||
developers |
extended |
and |
made |
the |
offer |
more |
|
|
42.3 |
|
|
42.6 |
|
|
|
|
|
|
|
|
|
|
|
|
|
|
||||||||||||||
|
|
|
|
|
|
|
|
|
|
|
|
|
|
|
30.1 |
|
|
|
|
|
|
|
|
|||||||||||||||||
affordable |
and |
flexible. |
On |
the secondary |
market, |
39 |
34.8 |
|
|
37.4 |
|
34.0 |
|
|
69% |
|
68% |
65% |
30 |
26.5 |
|
|
26.6 |
|
|
65% |
|
65% |
66% |
|||||||||||
|
|
|
|
|
|
|
|
|
|
|
|
|||||||||||||||||||||||||||||
sellers are |
also |
more |
reluctant |
to |
price |
declines and |
'000 |
|
|
|
|
|
|
|
|
|
|
|
'000 |
|
|
|
|
|
|
|
|
|
|
|
|
|
||||||||
|
|
|
|
|
|
|
|
|
65% |
|
|
|
|
|
|
|
|
|
|
63% |
|
65% |
|
|
||||||||||||||||
|
|
|
|
|
|
|
|
|
|
|
|
|
|
|
|
|
|
|
|
|
|
|
|
|
|
|
|
|
|
|
|
|
|
|
|
|
||||
discounts. |
|
|
|
|
|
|
|
|
|
|
|
26 |
|
|
|
|
74% |
|
70% |
70% |
|
|
|
20 |
|
|
|
67% |
68% |
70% |
|
73% |
|
|
|
|
||||
|
|
|
|
|
|
|
|
|
|
|
|
82% |
75% |
|
69% |
|
|
|
|
|
|
|
|
|
72% |
|
|
|
|
|
||||||||||
The trends in St Petersburg are also robust but inferior |
|
81% |
|
|
|
|
|
|
|
|
|
74% |
|
|
|
|
|
|
|
|
|
|||||||||||||||||||
|
|
|
|
|
|
|
|
|
|
|
|
|
|
|
|
|
|
|
|
|
|
|||||||||||||||||||
|
|
|
|
|
|
|
|
|
|
|
|
|
|
|
|
|
|
|
|
|
|
|
|
|
|
|
||||||||||||||
13 |
|
|
|
|
|
|
|
|
|
|
|
|
10 |
|
|
|
|
|
|
|
|
|
|
|
|
|
||||||||||||||
to Moscow. Consolidated volumes added 6% YoY in |
|
|
|
|
|
|
|
|
31% |
35% |
32% |
35% |
|
|
|
33% |
|
|
|
|
37% |
35% |
35% |
35% |
34% |
|||||||||||||||
3Q18 and 20% YoY in 9mo18. As with Moscow, the |
|
|
|
|
25% |
26% |
31% |
30% |
30% |
|
|
26% |
32% |
30% |
28% |
27% |
||||||||||||||||||||||||
|
19% |
18% |
|
|
|
|
|
|
|
|
|
|
||||||||||||||||||||||||||||
city benefits at the expense of its surrounding region as |
0 |
|
|
|
|
|
|
|
|
0 |
|
|
|
|
|
|
|
|
|
|||||||||||||||||||||
1Q16 |
|
2Q16 |
3Q16 |
4Q16 |
1Q17 |
2Q17 |
3Q17 |
4Q17 |
1Q18 |
2Q18 |
3Q18 |
1Q16 |
2Q16 |
3Q16 |
4Q16 |
1Q17 |
2Q17 |
3Q17 |
4Q17 |
1Q18 |
2Q18 |
3Q18 |
||||||||||||||||||
the offer has become more comparable on prices while |
|
|
|
|
||||||||||||||||||||||||||||||||||||
|
|
|
|
|
|
|
|
|
|
|
|
|
|
|
|
|
|
|
|
|
|
|
|
|
|
|
|
|||||||||||||
the real estate itself is more conveniently located. |
|
|
|
|
DDUs |
Buy-sell agreements |
|
Chng, YoY |
|
|
|
|
|
DDUs |
Buy-sell agreements |
Chng, YoY |
|
|||||||||||||||||||||||
|
|
|
|
|
|
|
|
|
|
|
||||||||||||||||||||||||||||||
|
|
|
|
|
|
|
|
|
|
|
|
|
|
|
|
|
|
|
|
|
|
|||||||||||||||||||
The sales of listed developers were impressive, reflecting the overall strong market trends and are in our view the most appealing product among peers. LSR increased volumes 46% YoY in 9mo18, reflecting adjustments to real estate to target clients’ reduced budgets, the pressured comparison base, and the growing maturity of projects. PIK also surprised with a 6% YoY advance for 9mo18, outperforming the record 2017 sales for the segment.
The strong demand trends mainly reflect people’s desire to improve their living conditions and, to a lesser extent, investment purposes (10% of sales in 3Q18). The latest rental yields for housing were 5.9% and 6.8% in Moscow and St Petersburg, respectively, in 3Q18. Adjusted for taxes and utility costs, we consider this to be modest.
Source: Rosreestr, VTB Capital Research
Figure 15: Sales of listed homebuilders, YoY
1,800 |
56% |
95% |
|
|
|
|
|
|
63% |
|
|
|
|
|
|
30% |
|
46% |
2% |
19% |
|||
|
|
6% |
|
|
|
|
|||||
1,200 |
|
1,231 1,309 |
|
|
-17% |
|
|
|
|
||
|
|
|
|
|
|
|
|||||
|
|
|
|
|
|
|
|
||||
|
|
|
|
|
|
|
|
|
|
|
|
000 sqm |
632 |
|
|
|
|
|
|
620 |
|
|
|
600 |
|
|
|
|
|
|
|
|
|
||
|
|
|
|
|
509 |
424 |
|
|
|
417 |
|
|
|
|
|
|
|
|
|
342 |
350 |
||
|
|
|
|
|
|
|
|
|
|
||
0 |
|
PIK |
|
LSR |
|
|
Etalon |
|
|||
|
|
|
|
|
|
||||||
|
|
|
|
9m16 |
9m17 |
9m18 |
|
|
|
||
|
|
|
|
|
|
|
|||||
|
|
|
|
|
|
|
|||||
Source: Company data, VTB Capital Research
Source: Rosreestr, VTB Capital Research
Figure 16: Annualized rental yields, 3Q18
9%
7.8% 7.9% 8.0% 8.2% 8.2% 8.3%
6.8% 7.1% 7.2%
6% 5.9%
3%
Moscow |
St.Petersburg |
Kazan |
Ufa |
Ekaterinburg |
Samara |
Novosibirsk |
Omsk |
Volgograd |
Rostov |
Source: Domofond, VTB Capital Research
12 November 2018 |
6 |

vk.com/id446425943 |
Real Estate Watch |
Russia |
|
Real Estate |
|
Residential prices: promising primary trends
In Moscow, primary prices increased 12% YoY in 3Q18 and YTD, supported by a spike in demand and gradually recovering household budgets. The secondary market is on a flattish trend and its premium to the primary market has been eliminated of late. The south and south-east regions demonstrated the most upbeat trends: they are significantly in the mass-market segment and have seen progress on large-scale projects and redevelopment areas through the construction stages.
In St Petersburg, primary and secondary prices added 9% YoY and 3% YoY in 9mo18. In the latest quarter, the growth rate was comparable for both segments at 8% YoY. Amid the recent pick-up on the secondary segment, its discount to the primary market in St Petersburg remains at a record high of 20%.
Listed residential developers were inflating LFL prices some 10% YTD with a gradual pace through the period. However, the greater focus on the less premium market offer caused a certain dilution, meaning a 3% YoY advance and 3% YoY correction for PIK and LSR in 9mo18, respectively. Etalon’s product mix is less volatile and the consolidated price increase for the period was 8% YoY.
Figure 17: Moscow residential prices
200
|
|
|
|
|
191 |
|
193 |
192 |
|
|
|
|
|
|
|
|
|
|
|
|
|
|
|
|
|
188 |
|
|
|
|
|
|
|
|
|
|
|
|
|
|
|
|
190 |
|
183185 |
|
|
|
188 |
|
|
|
|
|
|
|
|
|
|
|
||
|
|
|
|
|
|
|
|
181 |
183 |
182181 |
|
|
|
|
|
|
|
|||
|
180 |
179 |
|
|
|
|
|
|
|
|
179 |
|
|
|
|
|
|
|||
/ sqm |
|
|
|
|
|
|
182 |
|
|
|
|
176173174 |
|
|
|
|||||
|
|
|
|
|
|
|
175 |
|
|
|
|
|
|
|
|
173 |
||||
170 |
|
|
|
175174173 |
|
|
|
|
|
|
|
|
|
168 |
170172 |
|||||
000'RUB |
167 |
170170 |
|
|
|
|
|
160 |
|
|
|
|
|
|
|
|
||||
|
|
|
|
|
|
|
|
|
|
|
|
|
|
|
164 |
|
|
|||
|
|
|
|
|
|
|
|
|
|
|
|
|
|
|
|
|
|
|
||
|
160 |
|
|
|
|
|
|
|
|
|
|
|
|
|
|
|
|
|
|
|
|
150 |
|
|
|
|
|
|
|
|
|
153 |
157 |
155 |
156 |
158 |
154154 |
|
|
|
|
|
|
|
|
|
|
|
|
|
|
|
|
|
|
|
|
|
||||
|
140 |
1Q14 |
2Q14 |
3Q14 |
4Q14 |
1Q15 |
2Q15 |
3Q15 |
4Q15 |
1Q16 |
2Q16 |
3Q16 |
4Q16 |
1Q17 |
2Q17 |
3Q17 |
4Q17 |
1Q18 |
2Q18 |
3Q18 |
|
|
|||||||||||||||||||
|
|
|
|
|
|
|
Primary |
Secondary |
|
|
|
|
|
|
|
|||||
Source: Rosstat, VTB Capital Research
Figure 19: St Petersburg residential prices
|
110 |
|
|
|
|
|
|
|
|
|
|
|
|
|
|
|
|
107107108 |
||
|
105 |
|
|
|
|
|
|
|
|
|
|
|
|
|
|
|
101 |
|
|
|
|
|
99 100 |
|
|
|
|
|
|
|
|
|
|
|
|
|
|
|
|
||
|
100 |
97 |
97 |
|
|
|
|
|
|
|
97 |
97 |
98 |
99 |
|
|
|
|
||
|
|
|
|
|
|
95 |
|
|
|
95 |
|
|
|
|
|
|
||||
sqm/ |
95 |
|
|
|
|
93 |
94 |
93 |
|
95 |
|
|
|
|
|
|
|
|
||
|
|
|
|
|
|
|
|
|
|
|
|
|
|
|
|
|
||||
|
|
|
|
|
|
|
91 |
|
|
|
|
|
|
|
|
|
|
|||
|
|
|
|
|
|
|
|
|
|
|
|
|
|
|
|
|
|
|
||
|
|
|
|
|
|
|
|
|
|
|
|
|
|
|
|
|
|
|
|
|
000'RUB |
90 |
|
90 |
91 |
91 |
|
|
|
|
|
90 |
90 |
90 |
|
|
|
|
|
90 |
92 |
|
89 |
|
|
|
|
|
89 |
88 |
|
89 |
89 |
|
||||||||
|
85 |
|
|
|
|
|
|
|
|
|
|
|
|
|
|
|
||||
|
|
|
|
|
|
|
|
|
|
|
|
|
|
|
86 |
|
|
|
|
|
|
|
|
|
|
|
|
|
|
|
|
|
|
|
|
|
|
|
|
|
|
|
80 |
|
|
|
|
80 |
81 |
83 |
82 |
|
|
|
|
|
|
|
|
|
|
|
|
|
|
|
|
|
|
|
|
|
|
|
|
|
|
|
|
|
|
||
|
75 |
1Q14 |
2Q14 |
3Q14 |
4Q14 |
1Q15 |
2Q15 |
3Q15 |
4Q15 |
1Q16 |
2Q16 |
3Q16 |
4Q16 |
1Q17 |
2Q17 |
3Q17 |
4Q17 |
1Q18 |
2Q18 |
3Q18 |
|
|
|||||||||||||||||||
|
|
|
|
|
|
|
Primary |
Secondary |
|
|
|
|
|
|
|
|||||
Source: Rosstat, VTB Capital Research
Figure 18: Moscow blended prices, 000’RUB/sqm*
Source: IRN, VTB Capital Research
-* Percent figures indicate YoY change in prices
Figure 20: Prices of the listed homebuilders
160 |
12% |
4% |
3% |
|
|
14% |
|
4% |
2% |
8% |
||
|
|
|
|
|
|
|
||||||
|
|
|
|
|
|
|
|
|
-6% |
-3% |
|
120 |
|
|
|
|
|
|
|
|
|
|
|||
120 |
|
|
|
|
|
|
|
|
|
112 |
||
|
|
107 |
|
|
105 |
|
109 |
|
||||
|
|
|
103 |
|
|
|
|
|||||
/ sqm |
|
99 |
|
|
100 |
97 |
|
|
||||
|
|
|
|
|
|
|
|
|
||||
|
|
|
|
|
|
|
|
|
|
|
|
|
000'RUB |
80 |
|
|
|
|
|
|
|
|
|
|
|
|
|
|
|
|
|
|
|
|
|
|
|
|
|
40 |
|
|
|
|
|
|
|
|
|
|
|
|
0 |
|
PIK |
|
|
|
|
|
LSR |
Etalon |
||
|
|
|
|
|
|
|
|
|||||
|
|
|
|
|
|
9m16 |
9m17 |
9m18 |
|
|
||
|
|
|
|
|
|
|
|
|||||
|
|
|
|
|
|
|
|
|||||
Source: Company data, VTB Capital Research
12 November 2018 |
7 |
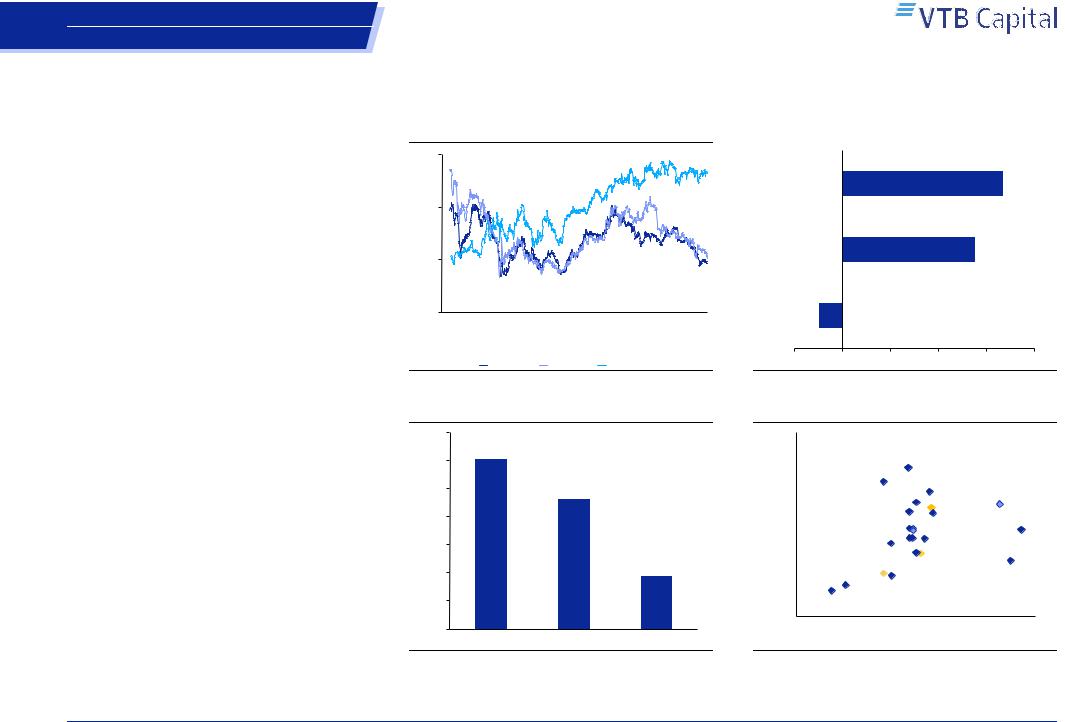
vk.com/id446425943
Russia
Real Estate
Valuation
In the development segment, we see a significant divergence between the impressive operating results of listed companies and their share prices. Stocks are among the worst performers in Russia, losing 24% YTD.
Current market capitalisations imply record discounts to LSR’s and Etalon’s net asset values (55-67%). We anticipate both stories maintaining an impressive dividend payout in the short term, with yields of 9.3% and 12.2%, respectively.
PIK is less owned by foreign institutional investors and its valuations were less impacted by the YTD worsening in sentiment on RUB stories and the less liquid universe. We see the company completely deleveraging in the short term and increasing its dividend yields (3.8% in our forecasts).
We deem large scale developers as best positioned for the upcoming regulatory changes as they have better access to capital, a stronger market offer, and more efficient cash flow management. There are over
3,000 developers in Russia and we see the sector well positioned for consolidation, favouring the constituents of our real estate universe.
Real Estate Watch
Figure 21: Share price dynamics
6 |
|
|
|
|
|
|
|
|
|
|
4 |
|
|
|
|
|
|
|
|
|
|
USD |
|
|
|
|
|
|
|
|
|
|
2 |
|
|
|
|
|
|
|
|
|
|
0 |
|
|
|
|
|
|
|
|
|
|
Nov-13 |
May-14 |
Nov-14 |
May-15 |
Nov-15 |
May-16 |
Nov-16 |
May-17 |
Nov-17 |
May-18 |
Nov-18 |
|
|
LSRG LI |
ETLN LI |
|
PIKK RX |
|
|
|
||
Source: Bloomberg, VTB Capital Research |
|
|
|
|
|
|||||
Figure 23: 12-month dividend yield outlook |
|
|
||||||||
14% |
|
|
|
|
|
|
|
|
|
|
12% |
|
12.2% |
|
|
|
|
|
|
|
|
|
|
|
|
|
|
|
|
|
|
|
10% |
|
|
|
|
9.3% |
|
|
|
|
|
|
|
|
|
|
|
|
|
|
|
|
8% |
|
|
|
|
|
|
|
|
|
|
6% |
|
|
|
|
|
|
|
|
|
|
4% |
|
|
|
|
|
|
|
3.8% |
|
|
2% |
|
|
|
|
|
|
|
|
|
|
0% |
|
LSR |
|
|
Etalon |
|
|
PIK |
|
|
|
|
|
|
|
|
|
|
|||
Source: Bloomberg, VTB Capital Research
Figure 22: |
NAV |
Etalon |
67% |
LSR |
55% |
PIK -10% |
|
|
|
|
|
|
|
-20% |
0% |
20% |
|
40% |
60% |
80% |
|
Source: Company |
|
|
|
|
|
|
|
Figure 24: Comparative valuation |
|
|
|
||||
12x |
|
|
|
|
|
|
|
|
|
Kaufman & |
|
|
|
||
10x |
|
Broad |
|
|
|
|
|
|
|
|
|
|
|
|
|
|
Enka |
Berkeley Group |
|
|
|
||
|
Persimmon |
PIK |
|
EM |
|
||
8x |
|
|
|
||||
P/E'19 |
Barratt Developments |
DM |
Dom Development |
|
|||
|
Bellway |
|
|
AP Thailand |
|||
|
|
|
|
||||
|
|
|
|
|
|
|
|
6x |
Mrv Engenharia |
|
Lennar Corp |
Finvest |
|||
China Vanke |
|
|
|
||||
|
Aldar Properties |
|
LSR |
|
Land |
|
|
4x |
Etalon Robinsons |
|
|
|
|||
Country |
Land |
|
|
|
|||
|
Garden |
|
|
|
|
|
|
Agile Group |
|
|
|
|
|
|
|
2x |
|
|
|
|
|
|
|
0x |
|
5x |
|
|
10x |
|
|
|
|
EV/EBITDA'19 |
|
|
|
||
Source: Bloomberg, VTB Capital Research
12 November 2018 |
8 |

vk.com/id446425943 |
Real Estate Watch |
Russia |
|
Real Estate |
|
Disclosures
Important Disclosures
The information and opinions contained within VTB Capital Research are prepared by JSC VTB Capital. As used in this disclosure section, "VTB Capital" includes JSC VTB Capital, VTB Capital Plc and their affiliates as necessary.
VTB Capital and/or any of its worldwide affiliates which operate outside of the USA (collectively, the “VTB Group”) do and seek to do business with companies covered in their research reports. Thus, investors should be aware that the VTB Group may have a conflict of interest that could affect the objectivity of this research report. Investors should consider this research report as only a single factor in making their investment decision.
Where an issuer referred to in this report is not included in the disclosure table, the issuer is either considered not to be covered by VTB Capital Research, or the reference is considered to be incidental and therefore the issuer is not a subject company within this report.
Disclosures on the companies covered by this report can be obtained by writing to the offices listed on the back page. In order to receive i) a summary of any basis of the valuation or methodology and the underlying assumptions used to either evaluate a financial instrument or an issuer, or to set a price target for a financial instrument, as well as an indication and a summary of any changes in the valuation, methodology or underlying assumptions; ii) detailed information about the valuation or methodology and the underlying assumptions in any nonproprietary models; or iii) material information about the proprietary models used; please consult the VTB Capital Research web-site at https://research.vtbcapital.com or contact the authors of this document.
Issuer Specific Disclosures
Disclosure checklist
Company |
Ticker |
Recent price |
Disclosure |
Etalon Group |
ETLN LI |
2.04 (USD) |
4a, 5a, 6a, 9a |
LSR Group |
LSRG LI |
1.89 (USD) |
4a |
PIK Group |
PIKK RX |
348.8 (RUB) |
4a |
4a. VTB Capital or an affiliated company is a provider of liquidity and/or a market maker in the securities of the relevant issuer at the time this research report was published. VTB Capital or an affiliated company will buy and sell securities of the relevant issuer on a principal basis.
5a. VTB Capital or an affiliated company has been lead manager or co-lead manager over the previous 12 months of a public offering of securities of the relevant issuer.
6a. VTB Capital or an affiliated company is party to an agreement that has been in effect during the previous 12 months, or has received compensation during the previous 12 months, from the relevant issuer relating to the provision of investment banking services.
9a. VTB Capital or an affiliated company expects to receive or intends to seek investment banking related compensation from the relevant issuer within the next 3 months.
Analysts Certification
The research analysts whose names appear on research reports prepared by VTB Capital certify that: i) all of the views expressed in the research report accurately reflect their personal views about the subject security or issuer, and ii) no part of the research analysts’ compensation was, is, or will be directly or indirectly related to the specific recommendations or views expressed by the research analysts in research reports that are prepared by VTB Capital.
The research analysts whose names appear on research reports prepared by VTB Capital received compensation that is based upon various factors including VTB Capital’s total revenues, a portion of which are generated by VTB Capital’s investment banking activities.
12 November 2018 |
9 |

vk.com/id446425943 |
Real Estate Watch |
Russia |
|
Real Estate |
|
Investment Ratings
VTB Capital uses a three-tiered Investment Rating system for stocks under coverage: Buy, Hold, or Sell.
The three main ratings correspond to the next 12-month Expected Total Return (ETR), defined as the difference between the Target Price and the Last Price divided by the Last Price plus the expected Dividend Yield over the next 12 months. The correspondence is as follows (as of the publishing date):
BUY: ETR exceeds plus 20% or more HOLD: ETR is between zero and plus 20% SELL: ETR is less than zero
VTB Capital Research assures the correspondence between the active Investment Ratings and the aforementioned definitions at the time of the Target Price and/or Investment Rating revision. Between such revisions, day-to-day movements in the prices of financial instruments could result in a temporary discrepancy between the Investment Rating and the aforementioned definition. Analysts address such discrepancies based on their scale and duration.
UNDER REVIEW: In the event that significant information about an issuer is due to be announced or is expected to become public in the foreseeable future, or the analyst needs time to evaluate such information, which was announced recently, s/he might choose to place that issuer Under Review. This means that the analyst is suspending the previously published financial forecasts, Target Price and investment rating in order to review them while waiting for the impending information. As such, they are no longer valid and should not be relied upon.
RESTRICTED: In certain circumstances, VTB Capital is not able to communicate issuer ratings due to internal policy and/or law and regulations. In this case, any revision of the financial forecasts, Target Prices and Investment Ratings will be carried out only after the Restricted status is removed.
Notwithstanding the above, VTB Capital may from time to time issue investment recommendations predicated on a different time horizon (such as short-term trading recommendations) to that which is described above. Where VTB Capital issues such an investment recommendation, the use of an alternative time horizon for the purpose of formulating such investment recommendation might result in differences between such investment recommendation and any investment rating published in accordance with the Investment Rating system described above.
The below table details the distribution of VTB Capital’s Investment Ratings on the basis of the three-tier recommendation system described above.
VTB Capital Ratings Distribution
Investment Rating Distribution
Buy |
68 |
59% |
Hold |
35 |
30% |
Sell |
6 |
5% |
Restricted |
0 |
0% |
Not Rated |
0 |
0% |
Under Review |
7 |
6% |
|
116 |
|
Source: VTB Capital Research as at 31 October 2018
Ratings Distribution for Investment Banking Relationships
Buy |
16 |
76% |
Hold |
2 |
10% |
Sell |
0 |
0% |
Restricted |
0 |
0% |
Not Rated |
0 |
0% |
Under Review |
3 |
14% |
|
21 |
|
As of 10 April 2016, the VTB Capital Ratings Distribution table accounts for all the instruments covered, rather than the companies covered. In instances where we provide a recommendation for more than one instrument issued by a company, these are now counted separately. This accounts for the increase in the number of ratings from the count as of 29 February 2016. A list of those companies for which we cover more than one instrument can be found at DoubleRecPLC20181031.pdf.
12 November 2018 |
10 |