

S P Global - Top Trends 2019 - Metals and Mining_watermark
.pdfvk.com/id446425943
Industry Top Trends 2019
Metals and Mining
November 12, 2018
Key Takeaways
–Ratings Outlook: The outlook for upstream producers largely improved in 2018, with a modestly positive rating bias. We expect the focus on financial prudence--particularly among the largest globally diversified miners--to continue in 2019 amid what we assume will be a continuing generally supportive price environment. For global downstream producers, we expect stable conditions, with upgrades now likely to reflect financial policies and resilience to future downturns as much as strong metrics.
–Forecasts: Our base assumptions result in credit measures improving modestly in 2019 for upstream and downstream producers. Lower net debt is primary cause for the improvement, given our relatively flat price and output expectations for next year. However, we haven't factored in any potential negative impact from the U.S.-China trade war on global demand and prices, which could lead to deviations from our base-case projections.
–Assumptions: Generally stable prices for most metals and mining commodities over the next two years; reflecting our assumption of balanced global supply/demand conditions. We also expect the debt reduction cycle to continue, which should build issuers’ resilience to potential downturns, assuming judicious use of discretionary cash flow for investments and shareholder-friendly initiatives, at least in 2019.
–Risks: China remains the primary force behind the fundamentals of the metals and mining industry. Slowing demand from China or an unexpected ramp-up of steel and aluminum output remain key risks that could disrupt relatively balanced conditions for most metals and mining commodity markets. However, ongoing supply-side reforms could also lead to stronger-than-expected market fundamentals for certain commodities. Additionally, foreign currency becomes a greater risk, given the historical negative correlation between the U.S. dollar and metals prices, and as U.S. coal producers’ shift to export markets to offset domestic thermal decline. Overall, we expect prices to remain volatile, with fluctuations likely related to developments in China and potentially due to other government policies and geopolitical risks.
–Industry Trends: We expect the prevailing mood of balance sheet conservatism to continue into 2019 for most upstream and downstream producers. However, we believe shareholder remuneration will start to increase--in some cases because of financial policy frameworks--and could emerge as a possible risk to financial profiles. That said, prudent financial policy implementation should support ratings, provided that cash generation funds shareholder returns to ensure that balance sheets have cushion for future downturns.
S&P Global Ratings
Authors
Vania Dimova
New York
+1 212 438 0447 vania.dimova@spglobal.com
Jarrett Bilous
Toronto
+1 416 507 2593 jarrett.bilous@spglobal.com
William Ferara
New York
+1 212 438 1776 bill.ferara@spglobal.com
Sergei Gorin
Moscow
+ 7 49 5783 4132 sergei.gorin@spglobal.com
Danny Huang
Hong Kong +852 2532 8078
danny.huang@spglobal.com
Elad Jelasko
London
+44 207 176 7013 elad.jelasko@spglobal.com
Donald Marleau
Toronto
+1 416 507 2526 donald.marleau@spglobal.com
Diego Ocampo
Buenos Aires +5411 4891 2116
diego.ocampo@spglobal.com
Simon Redmond
London
+44 (0)207 176 3683 simon.redmond@spglobal.com
Chiza Vitta
Dallas
+1 214 765 5864 chiza.vitta@spglobal.com
May Zhong
Melbourne 613-9631-2164 may.zhong@spglobal.com
1

vk.com/id446425943
Industry Top Trends 2019: Metals and Mining
Ratings trends and outlook
Global Metals and Mining
Chart 1 |
|
|
|
|
|
Chart 2 |
|
|
|
|
|
|
|
|
|
|
|
|
|
|
|
|
||||||||||||||||||||
Ratings distribution |
|
|
|
|
|
Ratings distribution by region |
|
|
|
|
|
|
|
|||||||||||||||||||||||||||||
|
|
|
|
Metals & Mining |
|
|
|
|
|
|
|
|
North America |
|
W.Europe |
|
|
|||||||||||||||||||||||||
|
|
|
|
|
|
|
|
|
|
|
|
|
|
|
||||||||||||||||||||||||||||
50 |
|
|
|
50 |
|
|
|
|
|
Asia-Pacific |
|
Latin America |
||||||||||||||||||||||||||||||
|
|
|
|
|
|
|
|
|
|
|
|
|
|
|
|
|
|
|
|
|||||||||||||||||||||||
|
|
|
|
|
|
|
|
|
|
|
|
|
|
|
|
|
|
|
|
|||||||||||||||||||||||
|
|
|
|
|
|
|
|
|
|
|
|
|
|
|
|
|
|
|
|
|||||||||||||||||||||||
|
|
|
|
|
|
|
|
|
|
|
|
|
|
|
|
|
|
|
|
|
|
|
|
|
|
|
|
|
|
|
|
|
|
|
|
|
|
|
||||
40 |
|
|
|
|
|
|
|
|
|
|
|
|
|
|
40 |
|
|
|
|
|
|
|
|
|
|
|
|
|
|
|
|
|
|
|
|
|
|
|
|
|
||
|
|
|
|
|
|
|
|
|
|
|
|
|
|
|
|
|
|
|
|
|
|
|
|
|
|
|
|
|
|
|
|
|
|
|
|
|
|
|
||||
30 |
|
|
|
|
|
|
|
|
|
|
|
|
|
|
30 |
|
|
|
|
|
|
|
|
|
|
|
|
|
|
|
|
|
|
|
|
|
|
|
|
|
||
|
|
|
|
|
|
|
|
|
|
|
|
|
|
|
|
|
|
|
|
|
|
|
|
|
|
|
|
|
|
|
|
|
|
|
|
|
|
|
||||
20 |
|
|
|
|
|
|
|
|
|
|
|
|
|
|
20 |
|
|
|
|
|
|
|
|
|
|
|
|
|
|
|
|
|
|
|
|
|
|
|
|
|
||
|
|
|
|
|
|
|
|
|
|
|
|
|
|
|
|
|
|
|
|
|
|
|
|
|
|
|
|
|
|
|
|
|
|
|
|
|
|
|
||||
10 |
|
|
|
|
|
|
|
|
|
|
|
|
|
|
10 |
|
|
|
|
|
|
|
|
|
|
|
|
|
|
|
|
|
|
|
|
|
|
|
|
|
||
|
|
|
|
|
|
|
|
|
|
|
|
|
|
|
|
|
|
|
|
|
|
|
|
|
|
|
|
|
|
|
|
|
|
|
|
|
|
|
||||
0 |
|
|
|
|
|
|
|
|
|
|
|
|
|
|
0 |
|
|
|
|
|
|
|
|
|
|
|
|
|
|
|
|
|
|
|
|
|
|
|
|
|
||
|
AAA AA+ AA AA- A+ A A- BBB+ BBB BBBBB+ BB BB- |
B+ B B- CCC+ CCC CCCCC C SD D |
|
AAA AA+ AA AA- A+ A A- BBB+ BBB BBBBB+ BB BB- B+ B B- CCC+ CCC CCCCC C SD D |
||||||||||||||||||||||||||||||||||||||
|
|
|
|
|
|
|||||||||||||||||||||||||||||||||||||
Chart 3 |
|
|
|
|
|
Chart 4 |
|
|
|
|
|
|
|
|
|
|
|
|
|
|
|
|
||||||||||||||||||||
Ratings outlooks |
|
|
|
|
|
Ratings outlooks by region |
|
|
|
|
|
|
|
|||||||||||||||||||||||||||||
|
|
Positive |
Negative |
|
|
Negative |
|
WatchNeg |
|
|
Stable |
|
|
WatchPos |
|
Positive |
||||||||||||||||||||||||||
15% |
|
|
|
|
|
|
9% |
|
|
|
|
|
|
|
|
|||||||||||||||||||||||||||
|
|
|
|
|
|
|
|
|
|
|
|
|
||||||||||||||||||||||||||||||
|
|
|
|
|
|
|
|
|
|
|
|
|
|
|
|
|
|
|
|
|
|
|
|
|
|
|
|
|
|
|
|
|
|
|
||||||||
|
|
WatchPos |
|
|
|
WatchNeg |
100% |
|
|
|
|
|
|
|
|
|
|
|
|
|
|
|
|
|
|
|
|
|
|
|
||||||||||||
|
|
2% |
|
|
|
|
|
|
|
|
|
|
|
|
|
|
|
|
|
|
|
|
|
|
|
|||||||||||||||||
|
|
|
|
|
|
|
|
|
|
|
|
|
|
|
|
|
|
|
|
|
|
|
|
|
|
|
|
|
|
|||||||||||||
1% |
|
|
|
|
|
|
|
|
|
|
|
|
80% |
|
|
|
|
|
|
|
|
|
|
|
|
|
|
|
|
|
|
|
|
|
|
|
||||||
|
|
|
|
|
|
|
|
|
|
|
|
|
|
|
|
|
|
|
|
|
|
|
|
|
|
|
|
|
|
|
|
|
|
|
||||||||
|
|
|
|
|
|
|
|
|
|
|
|
|
|
|
60% |
|
|
|
|
|
|
|
|
|
|
|
|
|
|
|
|
|
|
|
|
|
|
|
||||
|
|
|
|
|
|
|
|
|
|
|
|
|
|
|
|
|
|
|
|
|
|
|
|
|
|
|
|
|
|
|
|
|
|
|
|
|
|
|||||
|
|
|
|
|
|
|
|
|
|
|
|
|
|
|
40% |
|
|
|
|
|
|
|
|
|
|
|
|
|
|
|
|
|
|
|
|
|
|
|
||||
|
|
|
|
|
|
|
|
|
|
|
|
|
|
|
|
|
|
|
|
|
|
|
|
|
|
|
|
|
|
|
|
|
|
|
|
|
|
|||||
|
|
|
|
|
|
|
Stable |
|
|
|
|
|
20% |
|
|
|
|
|
|
|
|
|
|
|
|
|
|
|
|
|
|
|
|
|
|
|
||||||
|
|
|
|
|
|
|
|
|
|
|
|
|
|
|
|
|
|
|
|
|
|
|
|
|
|
|
|
|
|
|
|
|
|
|
||||||||
|
|
|
|
|
|
|
|
|
|
|
|
0% |
|
|
|
|
|
|
|
|
|
|
|
|
|
|
|
|
|
|
|
|
|
|
|
|||||||
|
|
|
|
|
|
|
|
|
|
|
|
|
|
|
|
|
|
|
|
|
|
|
|
|
|
|
|
|
|
|
|
|
|
|
||||||||
73% |
|
|
|
|
|
|
|
|
|
|
|
|
|
|
|
|
|
|
|
|
|
|
|
|
|
|
|
|
||||||||||||||
|
|
|
|
|
|
|
|
APAC |
LatAm N.America |
W.Eur |
||||||||||||||||||||||||||||||||
|
|
|
|
|
|
|
|
|
|
|
|
|
||||||||||||||||||||||||||||||
|
|
|
|
|
|
|
|
|
|
|
|
|
|
|
|
|
|
|
|
|
|
|
||||||||||||||||||||
Chart 5 |
|
|
|
|
|
Chart 6 |
|
|
|
|
|
|
|
|
|
|
|
|
|
|
|
|
||||||||||||||||||||
Ratings outlook net bias |
|
|
|
|
|
Ratings net outlook bias by region |
|
|
||||||||||||||||||||||||||||||||||
Net Outlook |
|
Metals & Mining |
|
|
Net Outlook |
|
N.America |
|
W.Europe |
||
Bias (%) |
|
|
|
Bias (%) |
|
Asia-Pacific |
|
Latin America |
|||
|
|
|
|
|
|
|
|||||
10 |
|
|
|
|
|
40 |
|
|
|
|
|
0 |
|
|
|
|
|
20 |
|
|
|
|
|
-10 |
|
|
|
|
|
0 |
|
|
|
|
|
-20 |
|
|
|
|
|
-20 |
|
|
|
|
|
-30 |
|
|
|
|
|
-40 |
|
|
|
|
|
-40 |
|
|
|
|
|
-60 |
|
|
|
|
|
-50 |
|
|
|
|
|
-80 |
|
|
|
|
|
13 |
14 |
15 |
16 |
17 |
18 |
13 |
14 |
15 |
16 |
17 |
18 |
Source: S&P Global Ratings. Ratings data measured quarterly with last shown quarter ending September 30, 2018
The outlook for ratings on metals and mining issuers is predominantly stable, and the rating bias has modestly improved relative to last year. As of third quarter 2018, close to three-quarters of mining and metals issuers had stable rating outlooks. The number of positive outlooks remains unchanged year-over-year (15%), but the share of negative outlooks has declined to about 9%. Ratings net bias improved modestly across all regions. In our view, this trend highlights the positive cash flow momentum for most mining and metals issuers over the past year. We also believe positive cash flow has contributed to an increase in new issuer ratings largely concentrated in the ‘B’ rating category.
S&P Global Ratings |
November 12, 2018 2 |
vk.com/id446425943
Industry Top Trends 2019: Metals and Mining
Industry forecasts
Global Metals and Mining
Chart 7 |
|
|
|
|
|
Chart 8 |
|
|
|
|
|
|
||||||
Revenue growth (local currency) |
|
|
Capex growth |
|
|
|
|
|
|
|||||||||
|
|
|
|
Metals & Mining Upstream |
|
|
|
|
|
|
Metals & Mining Upstream |
|
||||||
|
|
|
|
|
|
|
|
|
|
|||||||||
|
|
|
|
|
|
|
|
|
|
|||||||||
|
|
|
|
Metals & Mining Downstream |
|
|
|
|
|
|
Metals & Mining Downstream |
|
||||||
|
|
|
|
|
|
|
|
|
|
|||||||||
|
|
|
|
|
|
|
|
|
|
|||||||||
30% |
|
|
|
Global |
|
|
Forecast |
|
50% |
|
|
|
|
Global |
|
|
Forecast |
|
|
|
|
|
|
|
|
|
|
|
|
|
|
||||||
|
|
|
|
|
|
|
|
|
|
|
|
|
|
|
|
|
||
20% |
|
|
|
|
|
|
|
|
40% |
|
|
|
|
|
|
|
|
|
|
|
|
|
|
|
|
|
|
|
|
|
|
|
|
|
|
||
|
|
|
|
|
|
|
|
30% |
|
|
|
|
|
|
|
|
|
|
|
|
|
|
|
|
|
|
|
|
|
|
|
|
|
|
|
|
|
10% |
|
|
|
|
|
|
|
|
20% |
|
|
|
|
|
|
|
|
|
|
|
|
|
|
|
|
|
|
|
|
|
|
|
|
|
|
||
0% |
|
|
|
|
|
|
|
|
10% |
|
|
|
|
|
|
|
|
|
|
|
|
|
|
|
|
|
|
|
|
|
|
|
|
|
|
||
|
|
|
|
|
|
|
|
0% |
|
|
|
|
|
|
|
|
|
|
|
|
|
|
|
|
|
|
|
|
|
|
|
|
|
|
|
||
|
|
|
|
|
|
|
|
|
|
|
|
|
|
|
|
|
|
|
|
|
|
|
|
|
|
|
|
|
|
|
|
|
|
|
|
|
|
-10% |
|
|
|
|
|
|
|
|
-10% |
|
|
|
|
|
|
|
|
|
|
|
|
|
|
|
|
|
|
|
|
|
|
|
|
|
|
||
-20% |
|
|
|
|
|
|
|
|
-20% |
|
|
|
|
|
|
|
|
|
|
|
|
|
|
|
|
|
|
|
|
|
|
|
|
|
|
||
|
|
|
|
|
|
|
|
-30% |
|
|
|
|
|
|
|
|
|
|
|
|
|
|
|
|
|
|
|
|
|
|
|
|
|
|
|
||
-30% |
|
|
|
|
|
|
|
|
|
|
|
|
|
|
|
|
|
|
|
|
|
|
|
|
|
|
|
|
|
|
|
|
|
|
|
||
|
|
|
|
|
|
|
|
-40% |
|
|
|
|
|
|
|
|
|
|
|
|
|
|
|
|
|
|
|
|
|
|
|
|
|
|
|
||
2015 |
2016 |
2017 |
2018 |
2019 |
2020 |
2015 |
2016 |
2017 |
2018 |
2019 |
2020 |
|||||||
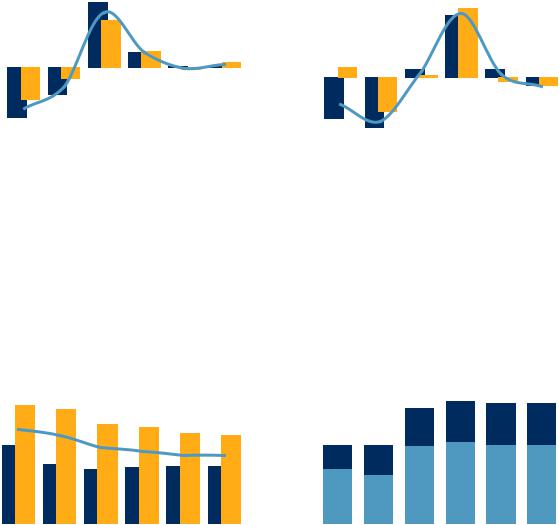
We expect relatively flat revenues across the upstream and downstream sectors in 2019 and 2020, albeit at favorable levels following the sharp increase in 2017. Our estimates mainly reflect relatively stable average metals and mining commodity price assumptions that for the most part reflect balanced supply/demand fundamentals. We also expect steady production across both segments of the industry, because we predict subdued investments in recent years to limit a material increase in output.
We expect the positive trend in capital expenditures (capex) over the past two years to stall in 2019. Both upstream and downstream producers began increasing their capex in 2017 in response to improved market conditions and the completion of restructurings and balance sheet repair. However, we believe producers are now becoming more cautious with capital allocation, due in part to increasingly uncertain demand—mainly in China--and the potential impact of a trade war between China and the U.S. The recent volatility in most mining commodity prices this year also likely plays a role.
Chart 9 |
Chart 10 |
Debt / EBITDA (median, adjusted)
 Metals & Mining Upstream
 Metals & Mining Downstream
6.0x |
|
|
|
|
Global |
|
|
Forecast |
|
|
|
|
|
|
|
|
|||
|
|
|
|
|
|
|
|
|
|
5.0x |
|
|
|
|
|
|
|
|
|
|
|
|
|
|
|
|
|
|
|
4.0x |
|
|
|
|
|
|
|
|
|
|
|
|
|
|
|
|
|
|
|
3.0x |
|
|
|
|
|
|
|
|
|
|
|
|
|
|
|
|
|
|
|
2.0x |
|
|
|
|
|
|
|
|
|
|
|
|
|
|
|
|
|
|
|
1.0x |
|
|
|
|
|
|
|
|
|
|
|
|
|
|
|
|
|
|
|
0.0x |
|
|
|
|
|
|
|
|
|
|
|
|
|
|
|
|
|
|
|
2015 |
2016 |
2017 |
2018 |
2019 |
2020 |
||||
EBITDA (absolute, adjusted)
|
|
|
|
|
Metals & Mining Downstream |
|
|||
|
|
|
|
|
|
||||
|
|
|
|
|
|
||||
|
|
|
|
|
Metals & Mining Upstream |
|
|||
|
|
|
|
|
|
||||
|
|
|
|
|
|
||||
400 |
|
USD Bn |
|
|
|
Forecast |
|
||
|
|
|
|
|
|
|
|
|
|
350 |
|
|
|
|
|
|
|
|
|
|
|
|
|
|
|
|
|
|
|
300 |
|
|
|
|
|
|
|
|
|
|
|
|
|
|
|
|
|
|
|
250 |
|
|
|
|
|
|
|
|
|
|
|
|
|
|
|
|
|
|
|
200 |
|
|
|
|
|
|
|
|
|
|
|
|
|
|
|
|
|
|
|
150 |
|
|
|
|
|
|
|
|
|
|
|
|
|
|
|
|
|
|
|
100 |
|
|
|
|
|
|
|
|
|
|
|
|
|
|
|
|
|
|
|
50 |
|
|
|
|
|
|
|
|
|
|
|
|
|
|
|
|
|
|
|
- |
|
|
|
|
|
|
|
|
|
2015 |
|
2016 |
2017 |
2018 |
2019 |
2020 |
|||
|
|
||||||||
We believe the steady deleveraging trend has mostly played itself out after an earnings upswing and significant debt reduction in recent years, particularly among larger upstream producers. We expect modest earnings growth will result in slightly reduced adjusted debt-to-EBITDA ratios across the industry, led by North America. Our estimates mainly reflect our relatively stable assumptions for prices, output, and debt levels across most regions, which builds some credit buffer against any potential downturn.
We expect relatively flat EBITDA across the upstream and downstream sectors in 2019 and 2020. Our estimates mainly account for stable average metals and mining commodity price assumptions which, for the most part, reflect balanced supply/demand fundamentals. The earnings growth in 2017 and 2018 largely resulted from higher prices and cost rationalization following two years of low prices.
Source: S&P Global Ratings. Revenue growth shows local currency growth weighted by prior-year common-currency revenue-share. All other figures are converted into U.S. Dollars using historic exchange rates. Forecasts are converted at the last financial year-end spot rate. FFO--Funds from operations.
Thanks to healthy demand and relatively low growth in supply, the metal and mining industry is about to close another strong year. Although prices recently softened, the
S&P Global Ratings |
November 12, 2018 3 |
vk.com/id446425943
Industry Top Trends 2019: Metals and Mining
drop comes after a rally in the last two years, and prices are still healthy. Given the industry's pronounced cyclicality, it's likely that sooner or later prices will run out of steam--either due to a production policy change in China, an incipient trade war, or other factors not currently envisioned. Right now, we view the weakening U.S. and Chinese trade relations and the relative strength of the U.S. dollar as the main catalysts that could lead to a downturn for the industry.
Upstream – Is The Best Of This Cycle Behind Us?
Generally stable cycle. Our outlook for upstream producers is broadly stable with a modest positive rating bias relative to last year. We don't anticipate significant changes to ratings in the next year. We expect the majority of companies will remain focused on maintaining healthy balance sheets, following the significant debt reduction in recent years. With stable demand and supply for most metals, the companies don’t see justification to initiate large greenfield projects or acquisitions. Naturally, prices will remain volatile and will be subject to actual supply-demand balances.
Copper and zinc will continue to remain in the spotlight. Recently, we lowered our price assumptions for copper and zinc following steep declines from strong mid-year levels, driven by a stronger U.S. dollar, global trade tensions, and speculation in the market. We believe fairly stable prices will remain going forward ($6,000/ton-$6,200/ton for copper and $2,800/ton for zinc through 2020), and we continue to view market fundamentals as fairly healthy for both metals. On the flipside, the iron ore market will remain modestly oversupplied, which would moderate prices to near $55/ton by 2020.
No incentives for new growth projects. Over the past couple of years, many producers have not had sufficient incentive to invest in new capacity given the high price volatility and costs associated with developing new mines. Given our subdued expectation for capex in 2019, we believe the lack of meaningful future supply could set the stage for sustainably higher prices of certain metals, notably copper. Future growth decisions will depend on the pace of demand in China and other developing regions, which we highlight as a key risk to our assumptions.
Reports of the death of thermal coal were premature. With healthy prices, US thermal coal producers have continued to find ways this year to increase their export capabilities, since the energy profile in the U.S. is leaning more towards natural gas and renewable sources. The European as well as Asian markets, especially India, continue to have a strong demand for thermal coal (see “When The Cycle Turns: U.S. Coal Companies Seek Pay Dirt In Exports, published Oct. 26, 2018). Additional demand comes from China because its coal industry is going through a supply-side reform. The Chinese government is aiming to close small and inefficient coal mines and those not in compliance with environmental regulations.
With respect to ratings, U.S. thermal coal companies without export capabilities will remain vulnerable to diminishing domestic demand, compared to export-oriented companies. On the other side of the globe, the larger coal Chinese mines (generally our rated coal miners) will benefit from the reforms due to their more efficient operations and regulation compliance.
S&P Global Ratings |
November 12, 2018 4 |
vk.com/id446425943
Industry Top Trends 2019: Metals and Mining
Downstream – What Could Upset Stability?
The outlook for the credit profiles of global steel and aluminum producers and processors is stable with a modest positive bias. Elevated prices, capacity rationalization in China, and lower imports (mainly in the U.S. and Europe) should persist over the next year and preserve favorable supply conditions. Combined with modest demand growth from most end markets, we expect prices to remain generally steady. In addition, we expect China will continue to adhere to stricter environmental standards, thereby reducing excess capacity, although this could potentially incur higher costs for companies. That said, we believe risks are building for increased price volatility. Uncertainty about the impact of evolving U.S. and China trade tensions, rising interest rates, and the relative strength of the U.S. dollar will influence future prices.
We expect some positive rating actions among issuers most exposed to elevated steel and aluminum prices over the next 12-24 months, particularly among low speculativegrade companies. Stronger prices are boosting cash flows for debt reduction and reinvestment for primary producers, but small working capital-intensive metals processors are feeling a profit and liquidity pinch from higher metals prices and tariffs. We recently upgraded global steel producer Arcelor Mittal to 'BBB-' from 'BB+' based on its strong performance and reduced debt, as well as Australia-based steel producer BlueScope Steel Ltd. to 'BBB-' based on its improved operating metrics and strong financial performance. We also revised the outlook on Brazil-domiciled Gerdau S.A. to stable from negative and affirmed the 'BBB-' rating following significant deleveraging.
First signs of recovery in Brazil. Very weak macroeconomic conditions reduced flat and long steel demand by around 30% to 50% in the past two to three years. In response, we took consecutive negative rating actions on some steel producers in Brazil, including a downgrade of Usinas Siderúrgicas de Minas Gerais S.A. (Usiminas) related to a debt restructuring. Next year, we expect volumes to increase very gradually following high global steel prices, which along with a depreciated Brazilian currency make exports profitable and prevent steel imports. This dynamic can lead to positive rating actions mainly for the low rated companies such as Usiminas and Companhia Siderúrgica Nacional (CSN).
Trade actions boost U.S. downstream. President Trump's decision earlier this year to impose tariffs of 25% on steel and 10% on aluminum from all countries is a moderately positive factor for U.S.-based steel and aluminum producers, but also entails cost and working capital pressures for domestic metals consumers and processors. Additional trade actions from the U.S. and China may conceal some risk for the global economy, but over the short term we expect them further support domestic production in the U.S., underpinning companies' current or even stronger fundamentals. U.S. steel imports dropped by about 10% year-to-date August 2018 versus last year. While we expect the lower imports to help sustain higher prices for domestic competitors in the near term, we also predict some risk of modest import pressure persisting, primarily because of the lack of confidence in the sustainability of the current steel tariffs. In our view, these policy actions will encourage some domestic production, raise utilization rates, and keep domestic prices above those of the rest of the world. However, U.S. steel prices are still correlated with steel prices in China. Any significant decrease in Chinese steel prices (potentially due to slower economic growth, construction, and investment in China) would increase the spread between domestically-produced steel and imported steel, potentially causing U.S. steel prices to retreat.
We expect rising crude steel production in Asia to contribute to global supply, contributing slightly higher than apparent steel demand and thus somewhat limiting price rises. Meanwhile, production in the U.S. and Europe continues to grow as well amid relatively healthy demand, and we expect this to continue (albeit with lower demand than in Asia) over the next 12 months. Moreover, steel-related trade case filings in both regions have lessened the impact of imports, though imports remain elevated relative to
S&P Global Ratings |
November 12, 2018 5 |
vk.com/id446425943
Industry Top Trends 2019: Metals and Mining
historical trends. That said, worldwide steel capacity utilization remains relatively low-- at approximately 78% as of August 2018--but it's steadily increasing and remains a risk to market stability, particularly in the event of weaker-than-expected demand (notably from China).
Consolidation may reshape EMEA steel landscape. The steel industry is closing another strong year, but conditions could soften in 2019 as European steel products won't exempt from Section 232, but this will have a limited impact on our rated portfolio. Companies such as ArcelorMittal, SSAB AB and others that operate in the U.S. could see improved profitability. Conditions in 2019 will also be reshaped after ArcelorMittal acquires Italian steel company Ilva and after the consolidation of Tata Steel with the steel division of ThyssenKrupp. The new entities will have over 50% of the market share of European flat production. A less fragmented and more disciplined market could smooth market cyclicality and support higher margins.
Tight market fundamentals to support aluminium. We assume continuing strong aluminum prices based on tight market fundamentals driven by trade actions, supply disruptions, production reforms in China, and favorable demand. In our view, demand should remain healthy and increase in the low-to-mid single digits over the next 12 to 24 months, supported by growth in the global construction and transportation industries. The U.S. administration’s 10% tariff on aluminum (effective March 23, 2018) and possible sanctions against Russian aluminum company Rusal have contributed to elevated prices and regional premiums in the U.S., while alumina supply disruptions have constrained primary aluminum production amid growing demand. We continue to believe that the Chinese government remains focused on curtailing capacity to combat pollution and curb illegal aluminum production, but aluminum production in China will likely still grow annually as new capacity comes online, spurred by the modest global aluminum deficit and solid demand.
S&P Global Ratings |
November 12, 2018 6 |

vk.com/id446425943
Industry Top Trends 2019: Metals and Mining
Key assumptions
Metals and Mining
1. Generally stable prices
S&P Global Ratings expects average prices for most of the metals and mining commodities we track to remain relatively flat in 2019 and 2020. Our price assumptions primarily reflect generally balanced market conditions related to steady global demand growth without a significant increase in output. However, we acknowledge that inherent volatility will emerge, particularly given the pressures from a stronger U.S. dollar and trade tensions between the U.S.and China. We published our most recent price assumptions in September 2018 (see “S&P Global Ratings Lowers Copper And Zinc Price Assumptions; Other Metal Price Assumptions Are Unchanged,” Sept. 11, 2018).
2. Balance sheet preservation
We continue to expect the majority of issuers to remain focused on strong balance sheets. Many of the large globally diversified mining companies have already achieved their financial objectives, including lower absolute debt levels, and will now turn to maximizing shareholder returns. In aggregate, downstream companies are likely to remain more leveraged than their upstream counterparts, although many are also paying down debt to improve financial resilience (Please refer to the financial policy section).
3. Cost inflation
Higher energy prices in 2018 fueled inflation across the industry, with higher electricity and diesel bills and freight costs. In 2019, we don’t see a wall of inflation, but rather small pockets of higher demand for special skills or machinery (given mining's labor intensity). We understand that small suppliers disappeared during the 2016-2017 downturn, and if demand for services picks up, the existing suppliers would be able renegotiate slightly better commercial conditions. Most of the companies plan to address the cost inflation by further improving productivity--including more automation, imaging technology, and changes in mine plans, among others. A key focus of management will be securing the costs for committed capex projects to reduce potential exposure to cost overruns.
4. Steel industry profitability
We expect steel producers to maintain their current healthy margins through 2019, resulting in another strong year of financial performance. In our view, this performance will reflect our expectation of relatively steady global supply, underpinned by healthy GDP growth in most markets because construction, manufacturing, and automotive sectors continue to expand. Moreover, steel inventory levels are generally below average, implying that restocking could supplement end-user demand growth.
Lastly, we expect China's demand for steel will remain a key driver this year following last year's stronger-than-expected demand. Capacity reductions and environmental initiatives introduced in China over the last 18 months should also contribute to favorable operating conditions.
S&P Global Ratings |
November 12, 2018 7 |

vk.com/id446425943
Industry Top Trends 2019: Metals and Mining
Key risks and opportunities
Metals and Mining
1. China and trade
If a trade war affects the real economy, it could hurt global demand and commodity prices. Although the Chinese government could potentially raise infrastructure investments to mitigate the impact of a demand slowdown, the need to deleverage the whole economy may constrain how much spending can increase. China’s fixed assets investment (FAI) has been declining this year--for the first nine months of the year, China’s FAI grew by 5.4% versus 7.5% in the same period last year. Among FAI, infrastructure investment only grew by 3.3%. Chinese producers could also increase steel and aluminum output to support local employment, which would pressure prices globally.
2. Price volatility
We assume most metals and mining commodity prices will remain relatively stable in 2019 and 2020, but prices for these are inherently volatile and could deviate significantly from our assumptions. Several risks have recently emerged, notably on the downside. Most issuers have high operating leverage that would be affected by relatively small changes in prices. As such, average prices modestly below our assumptions can have a meaningful impact on our estimates and, potentially, on credit profiles and our outlook for the sector.
3. A sharp downturn in the global economy in 2019
Government policy and geopolitical risks could significantly affect commodity markets. Resource nationalism and labor unrest remain key risk factors in developing markets, notably in African and Latin American countries. Numerous strikes in the South African gold industry and adverse regulatory and legal actions in Tanzania and South Africa are several recent examples. In addition, the impact of government-mandated export restrictions in certain countries, the effects of supply reform in China, and developments related to the new pending United States-Mexico-Canada Agreement (USMCA) and Brexit could also lead to market volatility. The U.S. government's proposal to replace the Clean Power Plan (CPP) with the Affordable Clean Energy (ACE) rule won't fundamentally change the trajectory of coal-fired capacity retirement. In addition, foreign currency becomes a greater risk as U.S.-based coal producers’ shift to export markets to offset declining domestic demand.
4. Restrained capex could cause supply shortages and higher prices
The completion of past projects and the relatively modest projects in the pipeline should translate into a muted supply increase for most commodities. For example, we expect the iron ore and copper supply to increase by 0%-3% in each of the next few years. Unlike iron ore, where we see a structural decline over the next couple of years, copper could enter into a structural deficit in upcoming years. Despite the potential healthy demand for copper, mining companies have seemed to prefer to wait for even tighter market conditions before they approve new projects. One of the potential new greenfield copper mines, Resolution in Arizona, US (owned by Rio Tinto Ltd. and BHP), is still in early stages, and the first copper available from that mine isn't expected before 2022.
Globally, steel and aluminum supply remain disciplined, with environmental and energy policy initiatives in China containing overcapacity. Moreover, we don't expect tariffs to stimulate much incremental production in the U.S., mostly because of the heavy capital required to bring this marginal capacity to world standards.
S&P Global Ratings |
November 12, 2018 8 |
vk.com/id446425943
Industry Top Trends 2019: Metals and Mining
Financial policy
Upstream
We anticipate that the prevailing mood of balance sheet conservatism will persist next year. Based on the recent capex guidance, spending in 2019 and 2020 will remain fairly flat. In addition, we don’t see large or transformative acquisitions. Most assets available for sale have cost profiles in the third or fourth quartiles within the industry cost curve, while cost-competitive assets remain scarce. Moreover, at this point, we believe most producers view prospective acquisitions as too expensive relative to brownfield expansion projects. For example, Toronto-based Barrick Gold Corp. recently announced an all-equity, no premium acquisition of Randgold Resources Ltd., which could suggest that producers are becoming more receptive to larger-scale investments in the sector.
This year, most of the major miners achieved their financial objectives and positioned their absolute debt levels towards the lower part of their financial policy or even below their official debt target. Unlike an improvement in credit metrics on the back of better prices, the reduction in the absolute debt enables companies to be much more resilient in the next downturn.
In our view, the major miners are well-positioned to absorb a potential external shock after completing their debt reduction plans, supported by a currently low commitment to growth capex. Under our stress test, an extended price shock doesn't lead to downgrades (see “How Would The Top Five Global Miners Fare In A Downturn?," July 9, 2018).
In our view, already low debt levels and limited appetite for aggressive growth will likely translate into another year of high returns to shareholders. Based on our working price assumptions for 2019 and 2020, we expect that the returns to the shareholders will increase to all-time highs.
In addition, assets sales, which companies used in previous years in part to strengthen balance sheets, will further increase the return to shareholders. For instance, BHP recently concluded the divestment of its shale assets in the U.S. for $10.2 billion, all of which it will distribute to its shareholders.
From a rating perspective, we assume that major miners will maintain ample rating headroom in 2019. In our view, continued execution of debt repayment and adherence to other credit-supportive financial policies could lead to selective positive rating actions, like those of Anglo American PLC and Teck Resources Ltd.. That said, the possibly volatile metals and mining commodity prices, the changes in asset qualities, and prospective growth initiatives will remain key considerations.
Downstream
The deleveraging trend that started with the largest global miners hasn't skipped downstream companies. Increasingly, companies publicly announcing their objective to significantly reduce their absolute debt level, and in some cases, run the business without any debt. We believe these issuers have acknowledged that the current healthy industry conditions aren't likely to last, and view a strong balance sheet as prudent in advance of the next downturn.
One example of the change in the industry's approach to debt is apparent among the Russian steel makers. PAO Severstal, Novolipetsk Steel, and others adopted very transparent financial policies that link actual performance and the return to shareholders, while keeping robust balance sheets.
In the U.S., we continue to view refinancing and liquidity concerns as some of the more influential factors for credit quality in the next few months. However, large maturity walls have been reduced by nearly a half: $3 billion or about 25% of the sector's outstanding
S&P Global Ratings |
November 12, 2018 9 |

vk.com/id446425943
Industry Top Trends 2019: Metals and Mining
debt is due by 2021 compared to $6 billion last year. This change should provide some cushion in next downturn.
The fragmented steel industry and the positive price environment may incentivize more companies to pursue mergers and acquisitions. Some of the sizeable undergoing transactions include ArcelorMittal's acquisition of Ilva l and ArcelorMittal and the Ruia family's bid over the Indian steel producer Essar Steel.
Downstream companies could see some upgrades if they continue to prioritize debt reduction while improving their credit metrics through the cycle.
Related Research
–When The Cycle Turns: U.S. Coal Companies Seek Pay Dirt In Exports, Oct. 26 2018
–FAQ: How S&P Global Ratings Formulates, Uses, And Reviews Commodity Price Assumptions, Sept. 28. 2018
–S&P Global Ratings Lowers Copper And Zinc Price Assumptions; Other Metal Price Assumptions Are Unchanged, Sep 11, 2018
–The Top Five Rating Factors For Emerging Market Steelmakers, Jan. 31, 2018
–Industry Top Trends 2018: Metals And Mining, Nov. 13, 2017
–Strong Cash Flows: The Latest Surprise For Big Miners, March 13, 2017
This report does not constitute a rating action.
S&P Global Ratings |
November 12, 2018 10 |