

vk.com/id446425943
INVESTMENT RESEARCH
RUSSIA | CONSUMER NOVEMBER 7, 2018 | 09:06 MSK
X5 Retail Group
GDR |
FIVE LI |
Recommendation |
BUY |
Last price |
$24.58 |
Target price |
(from $38.00) $31.00 |
Upside |
26% |
Free float |
36% |
|
|
Market cap |
$6,668 mln |
Enterprise value |
$9,553 mln |
ADT, 100 days |
$7.4 mln |
Prices as of November 5, 2018 |
|
Source: Bloomberg, Sberbank CIB Investment Research |
|
Lenta
GDR |
LNTA LI |
Recommendation |
BUY |
Last price |
$3.72 |
Target price |
(from $8.00) $5.50 |
Upside |
48% |
Free float |
58% |
|
|
Market cap |
$1,810 mln |
Enterprise value |
$3,268 mln |
ADT, 100 days |
$1.7 mln |
Prices as of November 5, 2018 |
|
Source: Bloomberg, Sberbank CIB Investment Research |
|
Magnit
GDR |
MGNT LI |
Recommendation |
HOLD |
Last price |
$14.00 |
Target price |
(from $20.00) $17.00 |
Upside |
21% |
Free float |
67% |
|
|
Market cap |
$7,134 mln |
Enterprise value |
$8,709 mln |
ADT, 100 days |
$32.2 mln |
Prices as of November 5, 2018 |
|
Source: Bloomberg, Sberbank CIB Investment Research |
|
O’Key
GDR |
OKEY LI |
Recommendation |
SELL |
Last price |
$1.59 |
Target price |
(from $2.10) $1.50 |
Upside |
6% |
Free float |
21% |
|
|
Market cap |
$427 mln |
Enterprise value |
$797 mln |
ADT, 100 days |
< $0.1 mln |
Prices as of November 5, 2018 |
|
Source: Bloomberg, Sberbank CIB Investment Research
Mikhail Krasnoperov |
+7 (495) 933 9838 |
|
Mikhail_Krasnoperov@sberbank-cib.ru |
Andrey Krylov |
+7 (495) 967 3980 x 68409 |
|
Andrey_Krylov@sberbank-cib.ru |
|
|
Russian Retail
Disrupted by Specialists
The macroeconomic backdrop is currently unsupportive for households, as it is redirecting wealth to the state budget and exporters. Meanwhile, specialized retailers are disrupting the industry and competitive pressure is at a peak. We see some of these headwinds abating in 2019. Plus, the sector is cheap. But for the stocks to re rate, the market needs margins to stabilize and LFLs to recover. We cut our aggregate EBITDA projection for 2018 19 by 5%. With a weaker ruble assumption, our target prices are cut by 23% on average. X5 Retail Group is our top pick, and Lenta is also a BUY. We reiterate our HOLD on Magnit and SELL on O’Key.
█Macro strategy favors investments, exports over consumption. Nominal food spending is set to grow 3.5% in 2018, lagging income growth and well below GDP growth in nominal terms. We assume there will be a convergence and that the sector’s growth will accelerate to 5.0% by the end of 2019. In the meantime, food inflation ticking up to 3% could provide support.
█Specialist retailers disrupting the market... Five niche players jointly generated revenues of R490 bln in 2017 (up 40%). If this were a single company, it would be the third largest player and the fastest growing one. We calculate that these specialists captured R120 bln from the top three public chains last year, or 4% of their revenues, pulling down the average EBITDA margin by 1.2 pp and annual LFL sales growth by around 1 pp.
█…competition between conventional players should ease. This year, 2.2 mln m2 of modern food retail space to be added, a significant drop from the average of 3.0 mln m2 over 2014 17. We see space growth slowing to 4% in 2019 (from the previous average of 10%) and dropping below the industry’s average revenue growth in 2020, suggesting tailwinds for LFLs.
█Magnit’s new strategy no game changer. If fully implemented, the strategy should ensure a 12% revenue CAGR and 13% space CAGR through 2023. The plans for regions outside of Moscow are not overly ambitious, and the company aims to compete on assortment, not prices. But it aims to triple revenues in Moscow, even though Pyaterochka already has the best locations.
█Stocks are cheap based on cash flows. Aggregate capex of R170 bln in 2018 equates to 16% of the top three public chains’ aggregate market cap. Simplifying a bit, companies could replace growth with a 16% dividend yield. Such a move would be followed by a bounce in LFLs and margins, as it would cut industry space growth to less than 1%.
█We trim forecasts and targets. We cut our 2019 aggregated revenue projection by 5% on the back of weaker LFLs and slower expansion. We reduce our EBITDA projections by 6% on average. We also incorporate a new long term USD/RUB forecast of 66.0. This reduces our target prices by 23% on average. X5 Retail Group is our top pick, and Lenta is also a BUY. We reiterate our HOLD recommendation on Magnit and SELL on O’Key.
THIS REPORT MAY NOT BE INDEPENDENT OF THE PROPRIETARY INTERESTS OF SBERBANK CIB USA, INC. OR ITS AFFILIATES (TOGETHER, “SBERBANK”). SBERBANK TRADES THE SECURITIES COVERED IN THIS REPORT FOR ITS OWN ACCOUNT AND ON A DISCRETIONARY BASIS ON BEHALF OF CERTAIN CLIENTS. SUCH TRADING INTERESTS MAY BE CONTRARY TO THE RECOMMENDATION(S) OFFERED IN THIS REPORT.
In accordance with US SEC Regulation AC, important US regulatory disclosures and analyst certification can be found on the last page of this report.
research@sberbank-cib.ru, http://research.sberbank-cib.com
This document is being provided for the exclusive use of strogaas@baltinvest.com |
This document is being provided for the exclusive use of strogaas@baltinvest.com |

vk.com/id446425943
NOVEMBER 7, 2018 RUSSIAN RETAIL – DISRUPTED BY SPECIALISTS
Contents |
|
Macroeconomics and Industry Trends.............................................................................................. |
3 |
Specialists: The Real Disruptors of Food Retail .................................................................................. |
7 |
Competition and Cannibalization ................................................................................................... |
14 |
Magnit’s Strategy: The Only Risks Are in Moscow .......................................................................... |
17 |
Sector Valuations ........................................................................................................................... |
20 |
Forecast Changes ........................................................................................................................... |
23 |
X5 Retail Group ........................................................................................................................ |
23 |
Lenta ........................................................................................................................................ |
23 |
Magnit...................................................................................................................................... |
24 |
O’Key........................................................................................................................................ |
25 |
Company Data Profiles ................................................................................................................... |
26 |
X5 Retail Group ........................................................................................................................ |
27 |
Lenta ........................................................................................................................................ |
28 |
Magnit...................................................................................................................................... |
29 |
O’Key........................................................................................................................................ |
31 |
2 |
SBERBANK CIB INVESTMENT RESEARCH |
This document is being provided for the exclusive use of strogaas@baltinvest.com |
This document is being provided for the exclusive use of strogaas@baltinvest.com |
vk.com/id446425943
RUSSIAN RETAIL – DISRUPTED BY SPECIALISTS NOVEMBER 7, 2018
Macroeconomics and Industry Trends
STATE POLICY PRIORITIZES INVESTMENT DRIVEN OVER CONSUMPTION DRIVEN ECONOMIC GROWTH
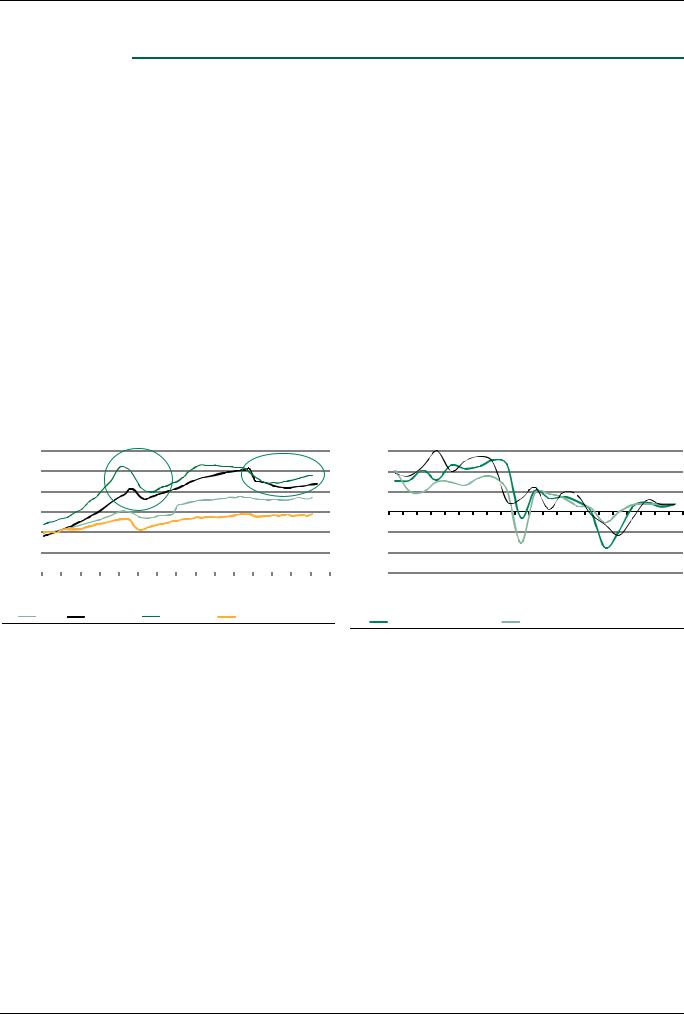
Historically in Russia retail growth has outpaced GDP growth and has also been more resilient. A good example of this is the 2009 economic downturn. Back then retail sales dropped by 5% (versus 9% for production) but then returned to pre downturn levels in just a year. This is in contrast to the three years it took investments to recover and the two years it took industrial production. Driven by real income and retail debt growth, retail sales increased 21% over 2010 14. But the next downturn, which began in 2015, painted a different picture: industrial production decreased by just 2% versus 2014, as the weaker ruble spurred import substitution. Meanwhile, when retail sales plunged in 2015, not only did they not recover quickly (as they had in the last downturn), they continued to decline for two more years. The result was that by 2017 they were down 13% versus 2014. This came on the back of a real income decline of 11%. Certainly a key reason for this is the lower oil price and weaker ruble, but the situation is being exacerbated by state initiatives. For instance, the so called budget rule is keeping the exchange rate below the level justified by the oil price and growth in social spending has been limited in recent years.
GDP and other economic indicators, real terms |
|
|
|
|
|
Real disposable income, CPI and private consumption, y o y |
||||||||||||||||||||||||||||||||
350% |
|
|
|
|
|
|
|
|
|
|
|
|
|
|
|
|
15% |
|
|
|
|
|
|
|
|
|
|
|
|
|
|
|
|
|
|
|
|
|
300% |
|
|
|
|
|
|
|
|
|
|
|
|
|
|
|
|
10% |
|
|
|
|
|
|
|
|
|
|
|
|
|
|
|
|
|
|
|
|
|
250% |
|
|
|
|
|
|
|
|
|
|
|
|
|
|
|
|
5% |
|
|
|
|
|
|
|
|
|
|
|
|
|
|
|
|
|
|
|
|
|
200% |
|
|
|
|
|
|
|
|
|
|
|
|
|
|
|
|
0% |
|
|
|
|
|
|
|
|
|
|
|
|
|
|
|
|
|
|
|
|
|
150% |
|
|
|
|
|
|
|
|
|
|
|
|
|
|
|
|
5% |
|
|
|
|
|
|
|
|
|
|
|
|
|
|
|
|
|
|
|
|
|
100% |
|
|
|
|
|
|
|
|
|
|
|
|
|
|
|
|
10% |
|
|
|
|
|
|
|
|
|
|
|
|
|
|
|
|
|
|
|
|
|
50% |
|
|
|
|
|
|
|
|
|
|
|
|
|
|
|
|
15% |
|
|
|
|
|
|
|
|
|
|
|
|
|
|
|
|
|
|
|
|
|
2004 |
2005 |
2006 |
2007 |
2008 |
2009 |
2010 |
2011 |
2012 |
2013 |
2014 |
2015 |
2016 |
2017 |
2018 |
|
2000 |
2001 |
2002 |
2003 |
2004 |
2005 |
2006 |
2007 |
2008 |
2009 |
2010 |
2011 |
2012 |
2013 |
2014 |
2015 |
2016 |
2017 |
2018E |
2019E |
2020E |
||
GDP |
|
|
Retail sales |
|
Investment |
|
Industrial production |
|
Real food retail turnover |
|
|
GDP |
|
|
Real disposable income |
|
||||||||||||||||||||||
|
|
|
|
|
|
|
|
|
|
|
|
|
|
|
|
|
|
|
|
|
|
|
||||||||||||||||
Note: Seasonally adjusted, 1998 = 100%.
Source: State Statistics Service, Sberbank CIB Investment Research
Source: State Statistics Service, Sberbank CIB Investment Research
Strategically, the government is aiming to reduce the economy’s dependence on the oil price and move away from consumption driven growth. Documents issued following President Putin’s May decree provide an outlook for certain economic indicators. What is important is that there is a target to lift the share of investments from 21% of GDP in 2017 to 25% by 2025. In addition to what is expected to be annual GDP growth of around 2% over the next three years, it suggests investments should grow at a 5% CAGR. Our economists do not think investments will grow at such a high pace, but they do assume investment growth ahead of GDP growth. This implies that consumption should grow slower than GDP. Thus, we expect GDP to grow at 1.8% per annum, while consumption will lag at 1.1% real growth, declining from the 50% currently to 49% of GDP in 2021. It suggests a period of adjustment to household spending, albeit the bulk of this adjustment has already taken place (consumption was 53% of GDP in 2014).
SBERBANK CIB INVESTMENT RESEARCH |
3 |
This document is being provided for the exclusive use of strogaas@baltinvest.com |
This document is being provided for the exclusive use of strogaas@baltinvest.com |
vk.com/id446425943
NOVEMBER 7, 2018 |
RUSSIAN RETAIL – DISRUPTED BY SPECIALISTS |
|
|
State projections for key macro indicators, nominal terms |
|
Consumption as a share of GDP |
160 |
|
|
|
|
|
|
|
26% |
54% |
|
|
|
|
|
|
|
|
|
|
|
150 |
|
|
|
|
|
|
|
25% |
53% |
|
|
|
|
|
|
|
|
|
|
|
|
|
|
|
|
|
|
52% |
|
|
|
|
|
|
|
|
|
|
|||
|
|
|
|
|
|
|
|
|
|
|
|
|
|
|
|
|
|
|
||
140 |
|
|
|
|
|
|
|
24% |
51% |
|
|
|
|
|
|
|
|
|
|
|
|
|
|
|
|
|
|
|
|
|
|
|
|
|
|
|
|
|
|
||
130 |
|
|
|
|
|
|
|
23% |
50% |
|
|
|
|
|
|
|
|
|
|
|
120 |
|
|
|
|
|
|
|
22% |
49% |
|
|
|
|
|
|
|
|
|
|
|
|
|
|
|
|
|
|
48% |
|
|
|
|
|
|
|
|
|
|
|||
|
|
|
|
|
|
|
|
|
|
|
|
|
|
|
|
|
|
|
||
110 |
|
|
|
|
|
|
|
21% |
47% |
|
|
|
|
|
|
|
|
|
|
|
100 |
|
|
|
|
|
|
|
20% |
46% |
|
|
|
|
|
|
2018E |
2019E |
2020E |
2021E |
|
|
|
|
|
|
|
|
2011 |
2012 |
2013 |
2014 |
2015 |
2016 |
2017 |
|||||||
2017 |
2018 |
2019 |
2020 |
2021 |
2022 |
2023 |
2024 |
2025 |
||||||||||||
|
|
|
|
|
|
|
|
|
|
|
||||||||||
|
|
Investment share in GDP (rhs) |
|
|
Source: State Statistics Service, Sberbank CIB Investment Research |
|
|
|
|
|||||||||||
|
|
Fixed capital investment, 2017=100 |
|
|
|
|
|
|||||||||||||
|
|
|
|
|
|
|
|
|
|
|
|
|
|
|||||||
|
|
GDP, 2017=100 |
|
|
|
|
|
|
|
|
|
|
|
|
|
|
|
|||
Source: State Statistics Service, HSE Center of Development Institute, BP |
|
|
|
|
|
|
|
|
|
|
|
|
||||||||
UPSIDE FROM LEVERAGING IS NOT MATERIALIZING
There was a period of household deleveraging in Russia: total debt was R11.3 trln at the end of 2014, corresponding to 24% of annual income. In absolute terms, this level was only exceeded in 2H17, while in relative terms it had declined to 20% of income by July 2017 and has since recovered only modestly. This may suggest a tailwind for consumption, but in reality this is not taking place. While we are indeed seeing resumed growth in lending, it is coming mostly in the form of mortgages. Retail loans are growing at a much slower pace due to both supply and demand factors. On the supply side, there no banks that are aggressively expanding their retail loans portfolios – banks that were doing so previously took a hit in 2015. On the demand side, households that suffered from excessive leverage are not keen to take on new debt, particularly at elevated interest rates.
A parallel trend is depletion of savings among the population. According to our Ivanov consumer confidence survey, the share of people without savings grew from 37% in 1H14 to 46% in 1H17, while the savings ratio dropped from 9.3% to 6.8% over the same time frame. Now this is behind and people with higher incomes have started rebuilding savings. This has begun showing up in our surveys: in the most recent one, people said that for every R1,000 of extra income, they would save 14% of it, higher than the current savings ratio of around 7%.
Our take is that the part of the population whose incomes are higher and have resumed growing are rebuilding their savings rather than increasing spending, taking out mortgages and investing in real estate. Those with sluggish income growth are not borrowing more but are increasing spending in line with income. This is what we see as underpinning consumption growing with a lag to income growth.
Lending growth y o y: retail vs mortgage |
|
Ivanovs’ food spending and savings ratios, % of income |
25% |
|
|
|
|
|
|
|
|
|
|
|
|
|
|
|
|
41% |
|
|
|
|
|
|
|
|
|
|
|
|
|
|
|
|
|
11% |
20% |
|
|
|
|
|
|
|
|
|
|
|
|
|
|
|
|
40% |
|
|
|
|
|
|
|
|
|
|
|
|
|
|
|
|
|
10% |
15% |
|
|
|
|
|
|
|
|
|
|
|
|
|
|
|
|
39% |
|
|
|
|
|
|
|
|
|
|
|
|
|
|
|
|
|
9% |
10% |
|
|
|
|
|
|
|
|
|
|
|
|
|
|
|
|
38% |
|
|
|
|
|
|
|
|
|
|
|
|
|
|
|
|
|
8% |
5% |
|
|
|
|
|
|
|
|
|
|
|
|
|
|
|
|
37% |
|
|
|
|
|
|
|
|
|
|
|
|
|
|
|
|
|
7% |
0% |
Aug ’10 |
|
Aug ’11 |
|
Aug ’12 |
|
Aug ’13 |
|
Aug ’14 |
|
Aug ’15 |
|
Aug ’16 |
|
Aug ’17 |
|
36% |
|
|
|
|
|
|
|
|
|
|
|
|
|
|
|
|
|
6% |
Feb ’10 |
Feb ’11 |
Feb ’12 |
Feb ’13 |
Feb ’14 |
Feb ’15 |
Feb ’16 |
Feb ’17 |
Feb ’18 |
1Q14 |
2Q14 |
3Q14 |
4Q14 |
1Q15 |
2Q15 |
3Q15 |
4Q15 |
1Q16 |
2Q16 |
3Q16 |
4Q16 |
1Q17 |
2Q17 |
3Q17 |
4Q17 |
1Q18 |
2Q18 |
3Q18 |
Mortgages/annualized income |
Total loans/annualized income |
|
|
Food spending |
Savings (rhs) |
|
|
||||
|
|
||||
|
|
||||
Source: Cint, Sberbank CIB Investment Research
 Retail loans/annualized income
Source: State Statistics Service, Sberbank CIB Investment Research
4 |
SBERBANK CIB INVESTMENT RESEARCH |
This document is being provided for the exclusive use of strogaas@baltinvest.com |
This document is being provided for the exclusive use of strogaas@baltinvest.com |
vk.com/id446425943
RUSSIAN RETAIL – DISRUPTED BY SPECIALISTS |
NOVEMBER 7, 2018 |
|
|
FOOD RETAIL LAGS INCOME GROWTH
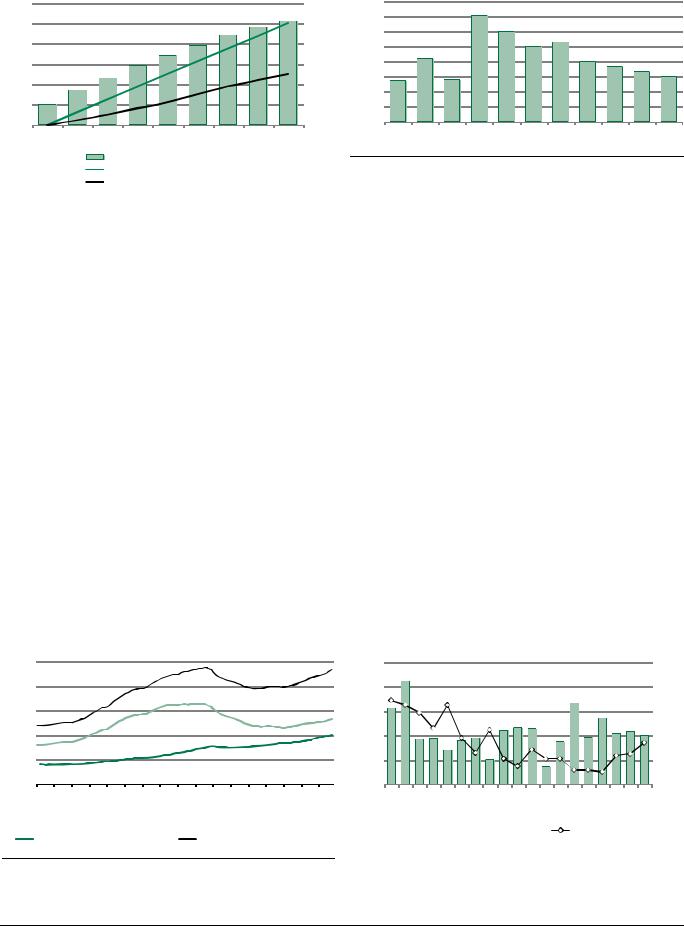
The State Statistics Service reported 10% wage growth in 3Q18, although we do not think this is representative (due to the recognition of under the table wages and methodological changes). What we think is more representative is nominal income: this figure grew just 3.7% in 3Q18, which translated into 3.2% nominal retail food sales growth (down from 4.0% in 2Q18). This came despite higher inflation. For 2018, we foresee nominal food retail growth at 3.5%, accounting for the 1.1 pp inflation component.
The industry is set to face several challenges in 2019. The VAT increase and higher fuel prices (due to the so called tax maneuver) will take a greater share of household income, while pension reform implies a direct negative impact on the total amount of income. On top of that, we see deteriorating consumer sentiment and higher spending on non food items (particularly cars, given the special loan rates already being financed by dealers).
Therefore, for 2019, we expect nominal food turnover to slightly lag nominal income. We expect food inflation to accelerate to 3.4%, translating into food retail growth of 4.5%, versus a nominal income increase of 5.0%.
Nominal income growth vs food retail sales growth, y o y Inflation and food retail turnover, y o y
15% |
|
|
|
|
8% |
3.1% |
5.1% |
6.0% |
5.6% |
3.4% |
3.3% |
3.9% |
4.0% |
3.6% |
4.4% |
3.1% |
3.6% |
2.9% |
3.4% |
3.7% |
4.0% |
4.5% |
|
|
|
|
|
4% |
|||||||||||||||||
10% |
|
|
|
|
6% |
|
|
|
|
|
|
|
|
|
|
|
|
|
|
|
|
|
|
|
|
|
|
|
|
|
|
|
|
|
|
|
|
|
|
|
|
|
|
|
|
5% |
|
|
|
|
|
|
|
|
|
|
|
|
|
|
|
|
|
|
|
|
|
|
|
|
|
|
|
2% |
|
|
|
|
|
|
|
|
|
|
|
|
|
|
|
|
|
0% |
|
|
|
|
0% |
|
|
|
|
|
|
|
|
|
|
|
|
|
|
|
|
|
|
|
|
|
|
|
|
|
|
|
|
|
|
|
|
|
|
|
|
|
|
|
|
5% |
|
|
|
|
2% |
1Q17 |
2Q17 |
3Q17 |
4Q17 |
Jan ’18 |
Feb ’18 |
Mar ’18 |
Apr ’18 |
May ’18 |
Jun ’18 |
Jul ’18 |
Aug ’18 |
Sep ’18 |
Oct ’18E |
Nov’18E |
Dec’18E |
2019E |
1Q13 2Q13 3Q13 4Q13 1Q14 2Q14 3Q14 4Q14 1Q15 2Q15 3Q15 4Q15 1Q16 |
2Q16 3Q16 4Q16 1Q17 2Q17 3Q17 4Q17 |
1Q18 2Q18 3Q18 |
4Q18E |
2019E |
|
|||||||||||||||||
Nominal income growth |
Food retail sales growth |
|
|
|
|
|
|
|
|
|
|
|
|
|
|
|
|
|
|
|
|
|
Source: State Statistics Service, Sberbank CIB Investment Research |
|
|
|
|
|
Real growth |
|
|
Food inflation |
|
|
Food retail growth |
|
|||||||||
|
|
|
|
|
Source: State Statistics Service, Sberbank CIB Investment Research |
|
|
|
|
|
|
|||||||||||
TRADING DOWN HASN’T INTENSIFIED, BUT TICKET BEING DILUTED BY GROWING NUMBER OF STORES VISITED
Despite the worse sentiment and less optimistic expectations about future personal wealth, according to our Ivanov survey, the share of people who traded down on food staples in the last few months was flat Q o Q at 64%. The use of strategies for saving money slightly decreased last quarter, as did the importance of price over quality. The share of those who monitor prices (always or at least on a regular basis) has been gradually decreasing since the beginning of 2016 and reached a record low of 70% in 3Q18 (versus 71% in 2Q18 and 74% in 4Q17). Meanwhile, the share of those cutting discretionary spending notably decreased.
SBERBANK CIB INVESTMENT RESEARCH |
5 |
This document is being provided for the exclusive use of strogaas@baltinvest.com |
This document is being provided for the exclusive use of strogaas@baltinvest.com |
vk.com/id446425943
NOVEMBER 7, 2018 RUSSIAN RETAIL – DISRUPTED BY SPECIALISTS
Have Ivanovs been trying to buy cheaper staples in the past two to three months?
100% |
|
|
|
|
|
|
|
|
|
|
|
|
|
|
|
|
80% |
42% |
40% |
33% |
29% |
28% |
29% |
30% |
28% |
28% |
27% |
28% |
32% |
33% |
33% |
33% |
|
|
||||||||||||||||
60% |
|
|
|
|
|
|
|
|
|
|
|
|
|
|
|
|
40% |
55% |
57% |
65% |
69% |
70% |
69% |
68% |
71% |
70% |
71% |
68% |
65% |
64% |
64% |
64% |
|
20% |
||||||||||||||||
|
|
|
|
|
|
|
|
|
|
|
|
|
|
|
||
0% |
1H14 |
2H14 |
1H15 |
2H15 |
1Q16 |
2Q16 |
3Q16 |
4Q16 |
1Q17 |
2Q17 |
3Q17 |
4Q17 |
1Q18 |
2Q18 |
3Q18 |
|
|
||||||||||||||||
|
|
|
|
Yes |
|
|
|
|
|
No |
|
|
|
|
|
Source: Cint, Sberbank CIB Investment Research
Factors behind store selection
Prices
Product quality
Assortment
Location
Number of promotion items
Atmosphere, interior and cleanliness
75%
73%
72%
64%
67%
67%
45%
47%
46%
41%
42%
42%
32%
35%
36%
28% |
25% |
28% |
0% |
20% |
40% |
60% |
80% |
||||
|
|
3Q17 |
|
2Q18 |
|
|
3Q18 |
|
|
|
|
|
|
||||
* cleanliness was not included in 2Q17
Source: Cint, Sberbank CIB Investment Research
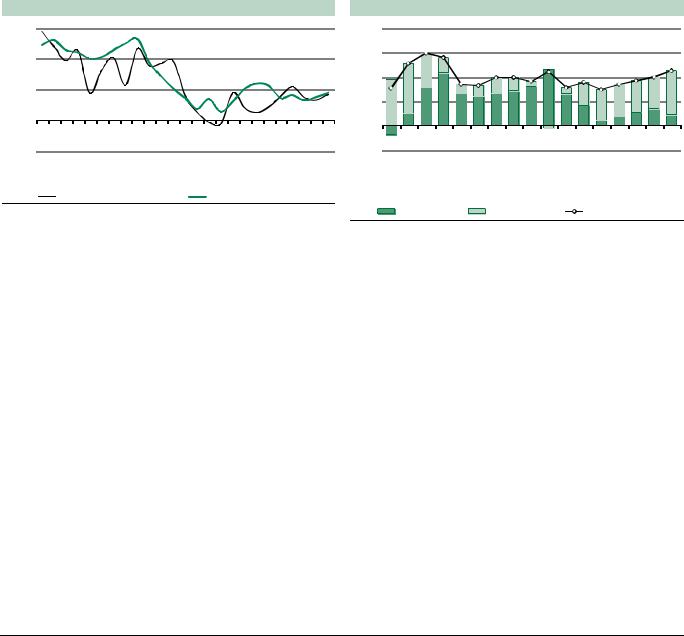
The frequency of grocery shopping trips (3.01 per week) stayed the same, although the number of chains visited rose. This suggests stable LFL traffic but a deteriorating LFL ticket at public retail chains. Thus, we expect top line growth to slow across public companies.
A positive observation is that the percentage of respondents who had recently noticed heavy promotions dropped below 47% for the first time since 4Q16. This indicates that the destructive promo war between retailers is easing, although a lot will depend on Magnit’s new management team (ending the promo war would be a rational step, in our view).
Number of chains at which the average Ivanov shops |
|
Number of respondents who noticed heavy promotions |
||||||||||||||||||||||||||
3.5 |
|
|
The number of chains visited by |
|
|
|
|
|
recently |
|
|
|
|
|
|
|
|
|
|
|
|
|||||||
|
|
|
|
|
|
|
|
|
|
|
|
|
|
|
|
|
|
|
|
|
||||||||
|
|
|
|
|
|
|
|
|
|
|
|
|
|
|
|
|
|
|
|
|
|
|||||||
3.0 |
|
|
|
customers visibly increased. |
|
|
|
|
|
52% |
|
|
|
|
|
|
|
|
|
|
50% |
|
|
|||||
|
|
|
|
|
|
|
|
|
|
|
|
|
|
|
|
|
|
49% |
|
|
|
|
|
|
|
|
||
2.5 |
|
|
|
|
|
|
|
|
|
|
|
|
|
|
50% |
|
48% |
|
|
|
|
|
|
|
|
|
||
2.0 |
|
|
|
|
|
|
|
|
|
|
|
|
|
|
|
|
|
|
|
47% |
47% |
47% |
47% |
47% |
|
47% |
|
|
1.5 |
|
|
|
|
|
|
|
|
|
|
|
|
|
|
48% |
|
|
|
|
|
46% |
|||||||
|
|
|
|
|
|
|
|
|
|
|
|
|
|
46% |
45% |
|
|
45% |
|
|||||||||
1.0 |
|
|
|
|
|
|
|
|
|
|
|
|
|
|
45% |
|
|
|||||||||||
|
|
|
|
|
|
|
|
|
|
|
|
|
|
|
|
|
|
|||||||||||
0.5 |
|
|
|
|
|
|
|
|
|
|
|
|
|
|
44% |
|
|
|
|
|
|
|
|
|
|
|
|
|
0.0 |
|
|
|
|
|
|
|
|
|
|
|
|
|
|
|
|
|
|
|
|
|
|
|
|
|
|
|
|
|
|
|
|
|
|
|
|
|
|
|
|
|
|
|
|
|
|
|
|
|
|
|
|
|
|
|
|
|
1H14 |
2H14 |
1H15 |
2H15 |
1Q16 |
2Q16 |
3Q16 |
4Q16 |
1Q17 |
2Q17 |
3Q17 |
4Q17 |
1Q18 |
2Q18 |
3Q18 |
42% |
1H15 |
2H15 |
1Q16 |
2Q16 |
3Q16 |
4Q16 |
1Q17 |
2Q17 |
3Q17 |
4Q17 |
1Q18 |
2Q18 |
3Q18 |
|
||||||||||||||||||||||||||||
Magnit |
|
Pyaterochka |
|
Lenta |
|
O’Key |
|
Dixy |
|
Other |
|
|
|
|
|
|
|
|
|
|
|
|
|
|
|
|||
Source: Cint, Sberbank CIB Investment Research |
Source: Cint, Sberbank CIB Investment Research |
|
6 |
SBERBANK CIB INVESTMENT RESEARCH |
This document is being provided for the exclusive use of strogaas@baltinvest.com |
This document is being provided for the exclusive use of strogaas@baltinvest.com |

vk.com/id446425943
RUSSIAN RETAIL – DISRUPTED BY SPECIALISTS NOVEMBER 7, 2018
Specialists: The Real Disruptors of Food
Retail
An important trend in Russian retail recently has been the rapid expansion of retailers specializing in certain categories. The business models of these players have provided them with several key advantages over big retailers: they are able to offer lower prices in their main categories, they can operate in smaller stores and they have much more flexibility with their assortment than their larger, less nimble peers.
As for the first advantage, in pricing strategy, food retailers typically compete on price in traffic generating categories, such as fresh produce and meat, but they charge a higher mark up on everything else to achieve the required profitability. Specialist retailers, meanwhile, pick one category that is profitable for the big players and offer it at lower prices. Naturally, they sacrifice some gross margin for that category (relative to the big players), but they enjoy superior traffic and revenues per m2, while having much lower opex and capex per m2. Also, as their scale grows, specialists gain leverage with suppliers to compensate for part of the lost margin.
Second, the sizes of the stores that specialists operate in would not be suitable for the big players. For example, the typical Red & White store is 80 m2, while the figure for Fix Price is a bit higher at 220 m2. However, this contrasts with the typical convenience store, which has total space of around 400 m2. This allows specialists to take advantage of good locations – and at lower rent rates – that would not be suitable for large retailers. Also, specialists are more flexible and can respond more quickly to changing market conditions. For example, a specialist may sign a contract with a new supplier and start sourcing merchandise in just a few weeks and then quickly remove the merchandise from the shelves if it does not sell well. For large public chains, this is a longer and more involved process.
There are five large specialists in Russia. Only one – Detsky Mir – is a publicly traded company, and it only marginally competes against food retailers. The others are alcohol specialists Red & White and Bristol, non food retailer Fix Price, and VkusVill. The last of the five follows a slightly different strategy: it does not offer lower prices (although it does have an effective loyalty program) but instead focuses on the all natural, health food niche. It has built up a strong reputation in areas with higher incomes, mostly for its dairy products.
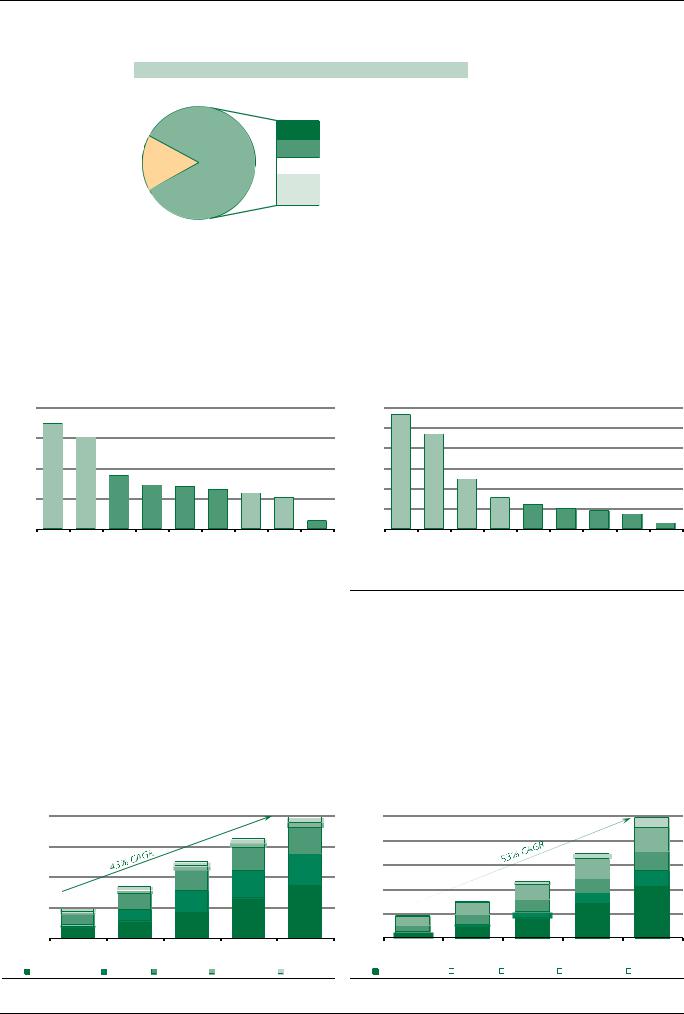
All five of the retail specialists have been performing extremely well in recent years: their combined revenues expanded from R89 bln in 2013 to R490 bln in 2017 (according to the companies, our estimates and Infoline). What makes this even more impressive is that this has happened during years of sluggish demand growth – several of Russia’s top five food retailers even experienced negative LFLs over this period.
We will consider the financial impact on public retail chains in detail later, but we will start with the findings from our Ivanovs survey, which confirm the attractiveness of the specialist concept. According to the survey, 84% of respondents regularly visit specialized retail stores (those specializing in meat, dairy, alcohol or goods for children). Out of those, 64% believe that the value proposition – a better assortment in the specific category, fresher products, lower prices – at such stores is better than at large retail chains.
SBERBANK CIB INVESTMENT RESEARCH |
7 |
This document is being provided for the exclusive use of strogaas@baltinvest.com |
This document is being provided for the exclusive use of strogaas@baltinvest.com |
vk.com/id446425943
NOVEMBER 7, 2018 RUSSIAN RETAIL – DISRUPTED BY SPECIALISTS
Do you visit specialized retailers and why?
Those who visit such stores (100%)
23%
20%
16% |
84% |
20% |
|
|
|
|
|
|
37%
 No, I don't visit such stores often
 Yes, because of the assortment
 Yes, because of the quality and freshness
 Yes, because of the prices
 Yes, because I don't see a meaningful difference
Source: Cint, Sberbank CIB Investment Research
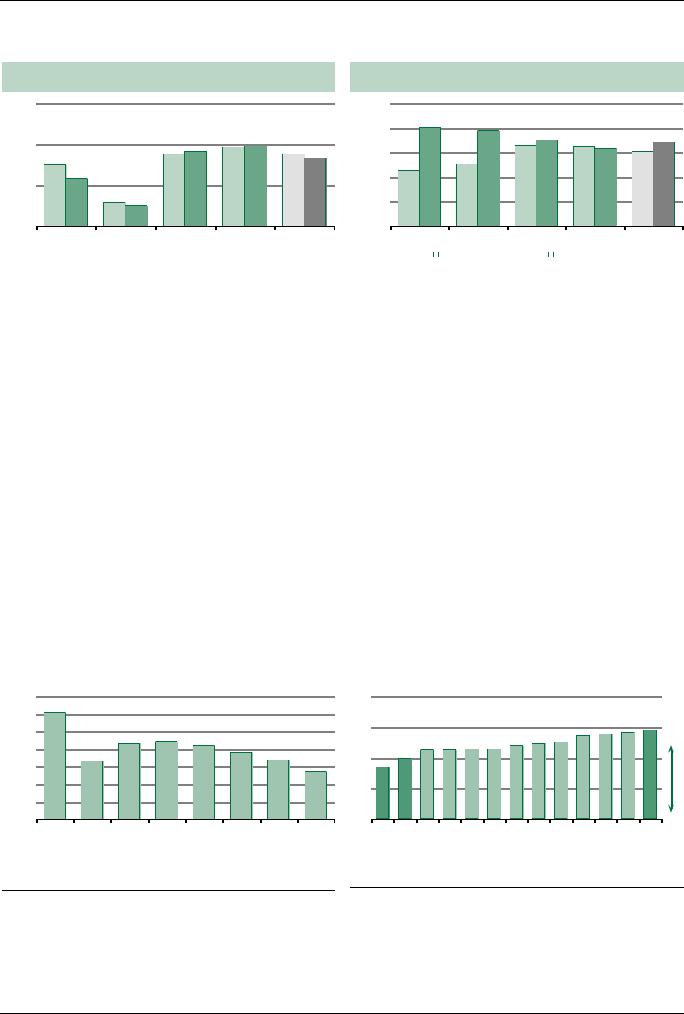
The footprint of the specialists, already substantial, is only growing. Some 35% and 28% of our respondents indicated that they lived within walking distance of a Fix Price or a Red & White, respectively. (The figure was 5% for VkusVill, which is a smaller chain and mainly operates in Moscow and Moscow Region.) On average, one third of those who have specialist stores nearby regularly shop there. This is a high ratio considering their focus on one category. However, the categories these stores operate in usually represent around 10% of the revenues of large food retailers.
Share of respondents, having store nearby |
|
Share of respondents, visiting chain |
80% |
69% |
|
|
|
|
|
60% |
|
|
|
|
|
|
|
|
60% |
60% |
|
|
|
|
|
50% |
|
|
|
|
|
|
40% |
|
|
|
|
|
|
|
|
|
40% |
35% |
|
|
|
|
|
30% |
|
29% |
28% |
26% |
23% |
|
|
20% |
|
|
|
21% |
|
|||
|
|
|
|
|
|||
20% |
|
|
|
|
|
||
|
|
|
|
|
|
10% |
|
|
|
|
|
|
|
5% |
|
|
|
|
|
|
|
|
|
0% |
|
|
|
|
|
|
0% |
Pyaterochka |
Magnit convenience |
Fix Price |
Detsky Mir |
Red & White |
VkusVill (Moscow) |
Lenta |
Perekrestok |
VkusVill (Russia) |
|
|
|
|
|
|
|
|
|
56% |
|
|
|
|
|
|
|
|
|
47% |
|
|
|
|
|
|
|
|
|
24% |
|
|
|
|
|
|
|
|
|
15% |
12% |
|
|
|
|
|
|
|
|
10% |
9% |
|
|
|
|
|
|
|
|
7% |
|
||
|
|
|
|
|
|
|
3% |
|
|
|
|
|
|
|
|
|
|
Pyaterochka |
Magnit convenience |
Lenta |
Perekrestok |
VkusVill (Moscow) |
Red & White |
Fix Price |
Detsky Mir |
VkusVill (Russia) |
* share of those who have Detsky Mir in walking or transport distance |
Source: Cint, Sberbank CIB Investment Research |
Source: Cint, Sberbank CIB Investment Research
Meanwhile, the total number of stores for the five specialists we’re discussing has grown from 2,804 in 2013 to 11,833 in 2017, while their combined revenues expanded from R89 bln in 2013 to R490 bln over the respective period. If these figures represented one company, it would already be the number three retailer by revenues and number one by number of stores and growth rates. Among the specialists, Red & White really stands out: it expanded from 1,000 stores at end 2013 to 5,268 at end 2017. It overlapped (in terms of proximity) with 32% of Pyaterochka stores in 2Q18. The number of Bristol locations, meanwhile, reached 3,040 in 2018, up from just 240 in 2013. Fix Price was third in terms of store count, with 2,461 in 2017, versus 1,000 in 2013.
Number of stores of five specialist retailers |
|
Revenues of five specialist retailers, R bln |
12,000 |
|
|
|
|
500 |
9,000 |
|
|
|
|
400 |
|
|
|
|
|
|
|
|
|
|
|
300 |
6,000 |
|
|
|
|
|
|
|
|
|
|
200 |
3,000 |
|
|
|
|
100 |
|
|
|
|
|
|
0 |
|
|
|
|
0 |
2013 |
2014 |
2015 |
2016 |
2017 |
2013 |
Red & White |
Bristol |
Fix Price |
Detsky Mir |
VkusVill |
Red & White |
2014 |
2015 |
2016 |
2017 |
|
Bristol |
|
Fix Price |
|
Detsky Mir |
|
VkusVill |
|
|
|
|
Source: Sberbank CIB Investment Research, Companies, Infoline Source: Sberbank CIB Investment Research, Companies, Infoline
8 SBERBANK CIB INVESTMENT RESEARCH
This document is being provided for the exclusive use of strogaas@baltinvest.com |
This document is being provided for the exclusive use of strogaas@baltinvest.com |

vk.com/id446425943
RUSSIAN RETAIL – DISRUPTED BY SPECIALISTS |
NOVEMBER 7, 2018 |
|
|
We can roughly calculate the impact that such expansion is having on public food retailers. We start with Red & White, the most significant disruptor. Its revenues increased almost tenfold from R23 bln in 2013 to R215 bln in 2017. According to a Bloomberg article, the top line is heading to R300 bln in 2018, which could place the company among the top five retailers for the year. We calculate that jointly the top three public retailers (X5 Retail Group, Magnit and Lenta) generated R306 bln in alcohol sales in 2017. So Red & White is already comparable to those three combined and is well above any single one of them. If we then take into account the lower prices at Red & White, volume wise the company should already be exceeding the top three combined. This almost certainly helps with procurement terms.
According to the Bloomberg article, the company offers 1,300 SKUs per store, of which two thirds are alcohol; the rest are in other food categories. We calculate that revenues per store amounted to R41 mln in 2017 and assume that revenues from alcohol were around R30 mln per store. For Pyaterochka, we assume that 11% of the chain’s revenues come from alcohol (based on information disclosed in 2015), which corresponds to R10 mln in alcohol sales per annum per store. That means that one Red & White store generates as much revenue as three Pyaterochkas.
But in reality, the revenue pressure is not that harsh. Consumers normally spend 40 50% of their grocery budget at their primary store and 20 25% at a second store. These ratios are confirmed by another question in the survey, which showed that 54% of visitors to Pyaterochka buy alcohol there if there is not an alcohol specialist nearby. Based on this data point, we can assume that 54% of their alcohol budgets are spent at the chain. At the same time, Red & White customers typically spend 40% of their alcohol budgets there. So when a Red & White store opens next to a Pyaterochka, the share of households’ alcohol budgets spent at Pyaterochka declines from 54% to 38%, according to our survey.
Putting all these factors together, we estimate that Red & White poaches 30 40% of a Pyaterochka store’s alcohol sales when one of its stores is opened nearby. For Pyaterochka, this is reflected as the share of revenues from the alcohol category dropping from 15 16% to 9 10%, on our calculations.
Red & White share in category budget (for those who |
Share of Pyaterochka visitors, buying selected categories |
|||||||||||||||||||||
shop there) |
|
|
|
|
|
|
100% |
|
|
83% |
|
|
|
|
|
|
|
|
|
|
|
|
|
|
|
|
|
|
|
|
74% |
65% |
69% |
49% |
45% |
79% |
74% |
43% |
38% |
71% |
56% |
54% |
38% |
||
50% |
Respondents who shop at Red & White don't |
|
|
|
||||||||||||||||||
|
|
|
|
|
|
|
|
|
|
|
|
|
|
|
|
|
||||||
|
|
40% |
80% |
|
|
|
|
|
|
|
|
|
|
|
|
|
|
|||||
40% |
just buy alcoholic beverages there. A significant |
|
|
|
|
|
|
|
|
|
|
|
|
|
|
|
|
|||||
|
|
|
|
|
|
|
|
|
|
|
|
|
|
|
|
|
||||||
portion of their spending in other categories |
|
|
|
|
|
|
|
|
|
|
|
|
|
|
|
|
|
|||||
|
|
|
60% |
|
|
|
|
|
|
|
|
|
|
|
|
|
|
|||||
|
goes to the chain as well. |
|
|
|
|
|
|
|
|
|
|
|
|
|
|
|
|
|
|
|||
30% |
|
|
26% |
|
|
|
|
|
|
|
|
|
|
|
|
|
|
|
|
|||
|
|
|
|
|
|
|
|
|
|
|
|
|
|
|
|
|
|
|
|
|
||
|
18% |
|
|
|
|
|
|
40% |
|
|
|
|
|
|
|
|
|
|
|
|
|
|
20% |
16% |
15% |
15% |
|
|
|
|
|
|
|
|
|
|
|
|
|
|
|
|
|
|
|
|
13% |
|
|
20% |
|
|
|
|
|
|
|
|
|
|
|
|
|
|
||||
|
|
|
|
|
|
|
|
|
|
|
|
|
|
|
|
|
|
|
|
|
||
|
|
|
|
|
|
|
|
|
|
|
|
|
|
|
|
|
|
|
|
|
|
|
10% |
|
|
|
|
|
|
|
|
|
|
|
|
|
|
|
|
|
|
|
|
|
|
0% |
|
|
|
|
|
|
|
0% |
Pasta, canned food |
|
Bread |
|
Meat |
Fruits and |
vegetables |
|
frozen food |
|
Soft drinks |
Alcoholic beverages |
||
Pasta, canned food |
Bread |
Meat |
Fruits and vegetables |
Fish and frozen food |
Soft drinks |
Alcoholic beverages |
|
|
|
Fish and |
|
|||||||||||
|
|
|
|
|
||||||||||||||||||
|
Without a Red & White nearby |
|
With a Red & White nearby |
|
|
Source: Cint, Sberbank CIB Investment Research |
Source: Cint, Sberbank Investment Research |
|
Based on the Ivanovs survey data, 33% of Pyaterochka stores overlap with Red & White. Multiplying that by 6% in lost revenues per store provides us with 2% of revenues directed to Red & White (or R25.9 bln in 2017). In Magnit’s case, the overlap is 35%. All else being equal, this suggests 2.1% of revenues lost to Red & White (R23.8 bln in 2017). We estimate the loss for Lenta at R5 bln. Moreover, although alcohol is Red & White’s primary focus, it also competes in soft drinks and other categories. We believe the chain took 0.5% of revenues, or R14 bln, from Russia’s three largest public retailers in 2017.
SBERBANK CIB INVESTMENT RESEARCH |
9 |
This document is being provided for the exclusive use of strogaas@baltinvest.com |
This document is being provided for the exclusive use of strogaas@baltinvest.com |
vk.com/id446425943
NOVEMBER 7, 2018 RUSSIAN RETAIL – DISRUPTED BY SPECIALISTS
Percentage of Magnit and Pyaterochka stores with Red & White in their territory
Percentage of Red & White stores with a Magnit or Pyaterochka in their territory
60% |
|
|
|
|
|
100% |
|
|
|
39% 39% |
|
|
80% |
40% |
|
35% 37% |
35% |
|
|
|
|
|
33% |
60% |
|||
30% |
|
|
|
|
||
|
|
|
|
|
||
|
|
|
|
|
|
|
23% |
|
|
|
|
|
40% |
20% |
|
|
|
|
|
|
11% 10% |
|
|
|
|
|
|
|
|
|
|
|
20% |
|
|
|
|
|
|
|
|
0% |
|
|
|
|
|
0% |
Moscow |
St Petersburg |
Megacities* |
Other |
Average |
|
|
81% |
78% |
|
|
|
|
|
|
70% |
|
|
|
|
|
66% |
65% 63% |
69% |
|
|
|
|
61% |
||
|
|
|
|
|
|
45% |
50% |
|
|
|
|
|
|
|
|
|
|
Moscow |
St Petersburg |
Megacities* |
Other |
Average |
|
|
|
Magnit |
|
Pyaterochka |
|
|
|
Magnit |
|
Pyaterochka |
|
|
|
|
|
||||||
|
|
|
|
|
|
|
|
|
||
* excluding Moscow and St Petersburg |
|
|
|
* excluding Moscow and St Petersburg |
|
|
||||
Source: Cint, Sberbank CIB Investment Research |
|
|
|
Source: Cint, Sberbank CIB Investment Research |
|
|
||||
All in all, this suggests to us that R68.7 bln, or one third of Red & White’s R215 bln in revenues last year, came from retail chains under our coverage. Assigning the same proportion to Bristol’s revenues of R59 bln, we get another R19 bln. It bears noting that these revenues were lost in the most profitable categories. The competition also prompted big retailers to reduce their prices to avoid even more significant revenue pressure. Hence, we assume at least a R25 bln negative impact on gross profit from the two alcohol specialists.
VkusVill had 670 stores as of September. While the company operates in 10 regions across Russia, close to 500 of its stores are in Moscow and Moscow Region. This is a major drag on Pyaterochka stores in and around the city, as around 30% of the chain’s Moscow stores overlap with VkusVill, on our calculations. We assume that VkusVill may poach 25 30% of Pyaterochka’s dairy revenues. We calculate that X5 Retail Group generated R45 bln in dairy revenues in Moscow in 2017 and that 23% of Pyaterochka shoppers also visit VkusVill. Including other categories and stores outside Moscow, we assume that VkusVill may have taken a total of R12 bln in dairy revenues from Pyaterochka in 2017. We do not account for any revenues captured from Magnit or Lenta (which do not have much of a presence in Moscow).
VkusVill is a retail chain that differentiates itself with quality and freshness, while its prices are in fact perceived as being the highest among nationwide chains. In order to curb an outflow of customers, X5 has signed an agreement to sell VkusVill products at Pyaterochka stores.
The share for VkusVill in category budgets |
|
Index of consumer price perceptions |
35% |
30% |
|
|
|
8 |
30% |
|
|
|
|
|
|
|
|
|
|
|
25% |
22% |
22% |
|
|
6 |
21% |
|
|
|||
|
|
|
|
||
20% |
|
|
19% |
|
|
17% |
|
17% |
|
4 |
|
|
|
|
|||
15% |
|
|
|
14% |
|
|
|
|
|
||
|
|
|
|
|
|
10% |
|
|
|
|
2 |
|
|
|
|
|
|
5% |
|
|
|
|
|
0% |
|
|
|
|
0 |
Milk and dairy products |
Pasta, canned food |
Bread |
Meat |
Fruits and vegetables |
Fish and frozen food |
Soft drinks |
Alcoholic beverages |
|
|
|
|
|
|
|
|
5.7 |
5.8 |
prices |
|
|
|
|
|
|
5.5 |
5.5 |
High |
||
|
|
|
|
|
|
|
||||
4.5 |
4.5 |
4.6 |
4.6 |
4.8 |
4.9 |
5.0 |
|
|
|
|
|
|
|
|
|
|
|
||||
3.9 |
|
|
|
|
|
|
|
|
|
|
3.4 |
|
|
|
|
|
|
|
|
|
|
Fix Price |
Red & White |
Magnit convenience |
Dixy |
Magnit hypermarkets |
Pyaterochka |
Lenta |
O'Key |
Karusel |
Metro |
Azbuka Vkusa |
Perekrestok |
VkusVill |
Low prices |
Source: Cint, Sberbank CIB Investment Research |
Source: Cint, Sberbank CIB Investment Research |
|
Of course, not all of the revenues of specialists should be considered as direct competition to the big food retailers. For instance, Detsky Mir competes against hypermarkets and convenience stores only in the baby product category, which accounts for 35% of its total revenues (R97 bln in 2017). In the case of Fix Price, only 20% of revenues are generated from branded products; the rest come from
10 |
SBERBANK CIB INVESTMENT RESEARCH |
This document is being provided for the exclusive use of strogaas@baltinvest.com |
This document is being provided for the exclusive use of strogaas@baltinvest.com |
vk.com/id446425943
RUSSIAN RETAIL – DISRUPTED BY SPECIALISTS |
NOVEMBER 7, 2018 |
|
|
private label, though category wise a major part of Fix Price’s assortment indirectly competes with hypermarkets. We therefore can make a rough assumption that 60% of Fix Price’s revenues (R80 bln total in 2017) come from merchandise that is also offered at hypermarkets. Our rough calculation is that revenues from overlapping categories amounted to a combined R62 bln for Fix Price and hypermarkets in 2017, of which one third, or R20 bln, may have been captured from big players.
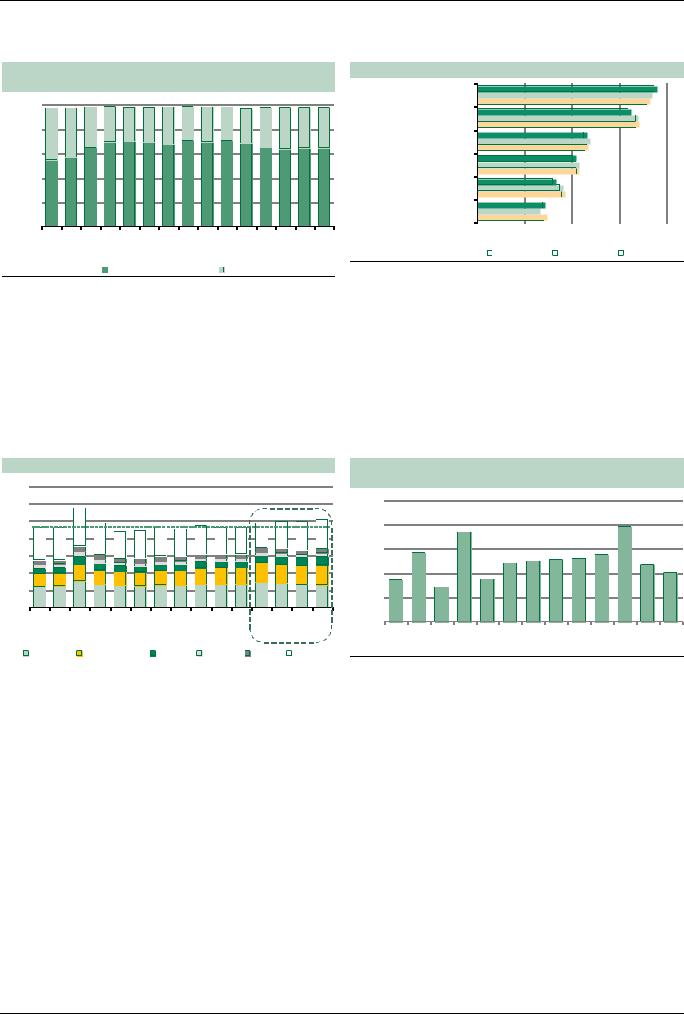
All together, we believe that R120 bln in revenues and R35 bln in gross income was taken from the top three food retailers by specialists in 2017. This corresponds to 4.3% of revenues and 1.2 pp of margin and 1.0 pp LFL. This figure should be even higher this year and may exceed 4.8% of revenues, as the five leading specialists are set to further boost consolidated revenues from R490 bln in 2017 to R630 bln in 2018.
Revenues of the top three retailers assuming no revenues |
|
Potential EBITDA and margins assuming no specialists |
|
lost to specialists and actual and potential LFL growth |
300 |
11% |
|
|
|||
4,000 |
|
|
|
|
20% |
250 |
|
|
|
|
10% |
|
|
|
|
|
|
|
|
|
|
||
|
|
|
|
|
|
|
|
|
|
|
|
3,000 |
|
|
|
|
15% |
200 |
|
|
|
|
9% |
|
|
|
|
|
|
|
|
|
|||
|
|
|
|
|
|
|
|
|
8% |
||
|
|
|
|
|
|
150 |
|
|
|
|
|
|
|
|
|
|
|
|
|
|
|
7% |
|
2,000 |
|
|
|
|
10% |
|
|
|
|
|
|
|
|
|
|
100 |
|
|
|
|
|
||
|
|
|
|
|
|
|
|
|
|
6% |
|
|
|
|
|
|
|
|
|
|
|
|
|
1,000 |
|
|
|
|
5% |
50 |
|
|
|
|
5% |
|
|
|
|
|
|
|
|
|
|||
|
|
|
|
|
|
0 |
|
|
|
|
4% |
0 |
|
|
|
|
0% |
2013 |
2014 |
2015 |
2016 |
2017 |
2018E |
|
|
|
|
|
|
|
|
|
|
||
2013 |
2014 |
2015 |
2016 |
2017 |
2018E |
|
|
|
|
|
|
|
|
|
|
|
|
|
|
|
|
|
|
Specialist effect on EBITDA |
|
|
|
|
|
|
|
|
|
|
|
|
|
|
|
|
|
Specialist effect on revenues |
|
Revenues, actual |
|
|
|
|
|
EBITDA, actual |
|
|
|
|
|
|
|
|
|
|
|||
|
|
|
|
LFL, actual (rhs) |
LFL, no specialists scenario (rhs) |
|
|
|
|
|
EBITDA margin, actual (rhs) |
|
|
|
|
|
|||||||||
|
|
|
|
|||||||||
|
|
|
|
|
|
|
|
|
|
|
|
EBITDA margin, no specialists scenario (rhs) |
Source: Companies, Sberbank CIB Investment Research |
|
|||||||||||
|
|
|
|
|
|
|||||||
|
|
|
|
|
|
|||||||
|
|
|
|
|
|
|
||||||
|
|
|
|
|
|
|
|
Source: Companies, Sberbank CIB Investment Research |
||||
When discussing the future impact of specialists on food retailers, there are several factors that should be considered. First, a negative one: in its native Urals district, Red & White overlaps with 75% of Pyaterochka stores, while the average overlap in other districts is 30%. The number of stores per person in the Urals district is four times higher than elsewhere. If one were to use Urals district as a reference and assume comparable densities/overlap will be achieved in the rest of Russia, then we would be just halfway to the chain’s disruption potential, and another 3% of revenues in profitable categories could be taken from big chains. The risks are definitely high in Moscow: Red & White has just 221 stores there, with overlap of just 23% with Pyaterochka.
Overlap of Red & White with Pyaterochka stores
80% |
|
|
|
|
|
|
|
|
|
60% |
|
|
|
|
|
|
|
|
|
40% |
|
|
|
|
|
|
|
|
|
20% |
|
|
|
|
|
|
|
|
|
0% |
Moscow |
Volga |
|
|
|
|
Central |
|
Average |
Far East |
Petersburg |
Northwest |
Siberia |
Urals |
Southern |
||||
|
|
|
St |
|
|
|
|
|
|
Source: Cint, Sberbank CIB Investment Research
A second negative factor to take into account is that specialists are still adding stores at a rapid pace. Based on our data, Red & White has opened more than 1,200 stores since the beginning of 2018 (expanding the store count by 20%). VkusVill has added some 220 stores in Moscow in the last
SBERBANK CIB INVESTMENT RESEARCH |
11 |
This document is being provided for the exclusive use of strogaas@baltinvest.com |
This document is being provided for the exclusive use of strogaas@baltinvest.com |
vk.com/id446425943
NOVEMBER 7, 2018 RUSSIAN RETAIL – DISRUPTED BY SPECIALISTS
twelve months, compared with Pyaterochka’s 450. This marks a pickup in the pace of expansion for VkusVill. We expect the chain’s growth to peak this year and then decelerate afterward, as we are already seeing signs of increased cannibalization among specialized stores.
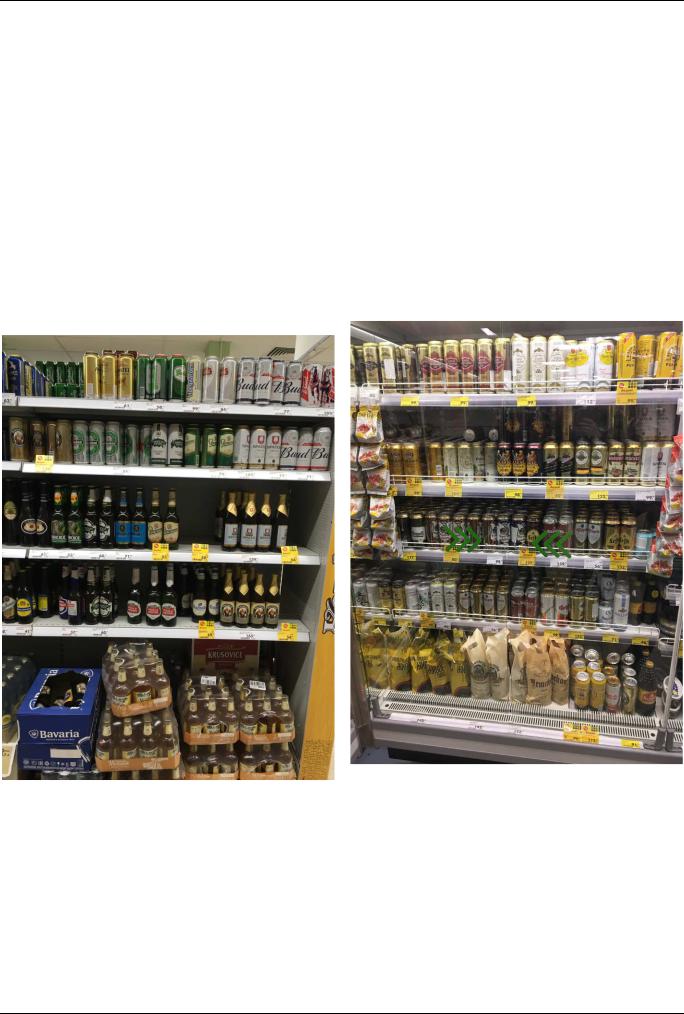
However, one positive factor for the big food retailers is that prices are no longer a competitive advantage for specialists. As we mentioned above, the categories they specialize in used to be overpriced at Russia’s big retail chains, which was the main reason why specialists were able to take hold so quickly. In our recent store visits, we noticed that Pyaterochka’s prices in some of these categories were already on par with specialists, while Magnit’s were much closer than before. Presumably, both companies monitor prices at specialist retailers closely. Given how the price gap has narrowed, we expect the outflow of customers from the big chains to specialists to slow substantially.
Below are pictures from our price check on imported beer two years ago and just recently. Prices at Pyaterochka were lowered from R150 160 to less than R100 between our two visits.
Pyaterochka used to offer Spaten cans for R143 and |
|
… but now both are priced below R100 |
Franziskaner for R139… |
|
|
Source: Sberbank CIB Investment Research
Source: Sberbank CIB Investment Research
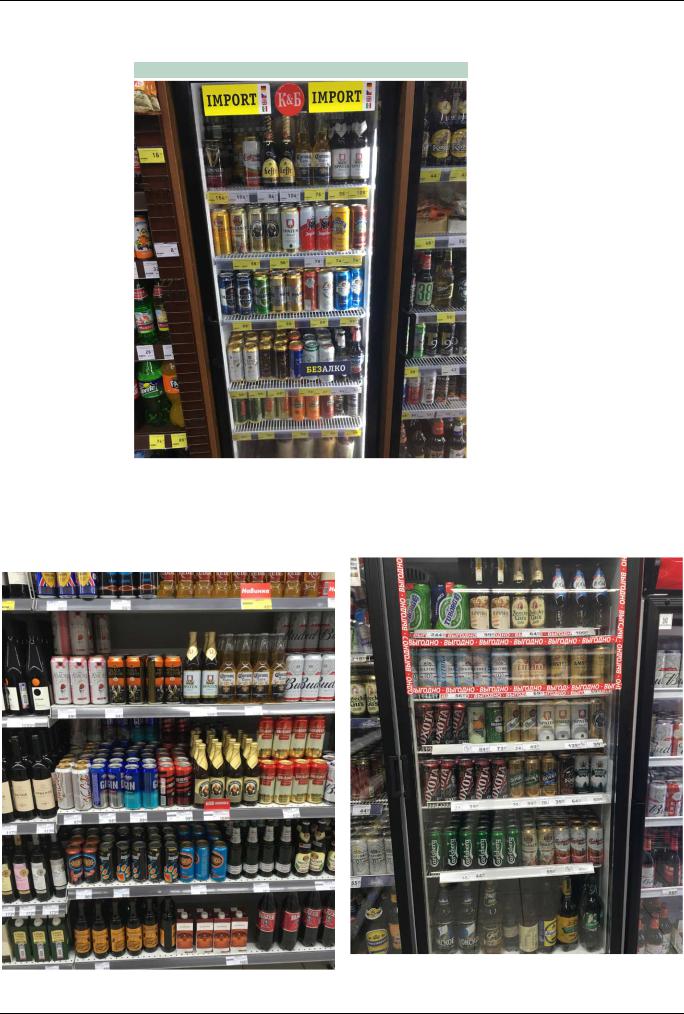
The prices are now on par with those of Red & White, which offers similar SKUs for R96 104, which is about the same as two years ago.
12 |
SBERBANK CIB INVESTMENT RESEARCH |
This document is being provided for the exclusive use of strogaas@baltinvest.com |
This document is being provided for the exclusive use of strogaas@baltinvest.com |
vk.com/id446425943
RUSSIAN RETAIL – DISRUPTED BY SPECIALISTS NOVEMBER 7, 2018
Prices at Red & White
Source: Sberbank CIB Investment Research
Magnit is also adjusting its prices, but at a slower pace. Its prices are also comparable with those offered by Red & White, but its range of imported beer is narrower than Pyaterochka’s.
Magnit offered Spaten and Franziskaner for R169 two |
|
… but now they cost R139 and R99 |
years ago… |
|
|
Source: Sberbank CIB Investment Research
Source: Sberbank CIB Investment Research
SBERBANK CIB INVESTMENT RESEARCH |
13 |
This document is being provided for the exclusive use of strogaas@baltinvest.com |
This document is being provided for the exclusive use of strogaas@baltinvest.com |