

Standard Chartered - Global Market Outlook_watermark
.pdfvk.com/id446425943
Macro Strategy | 2 May 2019
Global Market Outlook |
1 |
|
|
Can this rally extend?
In our Global Investment
Committee’s assessment, the rally in risky assets has room to extend further over the next 12 months, though near-term periods of consolidation are possible.
Global PMIs and earnings revisions are ticking higher. Valuations, technicals and market diversity are not likely to constrain further gains.
We favour equities over bonds, alternative strategies and cash.
Within equities, we prefer Asia ex-Japan, and within bonds, we prefer EM USD government bonds and Asia USD bonds. The USD is likely to weaken.
‘Sell-in-May’ seasonality is a near-term risk. We also continue to watch trade relations and oil price risks closely.
This reflects the views of the Wealth Management Group |
1 |

vk.com/id446425943Standard Chartered Bank
Global Market Outlook | 2 May 2019
Contents
1 |
|
2 |
3 |
||
|
|
|
|
|
|
Highlights |
|
Strategy |
Perspectives |
||
01 Can this rally extend? |
|
03 Investment strategy |
06 |
Perspectives on key client |
|
|
|
|
|
|
questions |
|
|
|
09 |
Macro overview |
|
4 |
5 |
|||
Asset Classes |
|
Performance Review |
||
13 |
Bonds |
20 |
Market performance summary |
|
14 |
Equities |
21 |
Events calendar |
|
16 |
Foreign exchange |
24 |
Disclosure appendix |
|
19 |
Technical perspectives |
|
|
|
This reflects the views of the Wealth Management Group |
2 |

vk.com/id446425943Standard Chartered Bank
Global Market Outlook | 2 May 2019
3 Investment strategy
Can this rally extend?
•In our Global Investment Committee’s assessment, the rally in risky assets has room to extend further over the next 12 months, though near-term periods of consolidation are possible. Global PMIs and earnings revisions are ticking higher. Valuations, technicals and market diversity are not likely to constrain further gains.
•We favour equities over bonds, alternative strategies and cash. Within equities, we prefer Asia ex-Japan, and within bonds, we prefer Emerging Market (EM) USD government bonds and Asia USD bonds. The USD is likely to weaken.
•‘Sell-in-May’ seasonality is a near-term risk. We also continue to watch trade relations and oil price risks closely.
Q1 rebound has been strong, but markets are not stretched
Global equities gained a further 2.8% over the past month, regaining their prior record high. This means, YTD, global equities have now rebounded over 15% (with the Shanghai Composite up around 25%, at one extreme). Meanwhile, global corporate bonds have provided a total return of about 4.2% (with EM USD government bonds’ total returns of almost 7%) YTD.
After such strong gains over just a few months, unsurprisingly a key question for investors is whether this rally in risky assets can extend further, or whether it is now time to take some profit.
In our Global Investment Committee’s assessment, based on the seven factors below, the rally may have further to go. Forward-looking economic and market indicators are potentially the most positive factors. After consecutive months of decline, global PMIs (led by services) and earnings revisions – usually among the earliest indicators of market gains – have started to turn higher.
Valuations and short-term indicators are not unequivocally positive. However, we find it quite interesting that, despite the speed and size of YTD gains, they are not
Figure 1 |
Figure 2 |
Equities back close to previous peak |
Economics, earnings could extend rally |
MSCI AC World |
Factors influencing risk assets – our assessment |
|
540 |
Factor |
Signal |
|
|
520 |
Valuations |
|
|
Index |
500 |
Forward-looking market |
|
|
480 |
Forward-looking economic |
|
||
|
||||
|
460 |
Technicals |
|
|
|
|
|
||
|
440 |
Market diversity |
|
|
|
|
|
||
|
420 |
Event risks |
? |
|
|
|
|
||
|
Apr-18 Jun-18 Aug-18 Oct-18 Dec-18 Feb-19 Apr-19 |
Seasonality |
||
Source: Bloomberg, Standard Chartered |
Source: Standard Chartered |
|
||
IMPLICATIONS
FOR INVESTORS
Equities likely to outperform other traditional asset classes. Asia exJapan has the highest probability of outperforming global equities, in our assessment
EM USD government bonds and Asia USD bonds most likely to outperform within our bond universe
Macro environment supportive of core allocation to alternative strategies and a weaker USD
This reflects the views of the Wealth Management Group |
3 |

vk.com/id446425943Standard Chartered Bank
Global Market Outlook | 2 May 2019
at levels that are likely to constrain further gains. Valuations have rebounded higher, but are only at or moderately above long-term average levels in most major regions. Short-term technical and positioning indicators are not showing signs of being stretched, suggesting they are also unlikely to hold back risky assets. Finally, measures of market diversity also show that the risk of a market reversal is not unusually high.
Only two indicators in our checklist – seasonality and event risk – argue for caution. ‘Sell-in-May’ seasonality is a wellknown (and far from certain) phenomenon. Trade tensions, meanwhile, continue to be a key risk; while US-China tensions could ease, US trade tensions with Europe and/or Japan could rise as they enter trade talks.
Putting these factors together, in our assessment, the rally in risky assets is still likely to extend further over the coming 12 months. While short-term consolidation is possible, we believe the case for preferring equities over bonds, alternative strategies and cash remains in place.
Rising downside risks for the USD
Another factor that may influence the outcome for major financial markets is the direction of the USD.
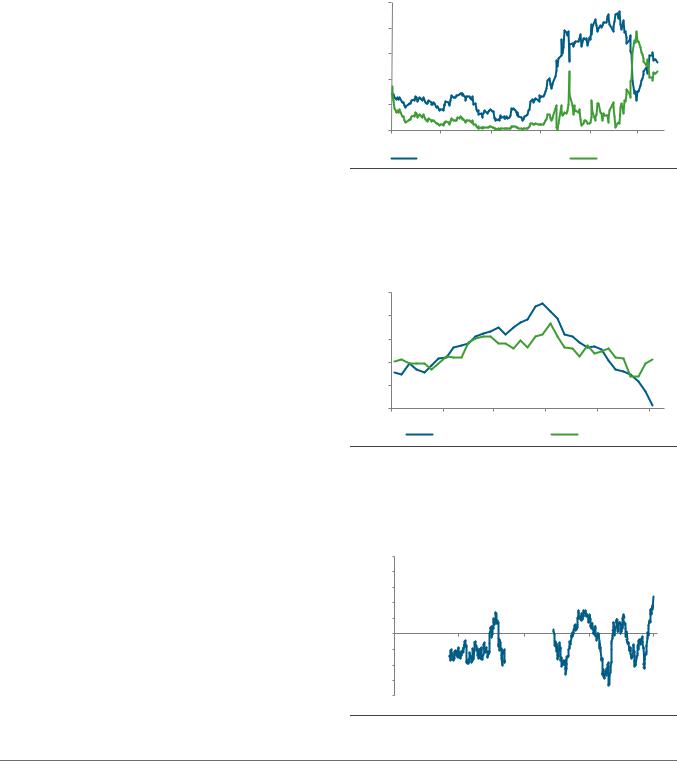
Figure 3
Real interest rate differentials turning against the USD
USD Index (DXY) vs. weighted real interest rate differentials
|
105 |
|
|
|
|
2.25 |
|
100 |
|
|
|
|
2.00 |
|
|
|
|
|
|
|
|
|
|
|
|
|
1.75 |
|
95 |
|
|
|
|
1.50 |
Index |
|
|
|
|
|
|
90 |
|
|
|
|
% |
|
|
|
|
|
1.25 |
||
|
|
|
|
|
|
|
|
85 |
|
|
|
|
1.00 |
|
|
|
|
|
|
|
|
|
|
|
|
|
0.75 |
|
80 |
|
|
|
|
0.50 |
|
|
|
|
|
|
|
|
75 |
|
|
|
|
0.25 |
|
Jan-14 |
Jan-15 |
Jan-16 |
Jan-17 |
Jan-18 |
Jan-19 |
|
|
DXY |
DXY-weighted real rate differentials (%) (RHS) |
|||
Source: Bloomberg, Standard Chartered
Real (net-of-inflation) interest rate differentials are increasingly turning against the USD as the Fed pauses, in our assessment. This could intensify if oil prices continue to rise (by raising inflation expectations and, hence, reducing real rates further).
Hence, we are bearish on the USD over a 12-month horizon. As we have discussed in prior months, a weak USD tends to
be supportive for EM assets as stronger EM currencies support EM asset class inflows and returns. This, in turn, should prove supportive for risky assets.
Maintain preference for Asia ex-Japan equities
Within equities, we maintain our regional preference for Asia ex-Japan. In our assessment, valuations, earnings and technicals all suggest there is room for gains to extend. Within the region, we continue to prefer China (onshore and offshore). While over 30% gains in the onshore Shanghai Composite may seem like a lot, history shows it is not uncommon for the market to deliver significantly more in a given year, especially if inflows to EMs are well-supported.
US equities are likely to remain focused on earnings expectations. While Q1 earnings likely contracted slightly, we believe the 12-month earnings revisions uptick is a positive.
We are less excited by Japanese equities, which rank lower in our preference order. While short-term rebounds may have been a function of excessively pessimistic positioning and receding risks at the start of the year, we do not believe the fundamental outlook has improved sufficiently for markets to outperform other regions.
EM bonds likely to be well-supported
Within bonds, we prefer EM USD government bonds and Asia USD bonds. The absolute level of yields (approximately 6.1% and 4.4% respectively) remains attractive, in our assessment. Meanwhile, further gains in risky assets and a weaker USD also argue the case for rising EM bond prices, especially as valuations are not a constraint.
Valuations are more of a constraint for Developed Market (DM) High Yield (HY) bonds, where our return expectations remain limited to the yield on offer. We have turned more cautious on DM Investment Grade (IG) bonds, both government and corporate. While we expect US Treasury yields to be largely range-bound, we see risks tilted towards rising yields (lower bond prices). The already-low yield on offer leaves very little buffer against a fall in bond prices. Hence, we see better risk/reward opportunities elsewhere.
Our expectations of further gains in equities and EM/Asian USD bonds, and a weaker US dollar, translate directly to continued support for Multi-Asset Income strategies, in our assessment.
This reflects the views of the Wealth Management Group |
4 |

vk.com/id446425943Standard Chartered Bank
Global Market Outlook | 2 May 2019
Figure 4
Our Tactical Asset Allocation views (12m) USD
Asset class |
|
Sub-asset class |
Relative outlook |
Rationale (+ Positive factors II – Negative factors) |
|
|
|
|
|
|
|
|
|
|
|
|
Asia ex-Japan |
▲ |
+ Modest earnings growth, fair valuations || - Trade tensions |
|
|
|||
|
|
Earnings growth healthy even as US-China trade tensions reduce |
||
|
|
|
||
|
|
Other EM |
|
+ Modest earnings growth, fair valuations || - Political uncertainty |
|
|
A weaker USD is likely to be a support |
||
|
|
|
||
|
|
|
|
|
|
|
US |
|
+ Modest earnings growth, fair valuations || - Economic growth concerns |
|
|
Economic and earnings revisions upticks are positives |
||
|
|
|
||
|
|
|
|
|
Equities |
|
Euro area |
|
+ Modest earnings growth, fair valuations || - Political uncertainty |
|
|
Benign outlook for rates; fair valuations; growth outlook a risk |
||
|
|
|
||
|
|
|
|
|
|
|
UK |
|
+ Modest earnings growth, attractive valuations || - Brexit uncertainty |
|
|
GBP strength a risk, but improving earnings growth outlook a positive |
||
|
|
|
||
|
|
Japan |
▼ |
+ Modest earnings growth, attractive valuations || - Weak economic data |
|
|
Valuations attractive, but economic data weak. |
||
|
|
|
||
|
|
|
|
|
|
|
GBP |
▲ |
+ Neutral rate differentials, weak USD view || - Hard Brexit |
|
|
|||
|
|
A ‘hard Brexit’ unlikely, but volatility likely |
||
|
|
|
||
|
|
|
|
|
|
|
EUR |
▲ |
+ Positive rate differentials, weak USD view || - US-EU trade tensions |
|
|
ECB has less room to ease relative to Fed |
||
|
|
|
||
|
|
|
|
|
|
|
CNY |
|
+ Reduced trade risks, weak USD view || - Worsening rate differentials |
|
|
US-China trade tensions on an improving trend |
||
|
|
|
||
|
|
AUD |
|
+ China stimulus, weak USD view || - Worsening rate differentials |
Currencies |
|
China stimulus a positive, but slowing domestic growth a risk |
||
|
|
|||
|
|
|
||
|
|
JPY |
|
+ Stable differentials, weak USD view || - Volatility |
|
|
Bouts of risk aversion could offer support |
||
|
|
|
||
|
|
|
|
|
|
|
USD |
▼ |
+ Reduced trade risks || - Weakening rate differentials |
|
|
Interest rate advantage to narrow as Fed pauses |
||
|
|
|||
Source: Standard Chartered Global Investment Committee |
|
|||
Legend: ▲Preferred |
Core holding▼Less preferred |
|
||
4 Perspectives
This reflects the views of the Wealth Management Group |
5 |

vk.com/id446425943Standard Chartered Bank
Global Market Outlook | 2 May 2019
on key client questions
 Chinese equity markets have rebounded strongly in Q1. How much further can they go?
The extent of the year-to-date (YTD) rally in Chinese equity markets has caught some investors by surprise. The Shanghai Composite Index has gained 25.3% YTD and the offshore MSCI China Equity index – despite lagging the onshore market – is also up 20.1% so far this year. Our assessment shows that there is still likely to be further upside from these levels. However, history tells us the path for onshore and offshore equities may differ based on time horizon.
History gives us two pictures (near vs. long-term view)
Chinese equity markets are no strangers to large swings. Long-term measures of volatility indicate annual levels near 33% and 54% for offshore and onshore markets respectively (based on quarterly data). Although, the recent rally may give the impression that the chances for further gains have been exhausted, history can provide some guidance to where the odds stand.
We split our analysis into shortvs. long-term view, and onshore vs. offshore equities (represented by the Shanghai Composite and MSCI China Index respectively due to availability of data). In the short-term, we see that whenever markets have rallied more than 15% in a quarter, the performance of the following quarter varies between -0.6% for offshore and 6.8% for onshore markets. The difference is potentially due to the contrast in hit ratios – i.e. the likelihood that the following quarter will post positive performance
– which is much lower for offshore equities.
Once we extend our analysis beyond the following quarter, to the full-year returns, we see a significant improvement in both the hit ratios and performance. Odds to end the year in the positive on the back of such strong quarterly performances rise significantly for offshore and onshore markets, and average gains rise to ~32% and ~54% respectively. What this means for investors is that, based solely on historical patterns, offshore equities may waver in the short-term, but Chinese equities in general should have good odds for continued positive performance for the remainder of the year.
Figure 5
Historical precedents show divergent paths for shortvs long-term horizons
Summary chart on past quarterly performance of MSCI China Index and Shanghai Composite index
|
MSCI China |
Shanghai Composite |
|
|
|
Quarters above +15% |
14 |
18 |
|
|
|
Following month average return |
-0.6% |
6.8% |
|
|
|
Following months with positive returns |
6 |
16 |
|
|
|
Positive/Negative ratio |
42.9% |
61.1% |
|
|
|
Full-year returns* |
31.6% |
53.9% |
|
|
|
Number of full-year positive returns* |
8 |
18 |
|
|
|
Full-year positive/negative ratio |
61.5% |
78.3% |
|
|
|
Source: Refinitiv, Standard Chartered
* Refers to years when the initial quarter posted 15% gains or more. Data since September 1994.
This reflects the views of the Wealth Management Group |
6 |
vk.com/id446425943Standard Chartered Bank
Global Market Outlook | 2 May 2019
How does the current context affect the historical view?
Tying current market conditions to historical analogues will never be perfect as history does not repeat in the exact same way. Therefore, we look at the current macroeconomic backdrop for clues.
The Fed’s pivot in Q1 to a more dovish stance has eased
USD liquidity conditions for Emerging Markets in general, and China’s policy stimulus is showing signs of boosting economic activity even earlier than we anticipated.
In the past month, monetary conditions indicators have showed an uptick, as did industrial production and Chinese new export orders. Although these are positive signals, we are now awaiting further confirmation from other countries’ data. Particularly, we will focus on trade and manufacturing data, along with a potential trade deal announcement by US and Chinese representatives in the coming weeks.
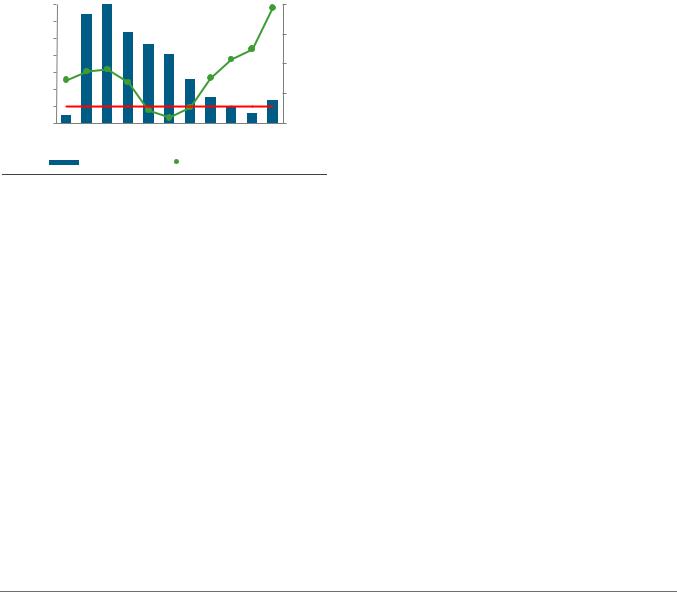
With regards to sentiment, we do take note that several indicators show that investors are more cautious this time around and have not overstretched their positioning. For example, margin trading by retail investors, although raising, is near 50% levels compared to the 2015 peak.
Measures of credit impulse improved meaningfully after the strong Total Social Financing (TSF) print in March. Although there are still concerns about China’s ability to stabilise GDP growth with sustainable levels of debt, credit impulse correlates well with earnings growth and points to a pick-up in H2.
Moreover, earnings growth revisions are being supported by positive preliminary earnings announcements, raising the probability that revisions will continue to improve going forward.
Figure 6
Leveraged stock market purchases are far from their peak
Chinese margin debt leveraged positions in USD 100m
|
4,000 |
|
|
|
|
|
USD) |
3,500 |
|
|
|
|
|
|
|
|
|
|
|
|
in 100m |
3,000 |
|
|
|
|
|
2,500 |
|
|
|
|
|
|
( |
|
|
|
|
|
|
position |
2,000 |
|
|
|
|
|
1,500 |
|
|
|
|
|
|
|
|
|
|
|
|
|
Leverage |
1,000 |
|
|
|
|
|
500 |
|
|
|
|
|
|
|
|
|
|
|
|
|
|
0 |
|
|
|
|
|
|
Dec-13 |
Dec-14 |
Dec-15 |
Dec-16 |
Dec-17 |
Dec-18 |
Source: Bloomberg, Standard Chartered
In conclusion, taking into consideration history and the current macroeconomic context, we believe the case for further gains for both Chinese onshore and offshore markets into the year-end stands, albeit they may not follow the same path.
Figure 7
Chinese corporate earnings’ revision momentum was the first to turn, and is now aiming to cross into positive territory
3m moving averages of select Earnings Revision Indices (ERI)
1.5
Index |
1.0 |
|
Revision |
0.5 |
|
|
||
Earnings |
0.0 |
|
-0.5 |
||
|
||
|
-1.0 |
Dec-15 |
Oct-16 |
Aug-17 |
Jun-18 |
Apr-19 |
||
|
US |
|
Japan |
|
EU |
China |
|
|
|
||||
Source: FactSet, Standard Chartered
This reflects the views of the Wealth Management Group |
7 |
vk.com/id446425943Standard Chartered Bank
Global Market Outlook | 2 May 2019
 Likewise, US equities also started the year strong: Can the rally continue?
Yes, our Global Investment Committee believes so. That said, our analysis indicates the pace of gains could be more in line with broader global equities performance. Meanwhile, the risks of a short-term pullback cannot be ruled out, especially given the strong performance YTD.
When looking at performance, there have been eight instances since 1968 (excluding the latest) where the S&P 500 index has gained more than 10% in the first quarter of the year. Analysing the ensuing three-quarter performance, we see that only in one instance – 1987, when world markets collapsed on Black Monday – did market momentum fail to extend through the rest of the year and the average return over the period was in the mid-single digits.
Figure 8
A low volatility environment is positive for stock returns
S&P 500 12-month total returns from different volatility levels
|
30% |
|
|
|
|
|
|
|
|
|
20% |
|
Next 12-month return |
25% |
|
|
|
|
|
|
|
|
|
|
Percent of observations |
20% |
|
|
|
|
|
|
|
|
|
15% |
||
|
|
|
|
|
|
|
|
|
|
|||
15% |
|
|
|
|
|
|
|
|
|
10% |
||
10% |
|
|
|
|
|
|
|
|
|
|||
|
|
|
|
|
|
|
|
|
|
|||
5% |
|
|
|
|
|
|
|
|
|
5% |
||
|
|
|
|
|
|
|
|
|
|
|||
0% |
|
|
|
|
|
|
|
|
|
|
||
|
|
|
|
|
|
|
|
|
|
|
||
|
-5% |
|
|
|
|
|
|
|
|
|
0% |
|
|
<10 |
10-13 |
13-16 |
16-19 |
19-22 |
22-25 |
25-28 |
28-31 |
31-34 |
34-37 |
>37 |
|
VIX (RHS) |
|
S&P500 net total return |
|
Source: Bloomberg, Standard Chartered
Analysis performed using daily data fro 1-Jan-99 to 19-Apr-18
Figure 9
Two alternative ways way to look at this question are from a market diversity and volatility point of view. Market diversity measures try to quantify the stability of a market based on whether investors’ views over-converge or remain diverse; currently our in-house indicators point to fair market diversity meaning that the current uptrend does not appear overly stretched.
With regards to volatility, following the Fed U-turn in monetary policy and with markets forecasting a higher probability of rate cuts for year-end, volatility waned providing a boost to the stock market rebound.
Figure below shows that positive 12-month stock returns tend to coincide with low or (very) high volatility regimes, while they tend to suffer at or near long-term average (ca. 22). The chart indicates that a lower volatility environment can be symptomatic of a regime where momentum lifts stocks higher, while a peak volatility regime usually occurs only at market bottoms – i.e. an emotionally challenging but rewarding entry point to invest in stocks.
Additionally, as the US Q1 reporting season gets past the halfway mark on the back of its busiest weeks, blended estimates point to a 0.0% y/y growth in earnings
(improving from earlier estimates of a 2.5% contraction). This reduces the chances of an earnings recession as the
S&P500 index tests September’s record high.
We prefer to look through the Q1 slump and focus on the positive effects of easing financial conditions, still-strong job market (evidenced by the strong March jobs report) and growing prospects of a US-China trade deal.
Based on the above analysis of historical data and considering what we’re learning from earnings results, we retain our view that US equities are likely to perform broadly in line with global equities, which remains our preferred asset class.
In the past, first quarter performance greater than 10% has preceded further gains in the S&P 500 index, 7 out of 8 times
Historical quarterly returns for the S&P 500 index in select periods when the index Q1 performance has been greater or equal than 10%
Year |
Q1 |
Q2 |
Q3 |
Q4 |
Q2-Q4 |
2019 |
13.1% |
|
|
|
? |
|
|
|
|
|
|
2013 |
10.0% |
2.4% |
4.7% |
9.9% |
17.8% |
2012 |
12.0% |
-3.3% |
5.8% |
-1.0% |
1.3% |
|
|
|
|
|
|
1998 |
13.5% |
2.9% |
-10.3% |
20.9% |
11.6% |
1991 |
13.6% |
-1.1% |
4.5% |
7.5% |
11.2% |
|
|
|
|
|
|
1987 |
20.5% |
4.2% |
5.9% |
-23.2% |
-15.3% |
1986 |
13.1% |
5.0% |
-7.8% |
4.7% |
1.4% |
|
|
|
|
|
|
1976 |
13.9% |
1.5% |
0.9% |
2.1% |
4.6% |
1975 |
21.6% |
14.2% |
-11.9% |
7.5% |
8.2% |
|
|
|
|
|
|
Average |
|
2.6% |
2.7% |
6.1% |
6.4% |
Median |
|
3.2% |
-1.0% |
3.6% |
5.1% |
|
|
|
|
|
|
% Positive |
|
75.0% |
62.5% |
75.0% |
87.5% |
|
|
|
|
|
|
Source: Bloomberg, Standard Chartered
Data starting January 1968
This reflects the views of the Wealth Management Group |
8 |

vk.com/id446425943Standard Chartered Bank
Global Market Outlook | 2 May 2019
7 Macro overview
Signs of a recovery in China
•Core scenario: China’s economy appears to be responding to stimulus. Our Global Investment Committee believes China’s improving outlook, when combined with easier global financial conditions following the
Fed’s dovish turn in policy, is likely to extend the business cycle.
•Policy outlook: Global central bank policy is likely to remain accommodative for the next 12 months following the Fed’s decisively dovish turn amid moderating growth and still-subdued inflation.
•Key risks: While we are more optimistic about a US-China trade agreement, a flare-up of trade tensions with Europe/Japan is a key source of risk. Dovish central banks have reduced a major policy risk.
Core scenario
Our Global Investment Committee has turned more positive about Emerging Market (EM) growth outlook on the back of signs of a recovery in China, easing global financial conditions and expectations for a thaw in US-China trade relations. While we continue to expect growth across Developed Markets (DM) to moderate towards its long-term trend, we see a reasonably low likelihood (30% probability) of a US recession in the next 12 months. The Fed’s dovish shift in policy bias has led the ECB and other central banks (including EMs) to stay or turn more accommodative as inflation remains subdued. The key risk is a revival of trade tensions as the US starts trade talks with Japan and EU.
Figure 10
Asia ex-Japan is likely to benefit the most from China’s nascent recovery
|
|
|
Benchmark |
Fiscal |
|
|
Region |
Growth |
Inflation |
rates |
policy |
Comments |
|
|
● |
● |
Growth and inflation are likely to stabilise |
|||
US |
around long-term trend, allowing the Fed to |
|||||
|
hold rates through 2019 |
|||||
|
|
|
|
|
||
|
|
|
|
|
|
|
Euro |
○ |
● |
● |
|
External headwinds continue to cloud outlook; |
|
China’s recovery could alleviate stress; ECB |
||||||
area |
||||||
policy to stay highly accommodative |
||||||
|
|
|
|
|
||
|
|
|
|
‘Hard Brexit’ risks recede with Brexit delay; |
||
UK |
BoE to hold rates as uncertainty prolonged |
|||||
Japan |
○ |
● |
● |
|
Outlook clouded by global trade. US trade |
|
talks, sales tax hike in focus. BoJ to stay easy |
||||||
|
||||||
Asia |
● |
|
|
China data suggests economy responding to |
||
ex- |
● stimulus. Rest of Asia to also benefit from |
|||||
Japan |
|
|
|
|
increasingly dovish global central banks |
|
|
|
|
|
|
|
|
EM ex- |
|
|
|
|
China’s recovery, dovish central banks |
|
Asia |
positive for EMs; differentiation remains key |
|||||
|
|
|
|
|
|
|
Source: Standard Chartered
Legend: ●Supportive of risk assets Neutral○Not supportive of risk assets
IMPLICATIONS
FOR INVESTORS
The Fed to hold rates for rest of 2019
The ECB and BoJ to maintain their highly accommodative monetary policies
China to continue with targeted easing of fiscal and monetary policies to support domesticdriven growth
This reflects the views of the Wealth Management Group |
9 |
vk.com/id446425943Standard Chartered Bank
Global Market Outlook | 2 May 2019
US – Return to ‘Goldilocks’
Not too hot, not too cold. We expect US economic growth to continue moderating towards the long-term trend close to 2% as the stimulus from late-2017’s tax cuts fades. However, the rebound in job creation in March reaffirms our view that consumption is likely to remain the bedrock for the economy over the coming year. The Fed’s recent dovish turn, after 2% of rate hikes since 2017, has eased financial conditions and helped lower mortgage rates, which should be supportive for the housing sector. Manufacturing sector business confidence also appears to have stabilised, with expectations of a trade agreement with China. Inflation has trended lower this year towards the Fed’s 2% target amid subdued wage growth and a still-strong USD.
Fed on hold. We believe moderating growth and inflation are likely to allow the Fed to maintain its still-accommodative policy through 2019, especially as it mulls a policy shift towards letting inflation overshoot its 2% target for a while.
Euro area – External headwinds cloud outlook
Diverging growth drivers. Consensus Euro area growth continued to be revised lower, primarily due to external headwinds. However, the recovery in China, a key trading partner, and likely pick-up in credit demand (based on an ECB survey) could help stabilise the economy in H2. The domestic economy remains resilient, as highlighted by stillfavourable private consumption and robust services sector activity. Uncertainty around upcoming EU parliamentary elections and possible US tariffs on EU products, as the two sides prepare to start trade talks, remain key headwinds.
ECB remains supportive. The ECB is likely to tweak its already-accommodative policy to address the pressure on banks’ profits from prolonged negative deposit rates.
However, we expect policy to remain highly accommodative through 2019 as inflation stays well below ECB’s 2% target.
UK – Brexit uncertainty prolonged
Decision shelved. The EU’s move to push back the Brexit deadline to 31 October prolongs the uncertainty. However, we see high likelihood of a negotiated solution in the next 12 months, possibly after an election. UK data has surprised positively recently as the threat of hard-Brexit recedes.
BoE torn. The BoE is likely to stay on hold over the next 12 months as it balances rising wage pressures with negative impact of Brexit uncertainty on business investment.
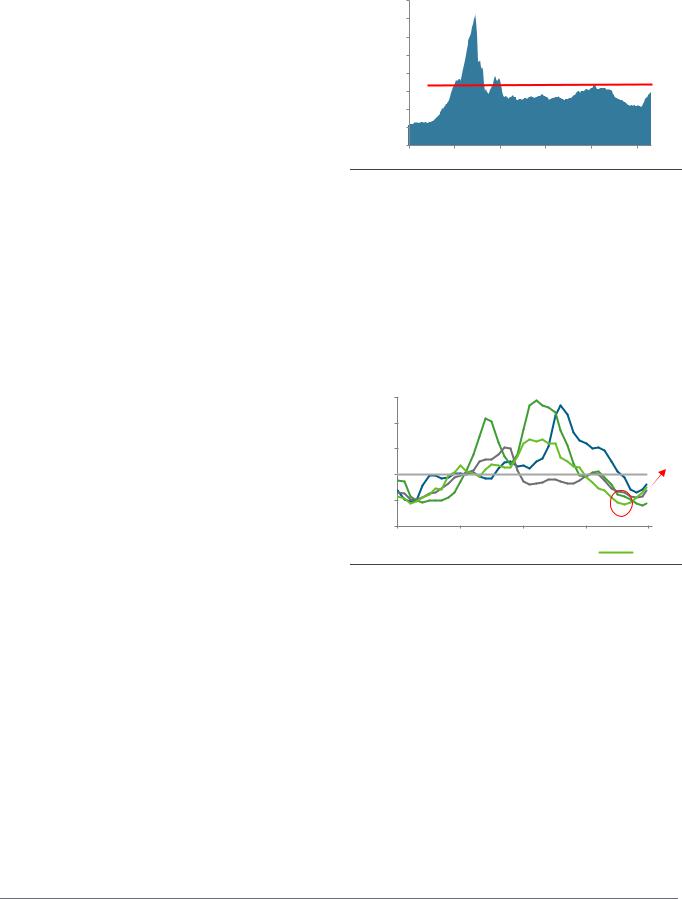
Figure 11
Market expectations of a Fed rate cut by end-2019 are now evenly balanced with expectations of no change in rates
Money market probabilities of a Fed rate hike and no-change by Dec 2019
100 80
60 % 40
20
0 |
|
|
|
|
|
May-18 |
Jul-18 |
Sep-18 |
Nov-18 |
Jan-19 |
Mar-19 |
|
Probability of no change (2.25 – 2.50) |
Probability of cut |
|||
Source: Bloomberg, Standard Chartered
Figure 12
Euro area’s domestic-driven services sector confidence is showing signs of recovery; manufacturing sector confidence remains under pressure, but could revive with China’s recovery
Euro area manufacturing and services sector PMIs
|
62 |
|
|
|
|
|
|
59 |
|
|
|
|
|
Index |
56 |
|
|
|
|
|
53 |
|
|
|
|
|
|
|
|
|
|
|
|
|
|
50 |
|
|
|
|
|
|
47 |
|
|
|
|
|
|
Apr-16 |
Nov-16 |
Jun-17 |
Jan-18 |
Aug-18 |
Mar-19 |
|
|
Manufacturing PMI |
|
Services PMI |
|
|
Source: Bloomberg, Standard Chartered
Figure 13
UK economic data has exceeded expectations lately as risk of a hard Brexit recedes
UK economic surprises index
|
100 |
|
|
|
|
|
80 |
|
|
|
|
|
60 |
|
|
|
|
|
40 |
|
|
|
|
Index |
20 |
|
|
|
|
0 |
|
|
|
|
|
|
-20 |
|
|
|
|
|
-40 |
|
|
|
|
|
-60 |
|
|
|
|
|
-80 |
|
|
|
|
|
Apr-14 |
Jul-15 |
Oct-16 |
Jan-18 |
Apr-19 |
Source: Citigroup, Bloomberg, Standard Chartered
This reflects the views of the Wealth Management Group |
10 |