

UBS-monthly review_watermark
.pdfvk.com/id446425943
UBS House View
Monthly Base July 2019
Chief Investment Office GWM
All forecasts in this publication are as of 20 June 2019 at 09:00am CET and might change after that. This publication will only be updated intra-monthly to reflect changes in our TAA positions or thematic views. To get our most recent forecasts, please refer to our publication called "Global forecasts".
Published
Jun 20 2019
This report was prepared by UBS AG. |
|
Please see the important disclaimer at the end of the document. |
|
This document is a snapshot view. We update the tactical asset allocation |
|
as changes occur and resend it to subscribers. For all other forecasts and |
|
information, we advise you to check the Investment Views section in your E- |
1 |
Banking or in Quotes. |

vk.com/id446425943
Financial Market Outlook – short term
GBP undervalued against AUD
GBPAUD spot, Purchasing Power Parity (PPP)
3.50
3.00
2.50
2.00
1.50
1.00
1982 1987 1992 1997 2002 2007 2012 2017  GBPAUD
  PPP GBPAUD
Source: Macrobond, UBS, as of 17 June 2019
US vs. EMU: relative macro is a key driver
The euro area's relative resilience is unlikely to last if trade tensions escalate further and global growth slows
20%
|
10 |
10% |
5 |
|
|
0% |
0 |
|
|
-10% |
-5 |
-20% |
-10 |
2010 2011 2012 2013 2014 2015 2016 2017 2018 2019
 Euro area vs US equities return, 6m chg, lhs
 Euro area PMI vs US ISM, mfg, 6m chg, 3-month lead, rhs
Source: Bloomberg, UBS, as of 17 June 2019
Global Tactical Asset Allocation
•Asset allocation
In our base case, global growth should stabilize in the second half of the year. Equity valuations look fair rather than expensive and with an attractive equity risk premium, stocks remain attractively valued relative to bonds. However, the rhetoric around US-China trade has deteriorated since early May and the near-term prospects for a trade deal look increasingly uncertain. In a scenario of prolonged uncertainty with lower consumer confidence and slowing investments, we see risk of the global economy growing below trend. However, we don't foresee an end to the business cycle. In our base case, we expect a ceasefire between the US and China on trade following the G20 meeting later this month. Negotiations should continue, leading eventually to an agreement on trade, but is likely to take more time than previously anticipated. We keep our overweight in global equities, while partially protecting the downside risk with a put option.
•Equities
While we still expect global economic growth to stabilize in the second half of the year, and the oil price to make gains over the next six months, risks around China-US trade negotiations remain elevated. Assuming the risk scenarios we are monitoring do not materialize, we believe equities can advance moderately. We have an overweight in Japanese and US equities vs Eurozone equities. While both the Eurozone and Japan are heavily geared to the global cycle, the former has priced in a macro recovery while the latter has not. Eurozone stocks look expensive compared to the Japanese market. In addition we prefer US versus Eurozone stocks as the former should deliver superior profits growth in 2019 and 2020. We are closing our overweight in Canadian equities against Swiss ones, as Canadian economic growth is softening, while dovish central banks and the decline in European rates has increased the appeal of defensive Swiss stocks as bond proxies.
•Bonds
We overweight EUR IG against higher-rated bonds, as we expect the former to be supported by stabilizing Eurozone growth and accommodative ECB policy. We consider the carry attractive against healthy corporate fundamentals and our base case of no recession over the coming 12 months. We hold a tactical short on the 2-year US Treasury note. While the Fed seems increasingly likely to cut rates as economic data globally disappoints, we think that market pricing of around four rate cuts is too pessimistic. We close our underweight in 10-year Japanese government bonds versus JPY cash. A catalyst for an adjustment higher in the yield curve control target for the 10-year yield is lacking over the near-term, given modest inflation pressures.
•Foreign exchange
We add a long position in GBP versus AUD. Sterling has become very cheap against purchasing power parity, and no-deal Brexit risks for the next three to six months have been overpriced. In contrast, Australia's RBA has started to cut interest rates in light of an economy struggling to keep up momentum. We maintain our short AUD vs long USD, in addition to our overweights in the Norwegian krone against the Canadian dollar and the Swiss franc, and our overweight in the euro vs the Swiss franc. We also hold a basket of select EM currencies (South African rand, Indian rupee, Indonesian rupiah) vs pro-cyclical developed market currencies (Australian dollar, New Zealand dollar, Taiwanese dollar) to harvest the interest rate advantage without being too strongly exposed to US-China trade tensions.
•Longer-term asset allocation (1-4 years)
We are underweight UK equities. While the UK was formerly seen as a conservative, lower risk market, prolonged Brexit uncertainties could change this market characteristic and lead to a rising risk premium. Emerging market US dollar-denominated sovereign bonds have a more favorable longer-term risk-return outlook, in our view. We also recommend investors in Japanese equities not to hedge the currency exposure as the JPY is significantly undervalued and offers long-term appreciation potential against the USD, the EUR and the CHF.
For further information please contact Head CIO Global Asset Allocation Andreas J Koester, andreas.koester@ubs.com or CIO asset class specialists Philipp Schöttler, |
2 |
philipp.schoettler@ubs.com or Carolina Corvalan, carolina.corvalan@ubs.com. |
|
vk.com/id446425943
Cross-asset preferences
Equities
Bonds
Foreign exchange
Hedge Funds
Precious Metals
& Commodities
We like...
•Global equities
•Japanese equities
•US equities
•Global quality stocks
•"Buy-write" strategy on US equities
•US smart beta
•Some protection via US equity put options
•Emerging market sovereign bonds USD (1–4 year horizon)
•Euro investment grade corporate bonds
•Global green bonds
•Mind the gap – Corporate "rising star" candidates
•Norwegian krone
•Euro
•Norwegian krone
•US dollar
•British pound (  )
)
•EM FX (ZAR, INR, IDR)
•Japanese yen (1–4 year horizon)
 Recent upgrades
  Recent downgrades
We don't like...
•UK equities (1–4 year horizon)
•Eurozone equities
•Developed market high grade bonds
•2-year US Treasuries vs. USD cash
•"Well-worn" bonds
•Mind the gap - Corporate "fallen angel" candidates
•...Swiss franc
•...Swiss franc
•...Canadian dollar
•...Australian dollar
•...Australian dollar (  )
)
•DM FX (AUD, NZD, TWD)
•...base currency
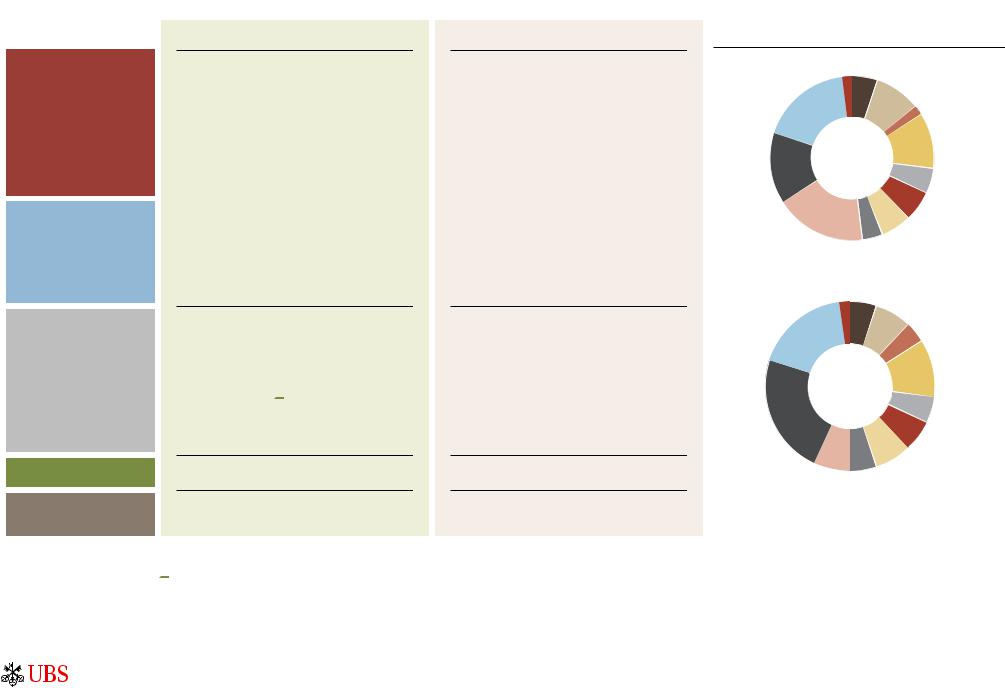
Model portfolios (EUR & USD)*
|
Risk Parity |
Liquidity |
|
|
|
2% |
|
5% |
High grade |
|
|
|
|
|
Hedge Funds |
|
|
|
bonds |
|
|
|
9% |
|
18% |
|
|
|
|
|
|
|
US TIPS 2% |
|
|
|
|
|
|
|
|
|
|
Inv. grade |
Equities US |
EUR |
|
corporate |
|
|
bonds 11% |
|||
|
|
|
|
|
14% |
|
|
|
High yield |
|
|
|
|
bonds |
|
|
|
|
5% |
|
|
|
|
EM bonds 6% |
Equities Europe |
|
|
Equities others |
|
|
|
6% |
||
18% |
|
Equities EM |
||
|
|
|
4% |
|
|
Risk Parity |
Liquidity |
|
|
Hedge Funds |
2% |
|
5% High grade |
|
|
|
|
bonds |
|
18% |
|
|
|
7% US TIPS |
|
|
|
|
4% |
|
|
|
|
Inv. grade |
|
|
|
|
corporate |
|
USD |
bonds |
||
|
11% |
|||
|
|
|
|
|
|
|
|
|
High yield |
Equities US |
|
|
|
bonds |
|
|
|
5% |
|
23% |
|
|
|
|
|
|
|
EM bonds |
|
|
|
|
|
|
|
|
|
|
6% |
|
|
|
|
Equities others |
|
|
|
|
7% |
|
Equities Europe Equities EM |
|||
|
7% |
|
5% |
|
Source: UBS, as of 20 June 2019; * Additionally, the portfolios include an underweight 2-year US Treasuries bonds (via overlay) and a put option on the S&P 500 index.
Note: Portfolio weightings are for a EUR model portfolio and a USD model portfolio, with a balanced risk profile (including TAA). We expect the EUR balanced portfolio (excluding TAA) to have an average total return of 2.8% p.a. and a volatility of 7.9% p.a. over the next seven years. We expect the USD balanced portfolio (excluding TAA) to have an average total return of 5.1% p.a. and a volatility of 7.9% p.a. over the next seven years.
3
vk.com/id446425943
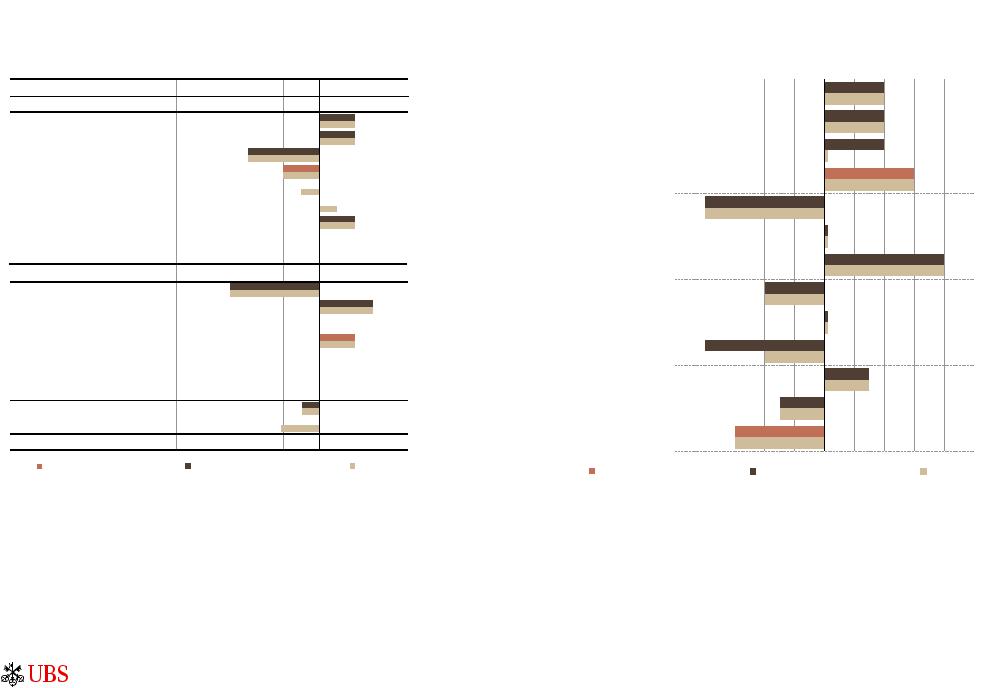
Global tactical asset allocation
Tactical asset allocation deviations from benchmark
underweight |
neutral |
overweight |
Liquidity
Equities total*
Global
US
Eurozone
UK
Switzerland
Canada
Japan**
Emerging markets (EM)
Australia
Bonds total
High grade bonds
Corporate bonds (IG)
High yield bonds
EM sovereign bonds (USD)
EM corporate bonds (USD)
EM local currency bonds
US TIPS
Duration overlay (USD)
Duration overlay (JPY)
Hedge Funds
new (1-4 years horizon) |
new (up to 12m horizon) |
old |
Source: UBS, as of 20 June 2019
Please note that the bar charts show total portfolio preferences, which can be interpreted as the recommended deviation from the relevant portfolio benchmark for any given asset class and sub-asset class. *We are holding a put option on the S&P 500 to partly protect the tactical asset allocation.
**Currency exposure of Japanese equities is not hedged.
Currency allocation
underweight |
neutral |
overweight |
|
USD |
|
|
|
EUR |
|
|
|
GBP |
|
|
|
JPY |
|
|
|
CHF |
|
|
|
SEK |
|
|
|
NOK |
|
|
|
CAD |
|
|
|
NZD |
|
|
|
AUD |
|
|
|
EM FX basket*** |
|
|
|
DM FX basket*** |
|
|
|
Base currency |
|
|
|
new (1-4 years horizon) |
new (up to 12m horizon) |
old |
|
Source: UBS, as of 20 June 2019
*** EM FX basket contains South African rand, Indian rupee, Indonesian rupiah. DM FX basket contains Australian dollar, New Zealand dollar, Taiwanese dollar (all equally weighted).
4

vk.com/id446425943
CIO themes in focus
Equities
•US smart beta
Certain stock characteristics (momentum, quality, small capitalization, risk-weighting, value, and yield) have been shown to deliver long-term investment outperformance relative to a market- capitalization-weighted index. Combining these characteristics, known in the industry as smart beta, makes the investment less cyclical and creates a "passive-plus" solution. Smart beta's compelling value proposition has resulted in considerable growth in assets. Smart beta ETF assets have risen to over USD 700bn and are growing by more than 30% a year.
•Generate yield: "Buy-write" on US equities
An equity buy-write strategy involves the purchase of equities (the "buy" part) while systematically selling (or "writing") call options that cover the position, typically on a monthly schedule. In exchange for giving a counterparty the right, but not the obligation, to buy the underlying asset at a predetermined price, the buy-writer receives a premium. Over an economic cycle, equity buy-write strategies generate attractive risk-adjusted returns as they capture both the equity and volatility risk premium. They are most appealing when equity returns moderate and market momentum decreases and, historically, perform strongly during periods of rising rates.
•Global quality matters
The quality factor aims to reflect the performance of companies with durable business models and sustainable competitive advantages. It therefore targets companies with a high return on equity, stable earnings, and low financial leverage. In the late stage of the business cycle, when economic growth slows down and volatility rises, quality matters. As trade uncertainties remain, a global sector-neutral quality strategy can also offer added downside protection in a relative context.
Bonds
•Green bonds: Sustainability meets late-cycle stability
We view green bonds as a sound, sustainable alternative to global investment grade (IG) bonds. While an individual green bond usually performs in line with an otherwise identical non-green one, the green bond market has a more conservative sector and risk profile and benefits from demand for sustainable investments outgrowing supply. This should lead to outperformance during times when credit risk premiums rise, making green bonds an appealing late-cycle investment, following the recent recovery in credit risk premiums globally. To benefit from green bonds’ less cyclical profile, investors should diversify broadly and in particular avoid issuer concentration risk.
•Replacing well-worn bonds
Risk-free yields in some major developed markets are near or below zero. Even if rates stay unchanged, many shortto medium-term bonds would deliver negative total returns. We think investors can preserve wealth by taking profits on assets that will deliver negative returns (exceeding switching-out costs) in most likely scenarios. More attractive alternatives can be found on CIO's bond recommendation lists.
•Mind the gap: Investing in the crossover zone
Investors able and willing to stomach the potential volatility of "crossover credit" investments can earn potentially significant alpha if key rating agency action is anticipated correctly. While we emphasize that investments into BBB or lower quality bonds are not suitable for risk-averse investors, we provide credit views on the issuers trading in the crossover area. We also offer long and short bond baskets to help investors navigate the crossover zone.
This selection of themes is a subset of a larger theme universe. It represents the highest conviction themes of the UBS Chief Investment Office GWM, taking into account the current market environment and risk-return characteristics.
UBS Chief Investment Office GWM considers the highlighted themes as fitting the sustainability framework. |
5 |
|

vk.com/id446425943
CIO longer-term investment themes in focus
Equities
•Medical devices
The world's aging population and the growth of the over-65 age group will create more opportunities for companies selling medical products and devices. Other drivers of the medical device industry include better penetration in emerging markets due to improved infrastructure, new innovative treatments, increased affordability due to rising per-capita GDP, and a growing prevalence of "lifestyle diseases" like obesity due to urbanization. We expect sustainable mid-single-digit revenue growth.
•Enabling technologies
We have identified five mainstream enabling technologies – artificial intelligence (AI), augmented reality/virtual reality (AR/VR), big data, cloud computing and 5G – that are set to transform many industries over the next decade. We expect them to grow in aggregate by an average 12.8% annually, from USD 420bn in 2017 to USD 1.1trn in 2025. Hence, we believe enabling technologies offer solid long-term growth as technological disruption is an irreversible trend. Investors can take part in this by investing in a diversified way in our theme of enabling technologies, with leading software and semiconductor companies emerging as winners.
•Obesity
Urbanization and rising per capita GDP in emerging markets will contribute to a greater prevalence of obesity globally in the coming decades. Western economies are most associated with the obesity epidemic, but it is no longer just a rich-world problem. On current trends, the combined global prevalence of obesity and overweight could exceed 40% by 2030.
•Fintech
Driven by rapid urbanization, strong demand from millennials, and favorable regulations, the global fintech industry is at an inflection point and set to drive a major digital transformation in the financial services industry. We expect global fintech revenues to grow from USD 120 billion in 2017 to USD 265 billion in 2025, implying an average annual growth rate that's about three times faster than the broader financial sector's.
•Emerging market infrastructure
Growing urbanization and the expansion of megacities in emerging markets, as well as high economic growth rates, are driving demand for infrastructure investment. Spending on EM infrastructure is expected to grow to USD 5.5 trillion from the current USD 3 trillion, bringing its share of global spending to two-thirds by 2025 from the current half. Inadequate urban and nationwide infrastructure acts as a bottleneck to economic growth, making infrastructure investment a national priority.
This selection of themes is a subset of a larger theme universe. It represents the highest conviction themes of the UBS Chief Investment Office GWM, taking into account the current market environment and risk-return characteristics. The Longer Term Investment (LTI) theme series focuses on inevitable global trends, such as population growth, aging, and urbanization, that create a variety of opportunities, with certain companies and subsectors experiencing a higher-than-GDP rate of revenue growth. Here, we include a subset of a larger universe of LTI themes expected to offer good entry points for theme-oriented investors in the coming months, and highlight our preference for a diversified approach to themes.
UBS Chief Investment Office GWM considers the highlighted themes as fitting the sustainability framework. |
6 |
|
vk.com/id446425943
Key investment risks
Selected Scenarios |
Scenario Description |
Global economic growth slows but the Positive outlook expansion remains intact. Corporate earnings
Base case with increased growth slows. However, ongoing trade tensions volatility and uncertainty about Eurozone growth keep
volatility high.
Tariff escalation
Key downside scenarios
US credit crunch triggering a bear market
De-escalation
after G20
Key upside scenarios
Further sanctions are implemented, with the US administration imposing tariffs on the remaining Chinese imports after the conclusion of the hearing process.
US corporate leverage has increased to record high levels by certain standards. A combination of risk factors could lead to rising default risk and a sharp rise in spreads.
Both countries strike a new deal that partially repeals current duties with a further phase out conditional on Beijing fulfilling the trade deal's terms.
China: GDP Chinese GDP growth remains in a 6.6- 6.8% growth range as the current account balance goes back
accelerates above USD 100bn.
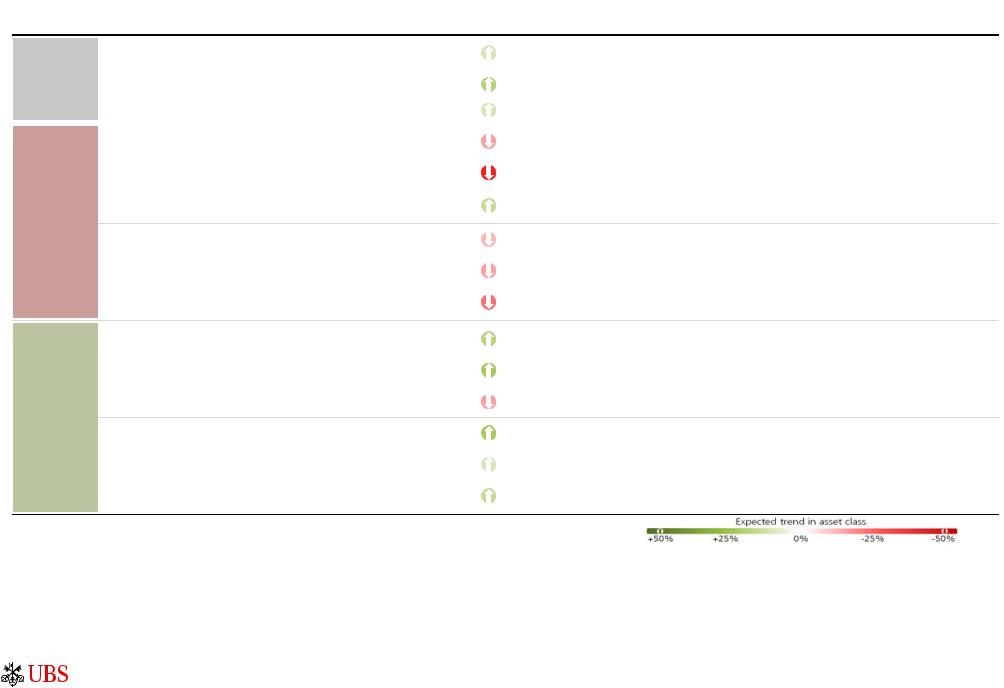
Expected market performance for select asset classes
US equities 0% to +5% based on our 16.5x forward eps estimates
Chinese equities -5% to 10% amid higher volatility due to tariffs and sanctions against tech companies weighing on earnings, alongside coordinated policy support
EURUSD between 1.15 and 1.20 as the Fed eases and European economy stabilizes
US equities down -10 to -15% as forward earnings decline 5% and valuation falls
Chinese equities down 15% as sentiment tanks further with worse-than-expected economic consequences
USD appreciates to around EURUSD 1.10 and USDCNY 7.1- 7.3, as US tariffs support the USD
US IG -2% to -3% as spreads widen to 280bps, 5y US Treasury drops back to 2016 low and additional loss from 5-10% rating dongrades into HY
US HY -8% to -10% with spreads widening to 800bps. Default rates increase to 5% within 6 months
US equities -10% to -15% as earnings growth disappoints by 5% and valuation compresses by 5% to 10%
US equities +5 to 10% upside as forward estimates rise towards USD 180 and the forward P/E expands to 17x
Chinese equities +10% to 15% due to a recovery on valuation as growth beats consensus expectations
USD depreciates to EURUSD 1.20- 1.25 and USDCNY 6.4- 6.7
Chinese equities +10 to 15% due to a recovery on valuation as growth beats consensus expectations
EMBIGD bonds return 1% to 2% as spreads tighten to around 310bps due to improving EM growth prospects
CNY up to USDCNY 6.4- 6.7 as strong Chinese growth supports the domestic equity market, preventing outflows and supporting inflows of capital
Expected total returns over a 6-month horizon
Note: Upside and downside scenarios are possible events outside of CIO's base case expectations.
Please refer to the last published Global Risk Radar edition for further details on the risk scenarios and investment implications
For further information please contact CIO strategist Dirk Effenberger, dirk.effenberger@ubs.com
Source: UBS, as of June 2019
7
vk.com/id446425943
Key financial market driver 1 - Central bank policy
Key points
•Markets are currently pricing in rate cuts from the US Federal Reserve (Fed) in the near future. We now expect a preemptive 50 basis point cut, probably in July.
•The European Central Bank (ECB) has ended its aggressive phase of bond-buying. Following the recent escalation on the trade front, the Governing Council has adopted an easing bias.
•The Swiss National Bank will likely raise interest rates only after the ECB. The Bank of England's policy remains contingent on the nature of the UK-EU separation although without that uncertainty rates would probably rise.
CIO view (Probability: 60%*) |
Policy on hold in most countries |
•In recent months, inflation has moved further below the US Federal Reserve's 2% target. Combined with some downward surprises in the economic data, such as tepid job growth in May, this has lead the market to price in rate cuts in the near future. The results of the 19 June FOMC meeting have lowered the bar for a rate cut significantly. Therefore, the Fed is likely to cut rates in July unless there is a big move in markets before the meeting. We have changed our base case to call for a 50 basis point cut.
•Given the increasing uncertainties on the back of the trade war, the ECB is ready to ease policy in the event of a significant further escalation. We think that the hurdle for a new sovereign QE program is higher than for further rate cuts.
•In many countries, inflation remains below the central bank's target despite very loose monetary policy and low unemployment rates.
•The tone has shifted as political risks have created economic disruption. Central banks appear keen not to amplify those risks by adding to the uncertainty. Most central banks should remain on hold in the near term. Rate cuts are more likely than hikes in our view (the UK is perhaps an exception).
 Positive scenario (Probability: 30%*)
•Political policy errors threaten economic growth either through more aggressive trade disruption or weaker US or European growth. Central banks respond to the changing economic outlook with appropriate easing.
Negative scenario (Probability: 10%*)
• Tighter labor markets move from squeezing profit margins to causing firms to raise prices more significantly. Trade taxes are passed on more comprehensively than has been the case so far.
*Scenario probabilities are based on qualitative assessment.
Key dates |
|
Jul 25 |
European Central Bank policy decision |
Jul 31 |
US Federal Reserve policy decision |
Aug 1 |
Bank of England policy decision |
|
|
Inflation falls below the Fed's 2% target
PCE price index and Dallas Fed trimmed mean PCE, year- over-year change in %
4
3
2 |
|
Fed target |
|
|
|
|
|
|
|
1 |
|
|
|
|
0 |
|
|
|
|
2010 |
2012 |
2014 |
2016 |
2018 |
|
PCE |
Dallas Fed trimmed mean PCE |
||
Source: Bloomberg, UBS, as of 12 June 2019
Note: PCE = Personal Consumption Expenditures
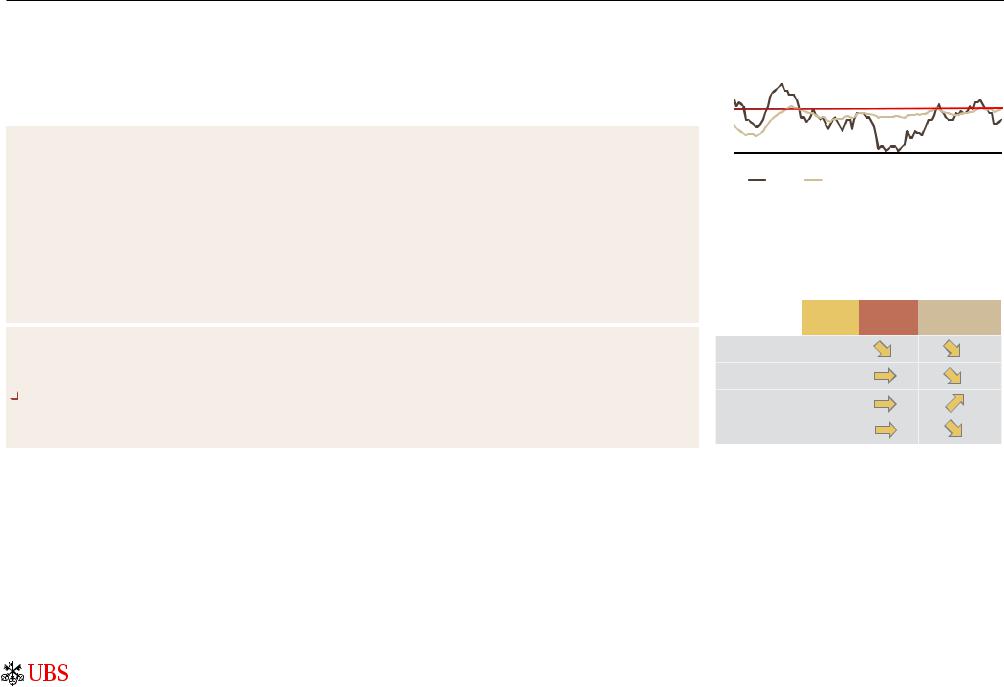
Policy direction
Most central banks are shifting away from tightening policy
US Federal Reserve (Fed
Funds)
European central bank (Refi rate)
Bank of Japan (Balance rate)
Bank of England (Base rate)
Current policy |
2019 policy rate |
rate |
outlook |
2.50%
0.00%
-0.10%
0.50%
2019 outlook for central bank balance sheet as % GDP
Source: Bloomberg, UBS, as of 20 June 2019, using UBS forecasts
For further information please contact US economist Brian Rose, brian.rose@ubs.com, European economist Ricardo Garcia, ricardo-za.garcia@ubs.com or UK economist Dean Turner, dean- |
8 |
a.turner@ubs.com |
|
vk.com/id446425943
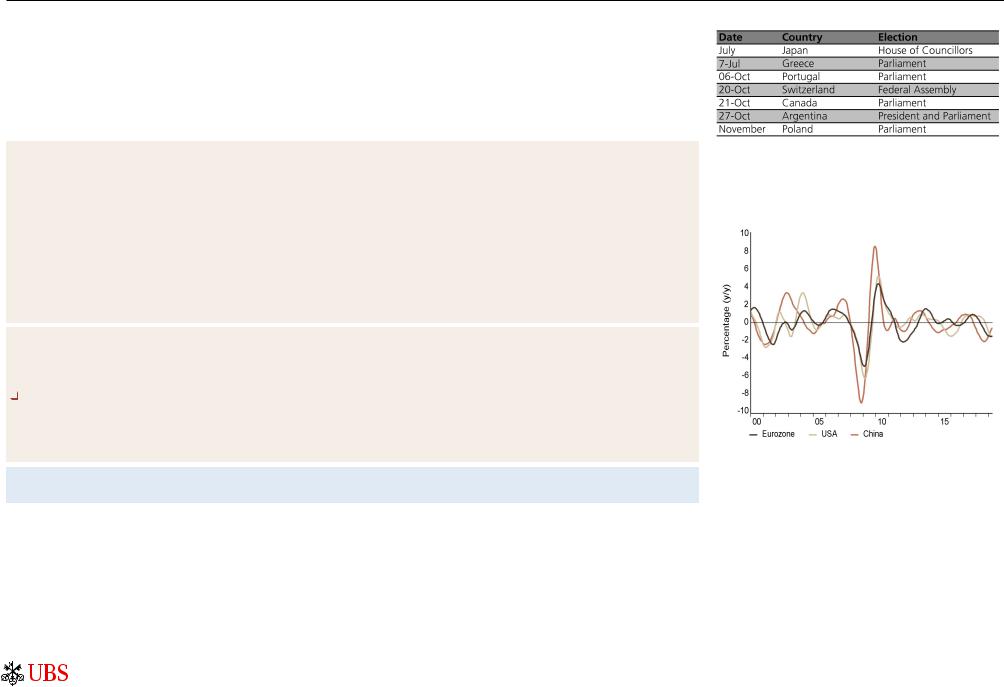
Key financial market driver 2 - Political risks
Selected elections (where dates are known)
Key points
•Trade remains the dominant political risk for financial markets. Uncertainty around trade has left investors reacting to Tweets from the US president and editorials in the Chinese media. Trade taxes between the US and Europe have been postponed, but not removed as a threat.
•Financial markets are more sensitive than the wider economy to trade risks. The longer tariffs are in place, and the larger the number of goods they apply to, the more likely they will be passed on to US consumers.
•The Conservative Party is in the process of finding a new leader who will replace Theresa May as prime minister. Fears about a nodeal exit on 31 October are likely to remain elevated.
CIO view (Probability: 50%*) |
Trade risks eventually calm |
•Over the past nine months the market volatility arising from taxing trade (which can be thought of as being primarily a tax on equities) has been notable. Trade tensions have nonetheless increased. The fact that ordinary consumers have been largely
unaware of the taxes to date may have led to political complacency about the consequences. Any escalation would make those negative consequences more visible, and gives an incentive to resolve the situation over time.
•Brexit: Our base case is for further delay, opening up a wider range of possibilities including a general election. Changing the prime minister will not change the parliamentary arithmetic around the different options; going back to voters at some point seems the only way to break the deadlock.
•In the US, investor attention is being drawn to the debt ceiling and the budget, which need to be addressed by the end of September.
•The change of leadership in European Union institutions is relatively smooth.
 Positive scenario (Probability: 20%*)
•A trade deal is agreed on the fringes of the G20 at Osaka in late June. NAFTA uncertainties are contained. The UK parliament moves more quickly towards a negotiated exit from the EU.
Negative scenario (Probability: 30%*)
•Trade tensions escalate into a full scale Sino-US trade war. Trade taxes are applied between the US and Europe, and NAFTA is called into question.Nationalist tendencies continue to increase. Greater polarization of politics makes compromise on policy increasingly
difficult.
*Scenario probabilities are based on qualitative assessment.
Key dates |
|
Jun 28 |
G20 Osaka Summit |
Source: Wikipedia, as of 17 June 2019
OECD leading indicators
China ahead of the US and the Eurozone
Source: Haver Analytics, as of 17 June 2019
OECD leading indicator refers to the NSA amplitude adjusted total indicator
For further information please contact European Economist, UBS Global WM Ricardo Garcia, , US Economist, UBS Global WM Brian Rose, or UK Economist, UBS Global WM Dean Turner, 9
vk.com/id446425943
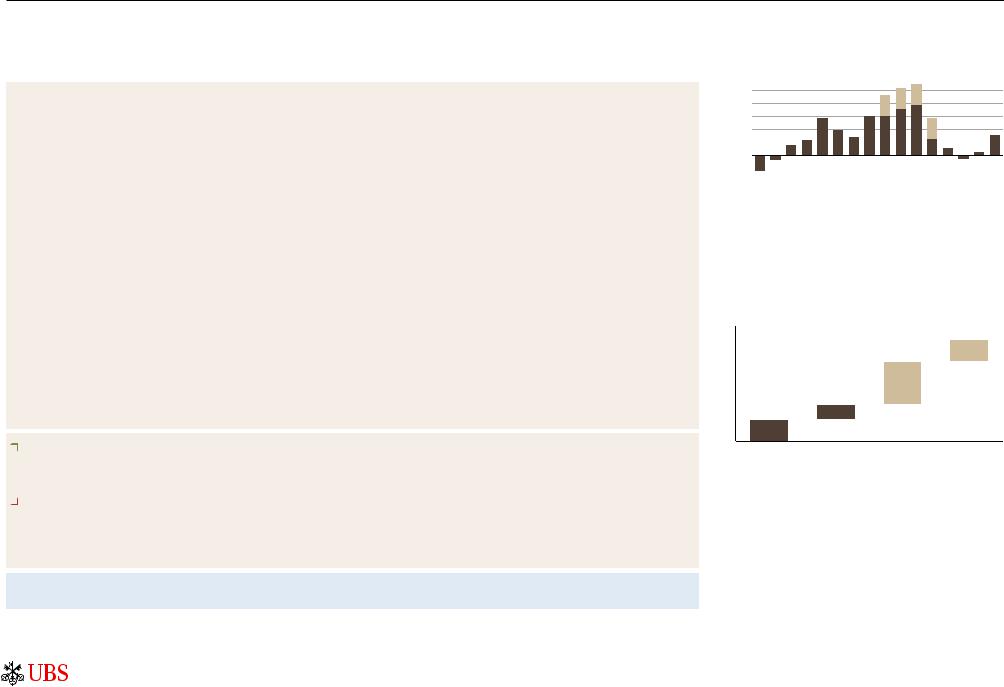
Key financial market driver 3 - Growth is bottoming out
Key points
•Corporate profit growth has decelerated
•But growth should pick up later this year
•We expect S&P 500 EPS growth of 3% in 2019 and 7% in 2020.
CIO view (Probability: 60%*) |
Earnings growth should reaccelerate later this year |
•US earnings growth has decelerated as the one-time boost from a lower tax rate fades and economic growth slows in the US and overseas. Still, a material decline in profits looks unlikely in our view. Leading indicators such as access to capital, business sentiment, and new claims for unemployment insurance remain supportive. Our 2019 S&P 500 EPS estimate is USD 168 (3% growth).
•Earnings growth should modestly re-accelerate later this year and beyond as the economic expansion continues, comparisons in the energy sector get easier, and tech markets stabilize, especially for semiconductors. We forecast 2020 S&P EPS of USD 179 (7% growth).
•S&P 500 earnings grew 3% in the first quarter. We expect growth to be "flattish" again in the second quarter. Encouragingly, analysts are no longer reducing forward earnings growth expectations, due to generally supportive management commentary about the outlook.
•Despite the improving profit picture, investor attention has shifted to renewed trade tensions between the US and China. We continue to believe that a further escalation in the trade dispute is unlikely because it would be disruptive for both economies. However, an easing of tensions may also be difficult to achieve. If the US imposes tariffs on the remaining USD 325 billion of Chinese imports, CIO economists and strategists believe GDP growth could drop by about 0.75–1% and S&P 500 profits could get hit by 3% or more (bottom chart). The pain would likely be larger for the Chinese economy.
•We expect profit margins to fall by a modest 0.4% in 2019. Still, we don't expect margins to decline on a sustained basis. The weakness this year is a result of slow revenue growth and idiosyncratic factors in various sectors such as investment spending in communications services and currency headwinds in consumer staples and tech. Most of the pressure is not due to rising wages. Labor-intensive consumer discretionary companies are the most exposed to higher wage costs but, outside of this sector, the average company should be able to offset higher wages through greater productivity and targeted price increases. Also, bear in mind that higher wages typically translate into faster consumer spending.
Positive scenario (Probability: 20%*) |
Fiscal policy boosts earnings more than expected |
•Boost from fiscal stimulus lasts longer than expected. Deregulation further boosts financial sector earnings. Investment spending picks up.
Negative scenario (Probability: 20%*)
•Trade and geopolitical tensions flare up, depressing business and consumer sentiment. Wage pressures, without improving consumer and business demand, crimp profit margins and earnings growth rates. Declines in long-term interest rates pressure financial sector earnings.
*Scenario probabilities are based on qualitative assessment.
Key dates |
|
Jul 15 |
2Q earnings season begins |
Earnings growth has decelerated but should rebound
S&P 500 EPS growth; tan denotes impact of lower tax rate. 2Q19E–4Q19E are consensus estimates.
30%
25%
20%
15%
10%
5%
0% -5% -10%
1Q16 |
2Q16 |
3Q16 |
4Q16 |
1Q17 |
2Q17 |
3Q17 |
4Q17 |
1Q18 |
2Q18 |
3Q18 |
4Q18 |
1Q19 |
2Q19E |
3Q19E |
4Q19E |
Source: FactSet, UBS, as of 13 June 2019
Trade frictions escalate
Estimated reduction in S&P 500 profits; potential tariffs in tan
8%
1.5%
7% |
|
|
|
|
6% |
|
|
3.0% |
|
5% |
|
|
|
|
4% |
|
|
|
|
3% |
|
1.0% |
|
|
2% |
1.5% |
|
|
|
1% |
|
|
|
|
0% |
|
|
|
|
|
Tariffs In effect as |
Tariffs |
Tariffs on |
US tariffs on |
|
of 9 May |
implemented |
remaining |
automobiles |
|
|
on 10 May |
US/ China trade |
|
Source: UBS, as of 13 June 2019
For further information please contact CIO strategists Jeremy Zirin, jeremy.zirin@ubs.com, David Lefkowitz, david.lefkowitz@ubs.com or Edmund Tran, edmund.tran@ubs.com. 10