

Budgeting Cases-Problems
.pdfBUDGETING AND BUSINESS PERFORMANCE MANAGEMENT
BUDGETING AND BUSINESS PERFORMANCE MANAGEMENT
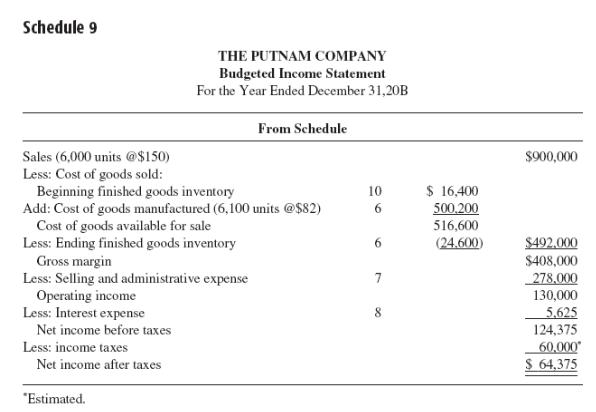
Income statement
Problem 1. Break-Even Point
To illustrate the various concepts of CM, consider these data for Flip Toy Store.
a) Assume that Flip Toy Store wishes to attain a target income of $15,000 before tax and an after-tax income of $9,000. The tax rate is 40 percent. Flip Toy Store projects sales of $37,500. Compute CM, UCM, CMR, Break-even point, Break-even sales, Target income volume, Projected margin of safety.
b)Assume that the company expects sales to go up by $10,000 for the next period. How much will income increase?
c)What net income is expected on sales of $47,500?
d)Assume again that Flip Toy Store is currently selling 1,500 units per period. In an effort to increase sales, management is considering cutting its unit price by $5 and increasing the advertising budget by $1,000. If these two steps are taken, management feels that unit sales will go up by 60 percent. Should the two steps be taken?
1

BUDGETING AND BUSINESS PERFORMANCE MANAGEMENT
Problem 2. Weighted Average Unit CM
Assume that Knibex, Inc., produces cutlery sets out of high-quality wood and steel. The company makes a deluxe cutlery set and a standard set. Compute break-even point, using weighted Average Unit CM
Problem 3. Sales Mix Analysis
Assume that Dante, Inc., is a producer of recreational equipment. It expects to produce and sell three types of sleeping bags—the Economy, the Regular, and the Lux. Information on the bags follows.
a)Total sales are $100,000; the budgeted sales mix: Economy – 30%, Regular – 60%, Lux – 10%. Variable costs are Economy – $24,000, Regular – $40,000, Lux
– $5,000. Fixed costs are $18,600. Calculate CM ratio, Net Income, break-even point for each product.
b)Assume that an actual mix came out differently from the budgeted mix (i.e., for Economy, 30% to 55%; for Regular, 60% to 40%; and for Backpacker, 10% to 5%). Calculate CM ratio, Net Income, break-even point and analyze the variance between the budget and the actual numbers.
Case 1. Master Budget
To illustrate how all these budgets are put together, we will focus on a manufacturing company called the Putnam Company, which produces and markets a single product.
We will make these assumptions:
The company uses a single material and one type of labor in the manufacture of the product.
It prepares a master budget on a quarterly basis.
Work-in-process inventories at the beginning and end of the year are negligible and are ignored.
The company uses a single cost driver—direct labor hours (DLH)—as the allocation base for assigning all factory overhead costs to the product.
2

BUDGETING AND BUSINESS PERFORMANCE MANAGEMENT
Monthly Cash Collections from Customers
The budgeted cash receipts for June and July are computed:
3
BUDGETING AND BUSINESS PERFORMANCE MANAGEMENT
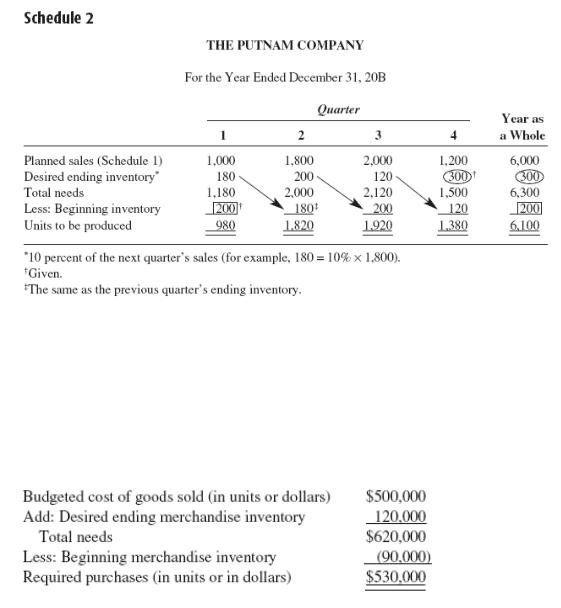
Production Budget
Expected production volume=Planning sales + Desired ending inventory - Beginning inventory
Production Budget
`
Inventory Purchases, Merchandising Firm
Putnam Company is a manufacturing firm, so it prepares a production budget, as shown in Schedule 2. If the company were a merchandising (retailing or wholesaling) firm, then instead of a production budget, it would develop a merchandise purchase budget showing the amount of goods to be purchased from its suppliers during the period. The merchandise purchases budget is in the same basic format as the production budget, except that it shows goods to be purchased rather than goods to be produced:
4
BUDGETING AND BUSINESS PERFORMANCE MANAGEMENT
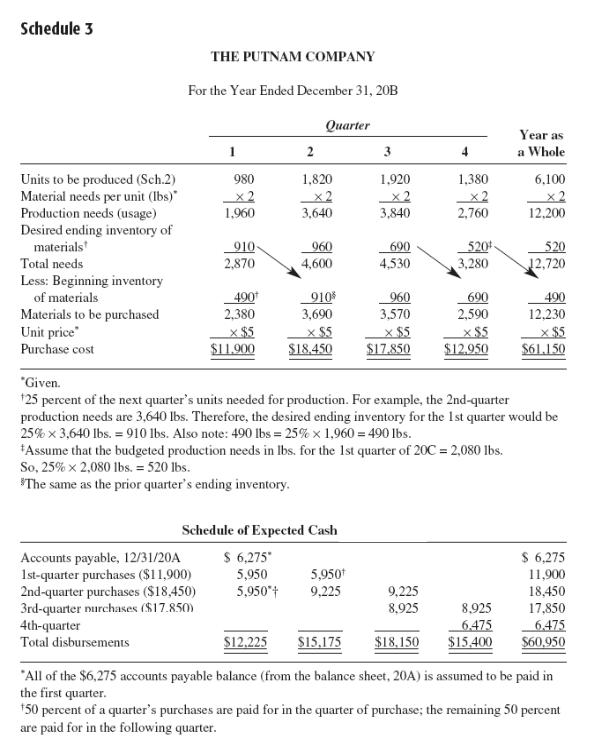
Direct Material Budget
Purchase in units = Usage + Desired ending material inventory units– Beginning inventory units
Direct Material Budget
Payments
purchases ($12.950)
5
BUDGETING AND BUSINESS PERFORMANCE MANAGEMENT
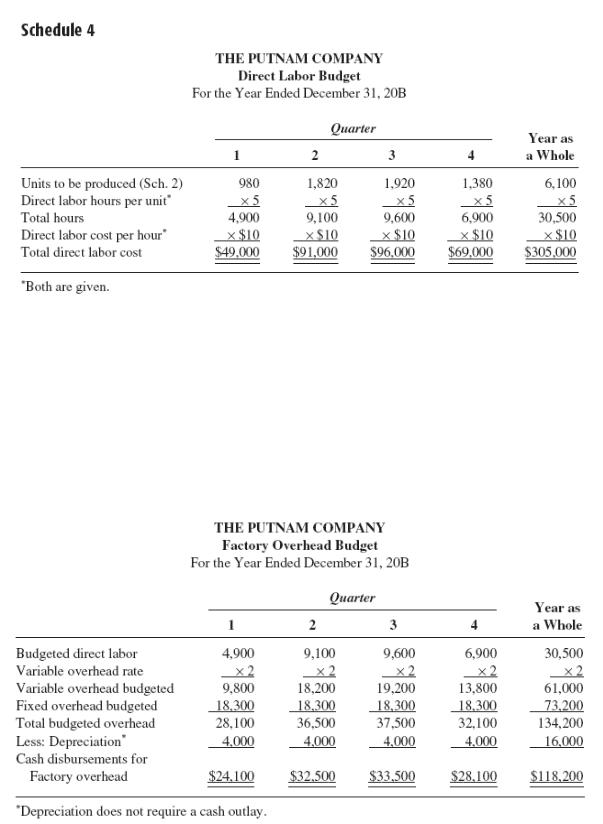
Direct Labor Budget
Factory Overhead Budget
To illustrate the factory overhead budget, we will assume that
Total factory overhead budgeted = $18,300 fixed (per quarter), plus $2 per hour of direct
labor. This is one example of a cost-volume (or flexible budget) formula (y = a + bx), developed via the least-squares method with a high R2.
Depreciation expenses are $4,000 each quarter.
Overhead costs involving cash outlays are paid for in the quarter incurred.
Schedule 5
6
BUDGETING AND BUSINESS PERFORMANCE MANAGEMENT
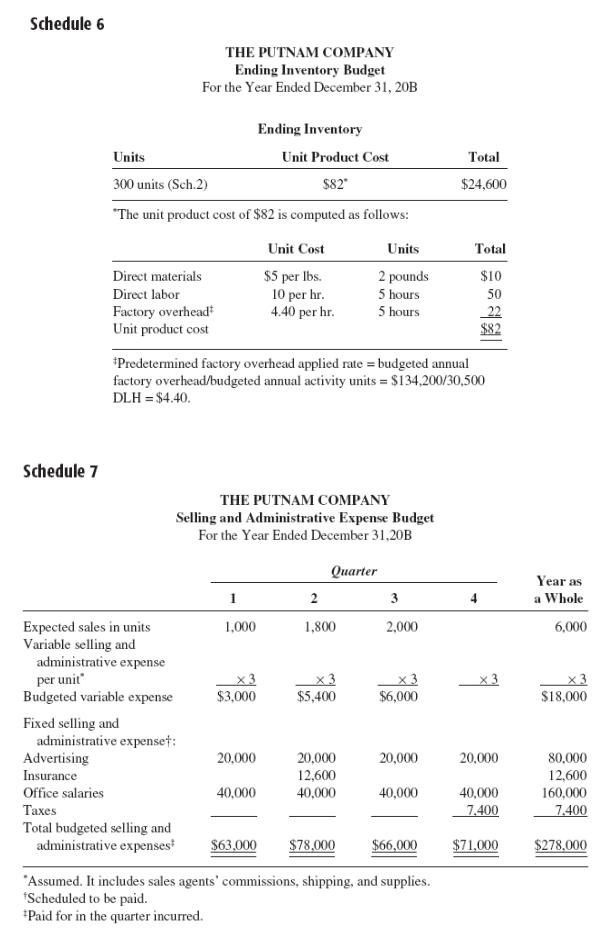
Ending Finished Goods Inventory Budget
Selling and Administrative Expense Budget
1,200
3,600
7

BUDGETING AND BUSINESS PERFORMANCE MANAGEMENT
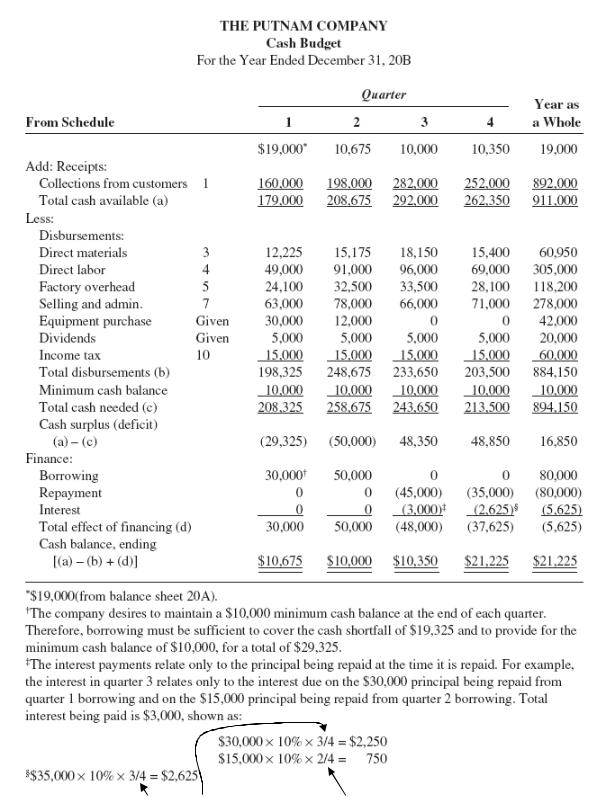
Cash Budget
To illustrate, we will make these assumptions:
Putnam Company has an open line of credit with its bank, which can be used as needed to bolster the cash position.
The company desires to maintain a $10,000 minimum cash balance at the end of each quarter. Therefore, borrowing must be sufficient to cover the cash shortfall and to provide for the minimum cash balance of $10,000.
All borrowings and repayments must be in multiples of $1,000 amounts, and interest is 10 percent per annum.
Interest is computed and paid on the principal as the principal is repaid.
All borrowings take place at the beginning of a quarter, and all repayments are made at the end of a quarter.
No investment option is allowed in this example. The loan is self-liquidating in the sense that the borrowed money is used to obtain resources that are combined for sale, and the proceeds
from sales are used to pay back the loan.
Note: To be useful for cash planning and control, the cash budget must be prepared on a monthly basis.
Note also:
8
BUDGETING AND BUSINESS PERFORMANCE MANAGEMENT
Schedule 8
Cash balance, beginning
The credit is taken for 3 quarters of the year. |
The credit is taken for a half a year. |
9
BUDGETING AND BUSINESS PERFORMANCE MANAGEMENT
Budgeted Income Statement
10