

The Supply and Demand for Gold
Data on the supply and demand for gold are compiled by GFMS Ltd. The company provides a number of tables exclusively for the World Gold Council. The following table shows a summary of gold demand. Links to more detailed tables, and to notes and copyright information, are given below. Please note the restrictions on disseminating these data.
Notes: Source: Tonnage data are GFMS Ltd. Value data are WGC calculations based on GFMS data. 1. Identifiable end-use consumption excluding central banks. 2. Provisional. 3. "Other retail" excludes bar and primary coin offtake; it represents mainly activity in North America and Western Europe. 4. Exchange Traded Funds and similar products including LyxOR Gold Bullion Securities, Gold Bullion Securities (Australia), streetTRACKS Gold Shares, NewGold Gold Debentures, iShares Comex Gold Trust, Central Fund of Canada and Central Gold Trust.
The Gold Price
The gold price used in the charts and statistics on this site is the London PM fix. This price is quoted in US dollars. Where the gold price is presented in currencies other than the US dollar, it is converted into the local currency unit using the foreign exchange rate closing price on the same day. For example, the London PM fix on 31st October 2003 was USD 386.25 and the closing price for one USD was GBP 0.591. The gold price in pounds sterling (GBP) would therefore be calculated as ?228.24.
Like all prices, the gold price reflects not only the inherent value of gold, but also the relative strength of the currency in which it is quoted. For example, the dollar price of gold may increase more in percentage terms than the sterling price of gold, to the extent that the change in price is a reflection of dollar weakness (in this case, against sterling) rather than an intrinsic change in gold market fundamentals. For this reason, our Investment Statistics contain charts showing an index of the gold price in US dollars and local currency units as well as the relevant US dollar / local currency unit exchange rate for countries other than the United States. In addition, our “G5” price index is an average (weighted by GDP) of the gold price in US dollars, Euros, Yen, Sterling and the Canadian dollar; this is calculated to compensate for changes in the gold price that are simply a reflection of one currency’s movement.
Source - www.gold.org
Palladium Market: Supply and Demand
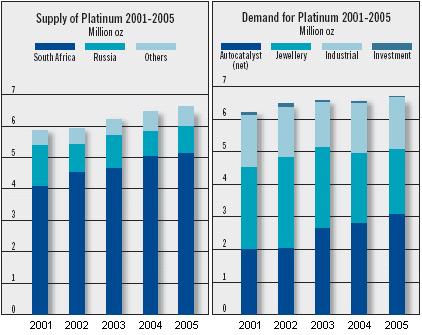
Platinum Supply
Platinum supplies from South Africa totalled 5.11 million oz in 2005, up by 100,000 oz compared with the previous year. Output of refined metal from Anglo Platinum was unchanged at just over 2.45 million oz, falling short of the company’s intended output of 2.6 to 2.7 million oz. This was primarily due to an explosion at the group’s Polokwane smelter in September that resulted in 120,000 oz of platinum accumulating in unprocessed stocks of concentrate.
Refined platinum production from Impala’s main lease area on the western Bushveld rose by 6 per cent to almost 1.16 million oz last year thanks to increased mill throughput and a significant improvement in concentrator recoveries. The developing Marula Platinum mine on the eastern Bushveld, however, contributed only 31,000 oz of platinum in concentrate as the operation began making a transition from mechanised to conventional mining. Lonmin produced 963,000 oz of platinum in 2005, a record for the group. Output from the company’s western Bushveld mines increased as greater production from underground operations led to an improvement in head grades. Lonmin also gained a small volume of pgm output from the Messina mine on the eastern limb of the Bushveld complex, which it acquired in June 2005. Northam’s platinum production climbed to 225,000 oz, up 18 per cent on the previous year when the mine lost six weeks’ output due to a fire. In addition, new technology at the company’s UG2 concentrator contributed to an improvement in recoveries. Aquarius Platinum’s Kroondal and Marikana mines are both now operated under Pool & Share Agreements with Anglo Platinum. Platinum output attributable to Aquarius from the two operations in 2005 totalled just over 200,000 oz. The concentrator at the company’s newest mine at Everest South was commissioned during December. Platinum output from the Modikwa joint venture between Anglo Platinum and African Rainbow Minerals increased by 13 per cent to 129,000 oz, whilst the concentrator at the Crocodile River operations of Barplats was refurbished during the year. Russian sales of platinum increased by 5 per cent to 890,000 oz in 2005. Norilsk Nickel was able to release details of its pgm output for the first time – the company produced 751,000 oz of platinum during the year, with output in the second half boosted by a reduction in pipeline stocks of pgm. Production from the alluvial mines in the Far East of Russia was relatively stable, whilst there was no evidence of sales by either the Ministry of Finance or the Central Bank. Supplies of platinum from North America declined by almost 7 per cent to 360,000 oz in 2005. Sales of re? ned platinum by Stillwater Mining increased, despite a slight decline in average grades at its mining operations in Montana, but this was offset by lower output at Inco, Falconbridge and North American Palladium. Production of platinum in Zimbabwe grew to 153,000 oz, up by 10,000 oz on the previous year as a result of increased output at both the Mimosa and Ngezi mines.