

01 POWER ISLAND / 02 H2+NH3 / The_Future_of_Hydrogen-IEA-2020
.pdfThe Future of Hydrogen |
Chapter 2: Producing hydrogen and hydrogen-based products |
|
|
|
|
Box 3. Emerging technologies to produce hydrogen
Methane splitting offers a potential new way to produce hydrogen from natural gas. Various technologies have been developed since the 1990s. The main technology is based on alternatingcurrent three-phase plasma, and uses methane as a feedstock and electricity as an energy source. It produces hydrogen and solid carbon, but no CO2 emissions (Fulcheri, 2018).
Methane splitting requires high-temperature plasma and significant thermal losses reduce its efficiency advantage, but it uses three to five times less electricity than electrolysis for the same amount of hydrogen produced. It has very low CO2 formation and creates solid carbon in the form of carbon black. It requires more natural gas than electrolysis, but could create additional revenue streams from the sale of carbon black for use in rubber, tyres, printers and plastics. The US firm Monolith Materials operates a pilot methane splitting plant in California and is building an industrial plant in Nebraska; the Nebraska plant will ultimately be run on low-carbon electricity and sell hydrogen to the Nebraska Public Power District, which plans to convert a 125 MW coal plant to burn hydrogen instead of coal. Although the total efficiency would be lower than using the natural gas directly in the power plant, the emissions from gas combustion would be avoided and the hydrogen would effectively be a “store” of input electricity for the power network.
Global demand for carbon black is expected to increase from 12 Mt to 16 Mt in the next five years, which would have significant accompanying CO2 emissions using current technology. Producing under 5 MtH2/yr of hydrogen via methane splitting could substitute all this demand and avoid these emissions. Markets for other exotic forms of solid carbon – carbon nanotubes, carbon fibres, graphene – are one to two orders of magnitude smaller than that for carbon black, but could grow rapidly with the expansion of batteries or carbon-reinforced concrete (Dagle et al., 2017). Other solid carbon markets may provide other options (Hanson, 2018).
Meanwhile, alternative process designs for SMR are being explored. While natural gas would still be required as feedstock, other energy sources could be used to produce the necessary steam, and this could facilitate the capture of the more concentrated “process” CO2 stream. Electricity is a potential candidate for the production of the necessary high-temperature steam (Bazzanella and Ausfelder, 2017), while concentrating solar heat could be used in areas with the right kind of solar resources.
If even higher levels of solar concentration could generate temperatures of around 800–1 000°C, solar energy could be used directly to split water into hydrogen and oxygen without the need for natural gas and CO2 storage. The technology for these higher solar concentration levels, however, is still at laboratory scale.
Sources: Fulcheri (2018), “Direct decarbonization of methane by thermal plasma for the co-production of hydrogen and carbon nanostructures”; Dagle et al. (2017), “An overview of natural gas conversion technologies for co-production of hydrogen and valueadded solid carbon products”; Bazzanella and Ausfelder (2017), “Low carbon energy and feedstock for the European chemical industry”; and personal communication with Rob Hanson, 2018.
PAGE | 41
IEA. All rights reserved.

The Future of Hydrogen |
Chapter 2: Producing hydrogen and hydrogen-based products |
Costs of hydrogen production from natural gas
The production cost of hydrogen from natural gas is influenced by various technical and economic factors, with gas prices and capital expenditure (CAPEX) being the two most important.
Fuel costs are the largest cost component in all regions and account for between 45% and 75% of production costs (Figure 9). Low gas prices in the Middle East, the Russian Federation, and North America give rise to some of the lowest hydrogen production costs. Gas importers such as Japan, Korea, China and India have to contend with higher gas import prices, and that makes for higher hydrogen production costs.
Figure 9. Hydrogen production costs using natural gas in different regions, 2018
Notes: kgH2 = kilogram of hydrogen; OPEX = operational expenditure. CAPEX in 2018: SMR without CCUS = USD 500–900 per kilowatt hydrogen (kWH2), SMR with CCUS = USD 900–1 600/kWH2, with ranges due to regional differences. Gas price = USD 3–11 per million British thermal units (MBtu) depending on the region. More information on the underlying assumptions is available at www.iea.org/hydrogen2019.
Source: IEA 2019. All rights reserved.
Availability of low-cost gas is a crucial cost determinant for SMR-based hydrogen.
Adding CCUS to SMR plants leads, on average, to cost increases of some 50% for CAPEX and some 10% for fuel, with the exact amounts depending on the design. It also leads on average to a doubling of OPEX as a result of CO2 transport and storage costs. In the most promising regions, however, costs for hydrogen from SMR with CCUS are in the range of USD 1.4–1.5/kgH2, making it one of the lowest cost low-carbon hydrogen production routes (see section “Comparison between alternative hydrogen production pathways” in this chapter.for a comparison with other production technologies).
Hydrogen from water and electricity
Water electrolysis is an electrochemical process that splits water into hydrogen and oxygen. Less than 0.1% of dedicated hydrogen production globally comes from water electrolysis today, and the hydrogen produced by this means is mostly used in markets where high-purity hydrogen is necessary (for example, electronics and polysilicon). In addition to the hydrogen
PAGE | 42
IEA. All rights reserved.

The Future of Hydrogen |
Chapter 2: Producing hydrogen and hydrogen-based products |
produced through water electrolysis, around 2% of total global hydrogen is created as a byproduct of chlor-alkali electrolysis in the production of chlorine and caustic soda.
With declining costs for renewable electricity, in particular from solar PV and wind, interest is growing in electrolytic hydrogen (Chapter 4) and there have been several demonstration projects in recent years. The efficiency of electrolyser systems today ranges between 60% and 81% depending on the technology type and load factor. Producing all of today’s dedicated
hydrogen output (69 MtH2) |
from |
electricity |
would |
result |
in an electricity demand of |
3 600 terawatt hours (TWh), |
more |
than the |
total |
annual |
electricity generation of the |
European Union. |
|
|
|
|
|
Electrolysis requires water as well as electricity. Around 9 litres of water are needed to produce 1 kgH2,9 producing 8 kilograms (kg) of oxygen as a by-product, which at smaller scale can be used in the health care sector or at a larger scale for industrial purposes. If all of today’s dedicated hydrogen production of around 70 MtH2 were to be produced by electrolysis, this would result in a water demand of 617 million cubic metres (m3), which would correspond to 1.3% of the water consumption of the global energy sector today (IEA, 2016) or roughly twice the current water consumption for hydrogen from SMR (345 million m3 of water for 52 MtH2 from SMR).
Freshwater access can be an issue in water-stressed areas. Using seawater could become an alternative in coastal areas. Using reverse osmosis for desalination requires an electricity demand of 3–4 kilowatt hours (kWh) per m3 of water and costs around USD 0.7–2.5 per m3 of water (Tractebel, 2018; Caldera et al., 2018). This has only a minor impact on the total costs of water electrolysis, increasing total hydrogen production costs by USD 0.01–0.02/kgH2. Direct use of seawater in electrolysis currently leads to corrosive damage and to the production of chlorine, but research is looking at how to make it easier to use seawater in electrolysis in the future.
Technology options
Three main electrolyser technologies exist today: alkaline electrolysis, proton exchange membrane (PEM) electrolysis, and solid oxide electrolysis cells (SOECs). Their main technical and economic characteristics are summarised in Table 3.
Alkaline electrolysis is a mature and commercial technology. It has been used since the 1920s, in particular for hydrogen production in the fertiliser and chlorine industries. The operating range of alkaline electrolysers goes from a minimum load of 10% to full design capacity. Several alkaline electrolysers with a capacity of up to 165 megawatts electrical (MWe) were built in the last century in countries with large hydropower resources (Canada, Egypt, India, Norway and Zimbabwe), although almost all of them were decommissioned when natural gas and steam methane reforming for hydrogen production took off in the 1970s. Alkaline electrolysis is characterised by relatively low capital costs compared to other electrolyser technologies due to the avoidance of precious materials.
PEM electrolyser systems were first introduced in the 1960s by General Electric to overcome some of the operational drawbacks of alkaline electrolysers. They use pure water as an electrolyte solution, and so avoid the recovery and recycling of the potassium hydroxide electrolyte solution that is necessary with alkaline electrolysers. They are relatively small,
9 For comparison, SMR without CCUS requires around 7 litres of raw water per kgH2 (IEAGHG, 2017b).
PAGE | 43
IEA. All rights reserved.

The Future of Hydrogen |
Chapter 2: Producing hydrogen and hydrogen-based products |
making them potentially more attractive than alkaline electrolysers in dense urban areas. They are able to produce highly compressed hydrogen for decentralised production and storage at refuelling stations (30–60 bar without an additional compressor and up to 100–200 bar in some systems, compared to 1–30 bar for alkaline electrolysers) and offer flexible operation, including the capability to provide frequency reserve and other grid services. Their operating range can go from zero load to 160% of design capacity (so it is possible to overload the electrolyser for some time, if the plant and power electronics have been designed accordingly). Against this, however, they need expensive electrode catalysts (platinum, iridium) and membrane materials, and their lifetime is currently shorter than that of alkaline electrolysers. Their overall costs are currently higher than those of alkaline electrolysers, and they are less widely deployed.
SOECs are the least developed electrolysis technology. They have not yet been commercialised, although individual companies are now aiming to bring them to market. SOECs use ceramics as the electrolyte and have low material costs. They operate at high temperatures and with a high degree of electrical efficiency. Because they use steam for electrolysis, they need a heat source. If the hydrogen produced were to be used for the production of synthetic hydrocarbons (power-to-liquid and power-to-gas), the waste heat from these synthesis processes (e.g. Fischer-Tropsch synthesis, methanation) could be recovered to produce steam for further SOEC electrolysis. Nuclear power plants, solar thermal or geothermal heat systems could also be heat sources for high-temperature electrolysis (Box 4).
Unlike alkaline and PEM electrolysers, it is possible to operate an SOEC electrolyser in reverse mode as a fuel cell, converting hydrogen back into electricity, which means it could provide balancing services to the grid in combination with hydrogen storage facilities. This would increase the overall utilisation rate of the equipment. It is also possible to use a SOEC electrolyser for co-electrolysis of steam and carbon dioxide, producing a gas mixture (carbon monoxide and hydrogen) for subsequent conversion to a synthetic fuel. One key challenge for those developing SOEC electrolysers is addressing the degradation of materials that results from the high operating temperatures.
Table 3. Techno-economic characteristics of different electrolyser technologies
|
|
|
|
Alkaline electrolyser |
PEM electrolyser |
|
|
SOEC electrolyser |
|||||||||||||||||||||
|
|
|
|
|
|
|
|
|
|
|
|
|
|
|
|
|
|
|
|
|
|
|
|
|
|
|
|
|
|
|
|
|
|
Today |
|
2030 |
|
Long |
|
Today |
|
2030 |
|
|
|
Long- |
|
|
|
Today |
|
|
|
2030 |
|
|
|
Long |
|
|
|
|
|
|
|
term |
|
|
|
|
|
term |
|
|
|
|
|
|
|
|
|
term |
|
||||||
|
|
|
|
|
|
|
|
|
|
|
|
|
|
|
|
|
|
|
|
|
|
|
|
|
|
|
|||
|
Electrical |
|
|
|
|
|
|
|
|
|
|
|
|
|
|
|
|
|
|
|
|
|
|
|
|
|
|
|
|
|
efficiency (%, |
|
63–70 |
65–71 |
70–80 |
56–60 |
63–68 |
|
|
67–74 |
|
|
74–81 |
|
|
77–84 |
|
|
77–90 |
||||||||||
|
LHV) |
|
|
|
|
|
|
|
|
|
|
|
|
|
|
|
|
|
|
|
|
|
|
|
|
|
|
|
|
|
|
|
|
|
|
|
|
|
|
|
|
|
|
|
|
|
|
|
|
|
|
|
|
|
|
|
|
|
|
|
Operating |
|
|
1–30 |
|
|
|
|
|
30–80 |
|
|
|
|
|
|
|
|
|
1 |
|
|
|
|
|
|
|
|
|
|
pressure (bar) |
|
|
|
|
|
|
|
|
|
|
|
|
|
|
|
|
|
|
|
|
|
|
|
|
|
|||
|
|
|
|
|
|
|
|
|
|
|
|
|
|
|
|
|
|
|
|
|
|
|
|
|
|
|
|
|
|
|
|
|
|
|
|
|
|
|
|
|
|
|
|
|
|
|
|
|
|
|
|
|
|
|
|
|
|
|
|
|
Operating |
|
|
|
|
|
|
|
|
|
|
|
|
|
|
|
650 |
|
|
|
|
|
|
|
|
|
|||
|
temperature |
|
60–80 |
|
|
|
|
50–80 |
|
|
|
|
|
|
|
|
– |
|
|
|
|
|
|
|
|
||||
|
(°C) |
|
|
|
|
|
|
|
|
|
|
|
|
|
|
|
1 000 |
|
|
|
|
|
|
|
|
|
|||
|
|
|
|
|
|
|
|
|
|
|
|
|
|
|
|
|
|
|
|
|
|||||||||
|
Stack lifetime |
|
|
60 000 |
|
90 000 |
|
100 000 |
|
30 000 |
|
60 000 |
|
|
|
100 000 |
|
|
|
10 000 |
|
|
|
40 000 |
|
|
|
75 000 |
|
|
(operating |
|
|
– |
|
– |
|
– |
|
– |
|
– |
|
|
|
– |
|
|
|
– |
|
|
|
– |
|
|
|
– |
|
|
hours) |
|
|
90 000 |
|
100 000 |
|
150 000 |
|
90 000 |
|
90 000 |
|
|
|
150 000 |
|
|
|
30 000 |
|
|
|
60 000 |
|
|
|
100 00 |
|
|
Load range |
|
|
|
|
|
|
|
|
|
|
|
|
|
|
|
|
|
|
|
|
|
|
|
|
|
|
|
|
|
(%, relative to |
|
10–110 |
|
|
|
|
0–160 |
|
|
|
|
|
|
|
|
20–100 |
|
|
|
|
|
|
|
|
||||
|
nominal load) |
|
|
|
|
|
|
|
|
|
|
|
|
|
|
|
|
|
|
|
|
|
|
|
|
|
|
|
|
|
|
|
|
|
|
|
|
|
|
|
|
|
|
|
|
|
|
|
|
|
|
|
|
|
|
|
|
|
|
|
Plant |
|
|
|
|
|
|
|
|
|
|
|
|
|
|
|
|
|
|
|
|
|
|
|
|
|
|
|
|
|
footprint |
|
|
0.095 |
|
|
|
|
|
0.048 |
|
|
|
|
|
|
|
|
|
|
|
|
|
|
|
|
|
|
|
|
(m2/kWe) |
|
|
|
|
|
|
|
|
|
|
|
|
|
|
|
|
|
|
|
|
|
|
|
|
|
|
|
|
|
|
|
|
|
|
|
|
|
|
PAGE | 44 |
|
|
|
|
|
|
|
|
|
|
|
|
|
|
|
|
|
|
|
IEA. All rights reserved.

The Future of Hydrogen Chapter 2: Producing hydrogen and hydrogen-based products
|
|
|
Alkaline electrolyser |
|
PEM electrolyser |
|
|
SOEC electrolyser |
||||||||||||||||||||||||
|
|
|
|
|
|
|
|
|
|
|
|
|
|
|
|
|
|
|
|
|
|
|
|
|
|
|
|
|
|
|
|
|
|
|
|
Today |
|
|
2030 |
|
|
Long |
|
|
Today |
|
|
2030 |
|
|
|
Long- |
|
|
|
Today |
|
|
|
2030 |
|
|
|
Long |
|
|
|
|
|
|
|
|
term |
|
|
|
|
|
|
|
term |
|
|
|
|
|
|
|
|
|
term |
|
||||||
|
|
|
|
|
|
|
|
|
|
|
|
|
|
|
|
|
|
|
|
|
|
|
|
|
|
|
|
|
|
|||
|
Electrical |
|
|
|
|
|
|
|
|
|
|
|
|
|
|
|
|
|
|
|
|
|
|
|
|
|
|
|
|
|
|
|
|
efficiency (%, |
|
63–70 |
|
65–71 |
|
70–80 |
|
56–60 |
|
63–68 |
|
|
67–74 |
|
|
74–81 |
|
|
77–84 |
|
|
77–90 |
|||||||||
|
LHV) |
|
|
|
|
|
|
|
|
|
|
|
|
|
|
|
|
|
|
|
|
|
|
|
|
|
|
|
|
|
|
|
|
CAPEX |
500 |
|
400 |
|
200 |
|
1 100 |
|
650 |
|
200 |
|
2 800 |
|
800 |
|
500 |
|
|||||||||||||
|
|
– |
|
– |
|
– |
|
– |
|
– |
|
|
– |
|
|
– |
|
|
– |
|
|
– |
||||||||||
|
(USD/kWe) |
|
|
|
|
|
|
|
|
|
|
|
|
|
||||||||||||||||||
|
1400 |
|
850 |
|
700 |
|
1 800 |
|
1 500 |
|
900 |
|
5 600 |
|
2 800 |
|
1 000 |
|
||||||||||||||
|
|
|
|
|
|
|
|
|
|
|
||||||||||||||||||||||
Notes: LHV = lower heating value; m2/kWe = square metre per kilowatt electrical. No projections made for future operating pressure and temperature or load range characteristics. For SOEC, electrical efficiency does not include the energy for steam generation. CAPEX represents system costs, including power electronics, gas conditioning and balance of plant; CAPEX ranges reflect different system sizes and uncertainties in future estimates.
Sources: Buttler and Spliethoff (2018), “Current status of water electrolysis for energy storage, grid balancing and sector coupling via power-to-gas and power-to-liquids: a review”; Agora Verkehrswende, Agora Energiewende and Frontier Economics (2018), The Future Cost of Electricity-Based Synthetic Fuels; NOW (2018), Studie IndWEDe Industrialisierung der Wasserelektrolyse in Deutschland: Chancen und Herausforderungen für nachhaltigen Wasserstoff für Verkehr, Strom und Wärme; Schmidt et al. (2017), “Future cost and performance of water electrolysis: An expert elicitation study”; FCH JU (2014), Development of Water Electrolysis in the European Union, Final Report; Element Energy (2018), “Hydrogen supply chain evidence base”.
There has been an increase in new electrolysis installations over the last decade aimed at producing hydrogen from water, with PEM technology making significant inroads into the market. Geographically most of the projects are in Europe, although projects have also been started or announced in Australia, China and the Americas. The average unit size of these electrolyser additions has increased in recent years from 0.1 MWe in 2000–09 to 1.0 MWe in 2015–19, indicating a shift from small pilot and demonstration projects to commercial-scale applications. This should start to create economies of scale that will help to drive down capital costs and to scale up the supply chain of the electrolyser industry (Figure 10). Several projects under development have electrolyser sizes of 10 MWe or above, and some projects with electrolyser sizes of 100 MWe or larger are now under discussion.
Figure 10. Development of electrolyser capacity additions for energy purposes and their average unit size, 1990–2019
Note: Capacity additions refer to already installed capacity additions and are cumulated over the specified 5-year periods.
Sources: IEA analysis based on Chehade et al. (2019), “Review and analysis of demonstration projects on Power-to-X pathways in the world”, IEA (2018), World Energy Investment, and the World Energy Council (2018), “Hydrogen an enabler of the Grand Transition” and data provided by IEA Hydrogen Technology Collaboration Programme.
Global electrolyser capacity additions for energy purposes have been growing rapidly in recent years, and installations have been growing in size, providing cost reductions from economies of scale and learning effects.
PAGE | 45
IEA. All rights reserved.

The Future of Hydrogen |
Chapter 2: Producing hydrogen and hydrogen-based products |
Box 4. Thermal routes for hydrogen production – a case for nuclear?
Heat can be used in various ways in the production of hydrogen. Heat in form of steam is required in the process of steam methane reforming. The electricity consumption of water electrolysis can be reduced by not electrolysing liquid water, but steam, so shifting part of the required energy for the electrolysis from electrical to thermal energy. SOEC is an example of such a high-temperature electrolysis. This means that there is a lot of interest in the scope for integrating heat into hydrogen production and how best to source heat requirements. Potential opportunities exist for places where low-cost heat is available, whether this comes from sources such as waste heat from industrial processes, or from geothermal or solar heat in regions with good resources.
Nuclear power plants are another option for the provision of heat for hydrogen production. They could, for example, provide steam for natural gas-based steam methane reforming. Depending on local conditions, using steam from nuclear power could be cheaper than using steam from natural gas, as well as reducing the carbon intensity of the hydrogen produced. It could also provide a useful additional revenue stream for nuclear power plants.
Electricity and heat (produced at temperature levels of around 300°C by nuclear power plants) could also be used to provide electricity and steam for SOEC electrolysis. Research is underway to develop materials for SOEC electrolysis that are well suited to the temperature levels of nuclear energy heat sources (US-DOE, 2018).
Small modular reactors could also have a role to play in SOEC electrolysis in the future. Six small modular reactors with a combined capacity of 300 MWe could, for example, meet the annual hydrogen demand of a mid-sized ammonia plant (73 000 tonnes of hydrogen per year [tH2/yr]). Exploring non-electric applications for small modular reactors, such as hydrogen, is part of the Joint Use Modular Plant (JUMP) research programme in the United States.
In the longer term, advanced nuclear reactors, such as the two industrial prototype hightemperature pebble-bed reactors currently being constructed in China, could also become the heat source for thermochemical water splitting, with some reactor designs having coolant outlet temperatures of 800–1 000°C.
Source: US-DOE (2018), “Energy Department announces up to $3.5m for nuclear-compatible hydrogen production”.
Costs of hydrogen production from water and electricity
The production costs of hydrogen from water electrolysis are influenced by various technical and economic factors, with CAPEX requirements, conversion efficiency, electricity costs and annual operating hours being the most important.
CAPEX requirements are today in the range of USD 500–1 400/kWe for alkaline electrolysers and USD 1 100–1 800/kWe for PEM electrolysers, while estimates for SOEC electrolysers range across USD 2 800–5 600/kWe (Table 3). The electrolyser stack is responsible for 50% and 60% of the CAPEX costs of alkaline and PEM electrolysers respectively. The power electronics, gas-conditioning and plant components account for most of the rest of the costs.
Future cost reductions will be influenced by innovations in the technologies themselves, (for example the development of less costly materials for electrodes and membranes), and by economies
PAGE | 46
IEA. All rights reserved.
The Future of Hydrogen |
Chapter 2: Producing hydrogen and hydrogen-based products |
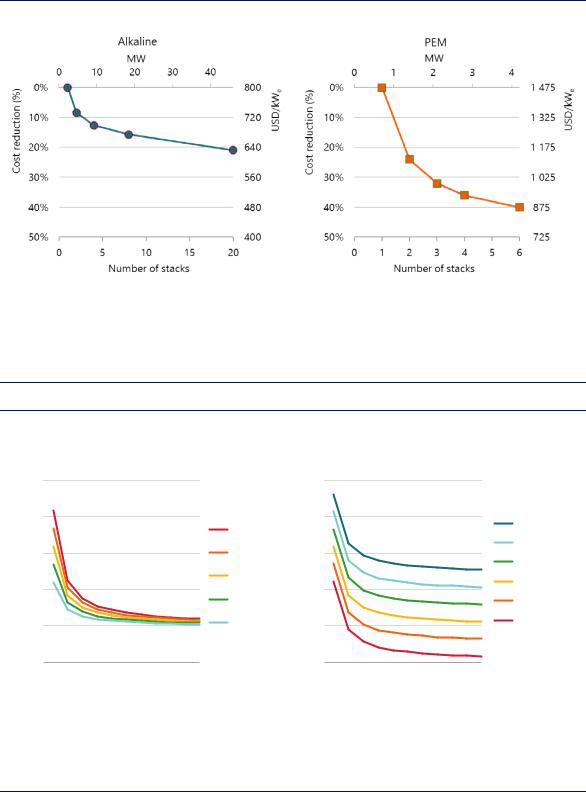
of scale in the manufacturing processes (for example by the development of larger electrolysers). Figure 11 illustrates the potential for cost reduction in current alkaline and PEM electrolysers from switching to larger multi-stack systems (combining several electrolyser stacks to increase the overall capacity of the electrolyser system).
Figure 11. Expected reduction in electrolyser CAPEX from the use of multi-stack systems
Notes: Based on a single stack size of 2 MW for alkaline electrolysis and 0.7 MW for PEM electrolysis.
Source: Based on analysis supported by Task 38 of the IEA Hydrogen Technology Collaboration Programme and published in Proost (2018), “State-of-the art CAPEX data for water electrolysers, and their impact on renewable hydrogen price settings”.
Scaled-up electrolysers and automated production processes are leading to significant CAPEX reductions.
Figure 12. Future levelised cost of hydrogen production by operating hour for different electrolyser investment costs (left) and electricity costs (right)
|
|
Electricity price USD 40/MWh |
|
|
CAPEX USD 450/kWₑ |
|
|||||
2 |
10 |
|
|
|
|
|
10 |
|
|
|
|
USD/kgH |
8 |
|
|
|
|
USD 650/kWₑ |
8 |
|
|
|
|
|
|
|
|
|
|
|
|
|
|||
|
|
|
|
|
|
|
|
|
|
|
|
|
6 |
|
|
|
|
USD 550/kWₑ |
6 |
|
|
|
|
|
|
|
|
|
|
USD 450/kWₑ |
|
|
|
|
|
|
4 |
|
|
|
|
USD 350/kWₑ |
4 |
|
|
|
|
|
2 |
|
|
|
|
USD 250/kWₑ |
2 |
|
|
|
|
|
0 |
|
|
|
|
|
0 |
|
|
|
|
|
0 |
2 000 |
4 000 |
6 000 |
8 000 |
|
0 |
2 000 |
4 000 |
6 000 |
8 000 |
|
|
Full load hours |
|
|
|
Full load hours |
|
||||
Notes: MWh = megawatt hour. Based on an electrolyser efficiency of 69% (LHV) and a discount rate of 8%.
Source: IEA 2019. All rights reserved.
USD 100/MWh USD 80/MWh USD 60/MWh USD 40/MWh USD 20/MWh USD 0/MWh
With increasing full load hours, the impact of CAPEX on hydrogen costs declines and the electricity becomes the main cost component for water electrolysis.
PAGE | 47
IEA. All rights reserved.
The Future of Hydrogen |
Chapter 2: Producing hydrogen and hydrogen-based products |
As electrolyser operating hours increase, the impact of CAPEX costs on the levelised cost of hydrogen declines and the impact of electricity costs rises (Figure 12). Low-cost electricity available at a level to ensure the electrolyser can operate at relatively high full load hours is therefore essential for the production of low-cost hydrogen.10
In electricity systems with increasing shares of variable renewables, surplus electricity may be available at low cost. Producing hydrogen through electrolysis and storing the hydrogen for later use could be one way to take advantage of this surplus electricity, but if surplus electricity is only available on an occasional basis it is unlikely to make sense to rely on it to keep costs down. Running the electrolyser at high full load hours and paying for the additional electricity can actually be cheaper than just relying on surplus electricity with low full load hours.
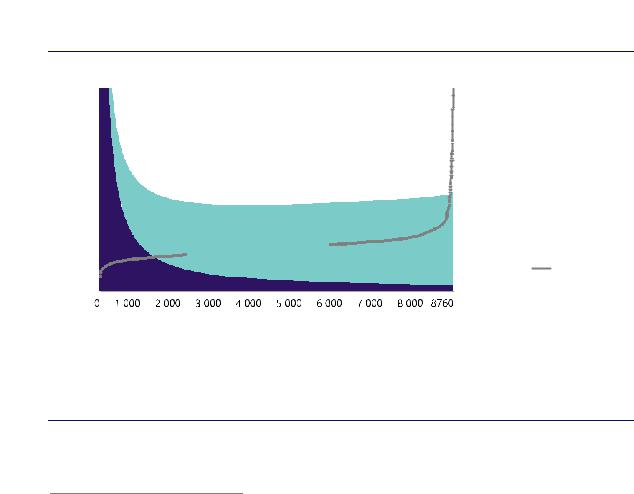
The relationship between electricity costs and operating hours becomes apparent when looking at electrolysers that use grid electricity for hydrogen production (Figure 13). Very low-cost electricity is generally available only for a very few hours within a year, which implies a low utilisation of the electrolyser and high hydrogen costs that reflect CAPEX costs. With increasing hours, electricity costs increase, but the higher utilisation of the electrolyser leads to a decline in the cost of producing a unit of hydrogen up to an optimum level at around 3 000–6 000 equivalent full load hours. Beyond that, higher electricity prices during peak hours lead to an
Figure
2 |
20 |
|
|
|
|
|
800 |
USD/MWh |
||
|
|
|
|
|
||||||
USD/kgH |
15 |
|
|
|
|
|
600 |
|||
|
|
|
|
|
|
|||||
|
|
|
|
|
|
|
|
|
||
|
|
|
|
|
|
|
|
Hydrogen costs from: |
||
|
|
|
|
Area of lowest |
|
|
|
|||
|
|
|
|
|
|
|
|
|
|
|
|
10 |
|
|
hydrogen costs |
|
|
400 |
|
|
Electricity use |
|
|
|
|
|
|
|
|
|||
|
|
|
|
|
|
|
|
|||
|
|
|
|
|
|
|
|
|||
|
5 |
|
|
|
|
|
200 |
|
|
CAPEX+OPEX |
|
|
|
|
|
|
|
|
|||
|
|
|
|
|
|
|
|
|||
|
|
|
|
|
|
|
|
|||
|
|
|
|
|
|
|
|
Electricity price |
||
|
|
|
|
|
|
|
|
|||
|
|
|
|
|
|
|
|
|
|
|
|
0 |
|
|
|
|
|
0 |
|
|
(right axis) |
|
|
|
Full load hours |
|
|
|
|
|||
|
|
|
|
|
|
|
|
|
||
Notes: |
|
|
|
|
|
|
|
|
||
Source: |
|
|
|
|
|
Trading Results 2018. |
||||
Higher utilisation |
|
reduce |
CAPEX, |
-connected electrolysers this |
||||||
means higher electricity prices; the lowest hydrogen costs are achieved in mid-load operation.
10 Full load hours are an indicator of the annual utilisation of an electrolyser. Full load hours represent the number of hours within a year the electrolyser would have to run at its design capacity, i.e. at “full load”, to achieve a certain annual output. Full load hours of 8 760 h represent the maximum possible utilisation, meaning that the electrolyser would be running for all hours within a year at its design capacity. From given full load hours and electrolyser capacity, the annual hydrogen production can be calculated (taking into account the conversion efficiency, as the electrolyser capacity is typically measured in electricity input terms).
PAGE | 48
IEA. All rights reserved.
The Future of Hydrogen |
Chapter 2: Producing hydrogen and hydrogen-based products |
Dedicated electricity generation from renewables or nuclear power offers an alternative to the use of grid electricity for hydrogen production. With declining costs for solar PV and wind generation, building electrolysers at locations with excellent renewable resource conditions could become a low-cost supply option for hydrogen, even after taking into account the transmission and distribution costs of transporting hydrogen from (often remote) renewables locations to the end users, as discussed in Chapter 3.
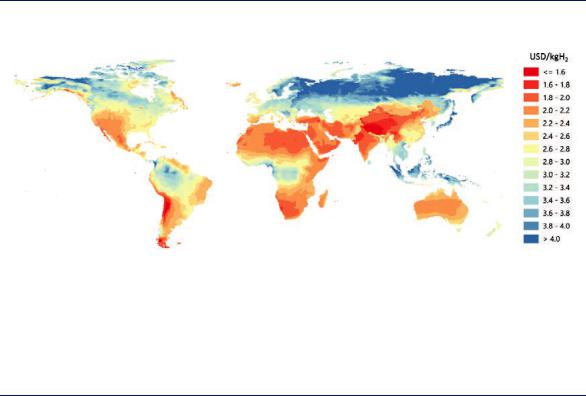
Promising areas exist, for example, in Patagonia, New Zealand, Northern Africa, the Middle East, Mongolia, most of Australia, and parts of China and the United States (Figure 14). The Asian Renewable Energy Hub project site in Western Australia aims to build 7.5 gigawatts (GW) of wind generation and 3.5 GW of solar generation, with around 8 GW of the generation being dedicated to hydrogen production for domestic use and for export (Asian Renewable Energy Hub, 2019). Several other projects to produce hydrogen from dedicated renewable resources in various parts of the world are in preparation or have been announced. In areas where both resources are excellent, combining solar PV and onshore wind in a hybrid plant has the potential to lower costs further.
Figure 14. Hydrogen costs from hybrid solar PV and onshore wind systems in the long term
Notes: This map is without prejudice to the status of or sovereignty over any territory, to the delimitation of international frontiers and boundaries and to the name of any territory, city or area. Electrolyser CAPEX = USD 450/kWe, efficiency (LHV) = 74%; solar PV CAPEX and onshore wind CAPEX = between USD 400–1 000/kW and USD 900–2 500/kW depending on the region; discount rate = 8%.
Source: IEA analysis based on wind data from Rife et al. (2014), NCAR Global Climate Four-Dimensional Data Assimilation (CFDDA) Hourly 40 km Reanalysis and solar data from renewables.ninja (2019).
The declining costs of solar PV and wind could make them a low-cost source for hydrogen production in regions with favourable resource conditions.
Hydrogen from coal
Hydrogen production from coal using gasification is a well-established technology, used for many decades by the chemical and fertiliser industries for the production of ammonia (especially in China). Globally around 130 coal gasification plants in operation, more than 80% of which are in China. Hydrogen production using coal produces CO2 emissions of about 19 tCO2/tH2, which is twice as much as natural gas.
PAGE | 49
IEA. All rights reserved.
The Future of Hydrogen |
Chapter 2: Producing hydrogen and hydrogen-based products |
Technology options
The high CO2 emissions intensity of coal-based hydrogen means that carbon capture technology will need to be used if hydrogen from coal is to have a future in a low-carbon energy system. The use of CCUS brings some challenges: coal produces hydrogen with a relatively low hydrogen-to-carbon ratio (hydrogen to carbon ratio 0f 0.1:1 from coal vs. 4:1 from methane) and brings with it a high level of impurities in the feedstock (sulphur, nitrogen and minerals) (Muradov, 2017).
The synthesis gas obtained from the gasification of coal could be used to fuel a combinedcycle power plant and – assuming the coal gasification plant was equipped with CCUS – the electricity it generated would count as low carbon. If an additional water-gas-shift (WGS) unit could be added, the synthesis gas could also be used to produce more hydrogen, allowing the coal gasification plant to shift between the production of electricity and hydrogen according to which is more profitable. Currently, however, there are no largescale commercial units producing both hydrogen and electricity.
The performance of individual CO2 capture technologies and methods for integrating them differ in terms of CO2 removal rate as well as hydrogen and CO2 purity levels. Hydrogen purity requirements vary strongly by end-use application. While most fuel cells require high purity levels, lower levels suffice for gas turbines, refinery processes and industrial boilers. Few technologies exist that produce both high-purity hydrogen and CO2 that is pure enough for other uses or storage, since gas separation technologies focus on either hydrogen removal or CO2 removal. The optimal combination of hydrogen production route and capture technology therefore depends on what the hydrogen is going to be used for, as well as on the production costs.
The vast majority of hydrogen production from coal currently takes place in China using coal gasification, mainly to produce ammonia. China is exploring the role of hydrogen in its economy, and using coal is currently the cheapest way of producing it, with costs amounting to RMB 0.6–0.7/m3 (about USD 1/kgH2). CHN Energy, China’s largest power company, is also the world's largest hydrogen production company. Its 80 coal gasifiers can produce around 8 MtH2/yr, which is equivalent to 12% of global dedicated hydrogen production today. Using coal with CCUS currently looks likely to be the lowest-cost way of producing cleaner hydrogen in China, but current technologies enable a CO2 intensity only as low as 2 kilograms of carbon dioxide per kilogram of hydrogen (kgCO2/kgH2) while advanced technologies may permit this to reach as low as 0.4 kgCO2/kgH2 (Figure 15).
In Australia the Hydrogen Energy Supply Chain (HESC) Latrobe Valley project is seeking to produce hydrogen from lignite using high-pressure partial oxidation. The related CarbonNet Carbon Capture and Storage Project presents a potential solution for mitigating CO2 separated from the hydrogen production process in the commercial phase. The hydrogen produced would be liquefied and exported to Japan. The first step is a one-year pilot project to treat 160 tonnes of lignite to produce 3 tH2.
Costs of hydrogen production from coal
CAPEX requirements account for around 50% of the cost of producing hydrogen from coal, and fuel accounts for a further 15–20% (Figure 15). The availability and cost of coal therefore plays an important role in determining the viability of coal-based hydrogen projects.
PAGE | 50
IEA. All rights reserved.