

29.9. P, I, AND D RESPONSES GRAPHED |
2303 |
29.8.3Derivative control mode (D)
Derivative – sometimes called rate or pre-act – is a control action causing the output signal to be o set by an amount proportional to the rate at which the input is changing. Derivative controller action responds to how quickly the input changes over time, biasing the output signal commensurate with that rate of input change. If proportional (P) action tells the output how far to move when an error appears, derivative (D) action tells the output how far to move when the input ramps. If proportional (P) action acts on the present and integral (I) action acts on the past, derivative (D) action acts on the future: it e ectively “anticipates” overshoot by tempering the output response according to how fast the process variable is rising or falling. When you think of “derivative action” (D), think discretion: this control action is cautious and prudent, working against change.
Mathematically defined, derivative action is the ratio of output o set to input velocity:
Derivative time constant (minutes) = τd = Output o set
Input velocity
Derivative time constant (minutes) = τd = ΔOutput
de dt
For example, if the PV signal begins to ramp at a rate of 5% per minute on a process controller with a derivative time constant of 4 minutes, the output will immediately become o set by 20% (ΔOutput = Derivative value × dedt ). In most PD and PID controllers, derivative response is also multiplied by proportional gain, so the same conditions applied to a PD controller that happened to also have a gain of 2 would result in an immediate o set of 40% (ΔOutput = Gain value × Derivative value × dedt ). The direction (sign) of this o set in relation to the direction of the input ramping depends on whether the controller is configured for direct or reverse action.
29.9P, I, and D responses graphed
A very helpful method for understanding the operation of proportional, integral, and derivative control terms is to analyze their respective responses to the same input conditions over time. This section is divided into subsections showing P, I, and D responses for several di erent input conditions, in the form of graphs. In each graph, the controller is assumed to be direct-acting (i.e. an increase in process variable results in an increase in output).
It should be noted that these graphic illustrations are all qualitative, not quantitative. There is too little information given in each case to plot exact responses. The illustrations of P, I, and D actions focus only on the shapes of the responses, not their exact numerical values.
In order to quantitatively predict PID controller responses, one would have to know the values of all PID settings, as well as the original starting value of the output before an input change occurred and a time index of when the change(s) occurred.
2304 |
CHAPTER 29. CLOSED-LOOP CONTROL |
29.9.1Responses to a single step-change
100 |
|
95 |
|
90 |
Derivative response |
85 |
|
80 |
|
75 |
|
70 |
Integral response |
65 |
|
60 |
|
55 |
|
% 50 |
|
45 |
Proportional response |
40 |
|
35 |
|
30 |
PV |
25 |
|
20 |
SP |
15 |
|
10 |
|
5 |
|
0 |
|
|
Time |
Proportional action directly mimics the shape of the input change (a step). Integral action ramps at a rate proportional to the magnitude of the input step. Since the input step holds a constant value, the integral action ramps at a constant rate (a constant slope). Derivative action interprets the step as an infinite rate of change, and so generates a “spike11” driving the output to saturation.
When combined into one PID output, the three actions produce this response:
100 |
|
95 |
|
90 |
|
85 |
|
80 |
|
75 |
|
70 |
|
65 |
|
60 |
PID response |
55 |
%50
45
40
35
30
25 |
|
PV |
|
|
|
|
|
20 |
|
|
|
|
SP |
||
15 |
|
|
|
10 |
|
|
|
|
|
||
5 |
|
|
|
|
|
||
0 |
|
|
|
|
|
|
|
Time 
11This is the meaning of the vertical-pointing arrowheads shown on the trend graph: momentary saturation of the output all the way up to 100%.
29.9. P, I, AND D RESPONSES GRAPHED |
2305 |
29.9.2Responses to a momentary step-and-return
100 |
|
|
95 |
|
|
90 |
Derivative response |
|
85 |
||
80 |
||
|
||
75 |
|
|
70 |
Integral response |
|
65 |
||
60 |
|
|
55 |
|
|
% 50 |
|
|
45 |
Proportional response |
|
40 |
||
35 |
||
|
||
30 |
PV |
|
25 |
||
20 |
||
SP |
||
15 |
||
10 |
|
|
5 |
|
|
0 |
|
Time 
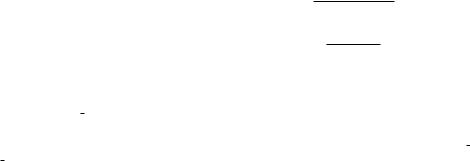
Proportional action directly mimics the shape of the input change (an up-and-down step). Integral action ramps at a rate proportional to the magnitude of the input step, for as long as the PV is unequal to the SP. Once PV = SP again, integral action stops ramping and simply holds the last value12. Derivative action interprets both steps as infinite rates of change, and so generates “spikes13” at the leading and at the trailing edges of the step. Note how the leading (rising) edge causes derivative action to saturate high, while the trailing (falling) edge causes it to saturate low.
12This is a good example of how integral controller action represents the history of the PV − SP error. The continued o set of integral action from its starting point “remembers” the area accumulated under the rectangular “step” between PV and SP. This o set will go away only if a negative error appears having the same percent-minute product (area) as the positive error step.
13This is the meaning of the vertical-pointing arrowheads shown on the trend graph: momentary saturation of the output all the way up to 100% (or down to 0%).
2306 |
CHAPTER 29. CLOSED-LOOP CONTROL |
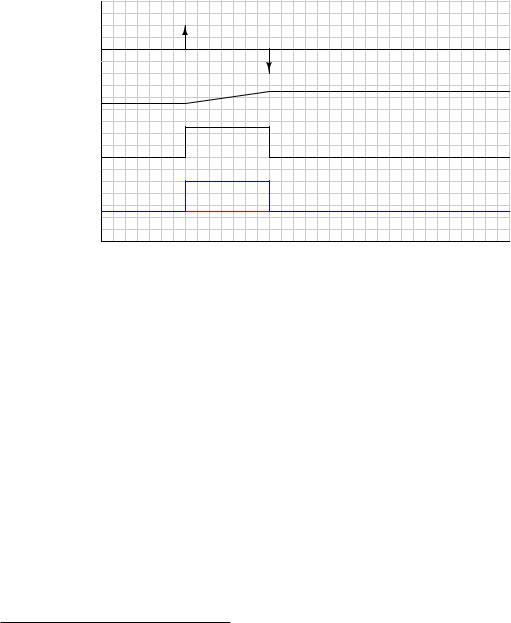
When combined into one PID output, the three actions produce this response:
100 |
|
|
95 |
|
|
90 |
|
|
85 |
|
|
80 |
PID response |
|
75 |
||
70 |
||
|
||
65 |
|
|
60 |
|
|
55 |
|
|
% 50 |
|
|
45 |
|
|
40 |
|
|
35 |
|
|
30 |
PV |
|
25 |
||
20 |
||
SP |
||
15 |
||
10 |
|
|
5 |
|
|
0 |
|
Time 
29.9. P, I, AND D RESPONSES GRAPHED |
2307 |
29.9.3Responses to two momentary steps-and-returns
100 |
|
|
95 |
|
|
90 |
Derivative response |
|
85 |
||
80 |
||
|
||
75 |
|
|
70 |
Integral response |
|
65 |
||
60 |
|
|
55 |
|
|
% 50 |
|
|
45 |
Proportional response |
|
40 |
||
35 |
||
|
||
30 |
|
|
25 |
PV |
|
20 |
||
15 |
SP |
|
10 |
|
|
5 |
|
|
0 |
|
Time 
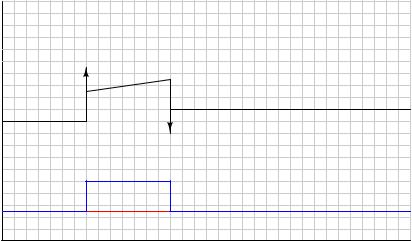
Proportional action directly mimics the shape of all input changes. Integral action ramps at a rate proportional to the magnitude of the input step, for as long as the PV is unequal to the SP. Once PV = SP again, integral action stops ramping and simply holds the last value. Derivative action interprets each step as an infinite rate of change, and so generates a “spike” at the leading and at the trailing edges of each step. Note how a leading (rising) edge causes derivative action to saturate high, while a trailing (falling) edge causes it to saturate low.
When combined into one PID output, the three actions produce this response:
100 |
|
95 |
|
90 |
|
85 |
|
80 |
|
75 |
PID response |
70 |
|
65 |
|
60 |
|
55 |
|
% 50 |
|
45 |
|
40 |
|
35 |
|
30 |
|
25 |
PV |
20 |
|
15 |
SP |
10 |
|
5 |
|
0 |
|
Time 

2308 |
CHAPTER 29. CLOSED-LOOP CONTROL |
29.9.4Responses to a ramp-and-hold
100 |
|
|
95 |
|
|
90 |
Derivative response |
|
85 |
||
80 |
||
|
||
75 |
|
|
70 |
Integral response |
|
65 |
||
60 |
|
|
55 |
|
|
% 50 |
|
|
45 |
Proportional response |
|
40 |
||
35 |
||
|
||
30 |
PV |
|
25 |
||
20 |
||
SP |
||
15 |
||
10 |
|
|
5 |
|
|
0 |
|
Time 
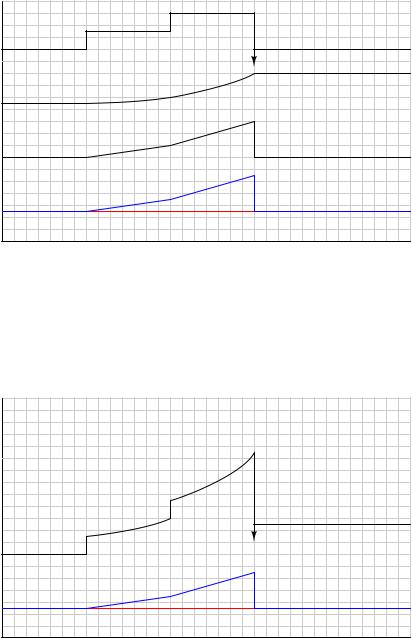
Proportional action directly mimics the ramp-and-hold shape of the input. Integral action ramps slowly at first (when the error is small) but increases ramping rate as error increases. When error stabilizes, integral rate likewise stabilizes. Derivative action o sets the output according to the input’s ramping rate.
When combined into one PID output, the three actions produce this response:
100 |
|
|
95 |
|
|
90 |
|
|
85 |
|
|
80 |
|
|
75 |
|
|
70 |
|
|
65 |
|
|
60 |
PID response |
|
55 |
||
% 50 |
|
|
45 |
|
|
40 |
|
|
35 |
|
|
30 |
PV |
|
25 |
||
20 |
||
SP |
||
15 |
||
10 |
|
|
5 |
|
|
0 |
|
Time 
29.9. P, I, AND D RESPONSES GRAPHED |
2309 |
29.9.5Responses to an up-and-down ramp
100 |
|
|
95 |
|
|
90 |
Derivative response |
|
85 |
||
80 |
||
|
||
75 |
|
|
70 |
Integral response |
|
65 |
||
60 |
||
|
||
55 |
|
|
% 50 |
|
|
45 |
Proportional response |
|
40 |
||
35 |
||
|
||
30 |
PV |
|
25 |
||
20 |
||
SP |
||
15 |
||
10 |
|
|
5 |
|
|
0 |
|
Time 
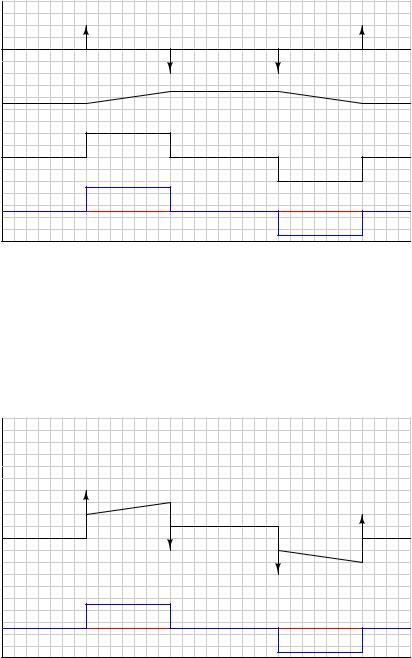
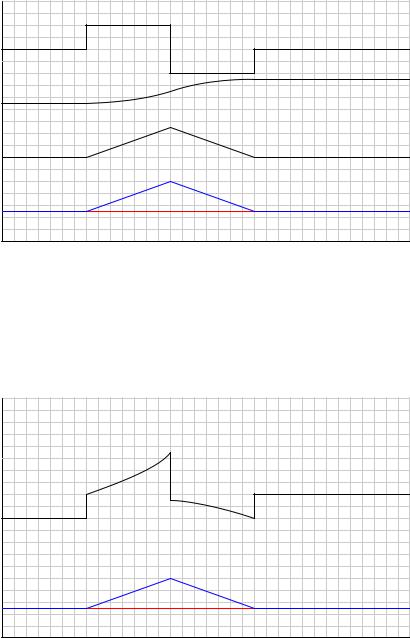
Proportional action directly mimics the up-and-down ramp shape of the input. Integral action ramps slowly at first (when the error is small) but increases ramping rate as error increases, then ramps slower as error decreases back to zero. Once PV = SP again, integral action stops ramping and simply holds the last value. Derivative action o sets the output according to the input’s ramping rate: first positive then negative.
When combined into one PID output, the three actions produce this response:
100 |
|
|
95 |
|
|
90 |
|
|
85 |
|
|
80 |
|
|
75 |
|
|
70 |
|
|
65 |
|
|
60 |
|
|
55 |
PID response |
|
% 50 |
||
45 |
|
|
40 |
|
|
35 |
|
|
30 |
PV |
|
25 |
||
20 |
||
SP |
||
15 |
||
10 |
|
|
5 |
|
|
0 |
|
Time 
2310 |
CHAPTER 29. CLOSED-LOOP CONTROL |
29.9.6Responses to a multi-slope ramp
100 |
|
|
95 |
|
|
90 |
|
|
85 |
Derivative response |
|
80 |
||
75 |
|
|
70 |
Integral response |
|
65 |
||
60 |
||
|
||
55 |
|
|
% 50 |
|
|
45 |
Proportional response |
|
40 |
||
35 |
||
|
||
30 |
|
|
25 |
PV |
|
20 |
||
15 |
SP |
|
10 |
|
|
5 |
|
|
0 |
|
Time 
Proportional action directly mimics the ramp shape of the input. Integral action ramps slowly at first (when the error is small) but increases ramping rate as error increases, then accelerates its increase as the PV ramps even steeper. Once PV = SP again, integral action stops ramping and simply holds the last value. Derivative action o sets the output according to the input’s ramping rate: first positive, then more positive, then it spikes negative when the PV suddenly returns to SP.
When combined into one PID output, the three actions produce this response:
100 |
|
95 |
|
90 |
|
85 |
|
80 |
|
75 |
|
70 |
PID response |
65 |
|
60 |
|
55 |
|
% 50 |
|
45 |
|
40 |
|
35 |
|
30 |
|
25 |
PV |
20 |
|
15 |
SP |
10 |
|
5 |
|
0 |
|
Time 