

FRONT PIECE

David j. Buckley Corporate gis Solutions Manager Pacific Meridian Resources, Inc.
![]()
The GIS Primer provides an overview of issues and requirements for implementing and applying geographic information systems technology.
This primer focuses on practical issues concerned with the responsible implementation and application of GIS technology. The primer is directed for those with limited exposure to GIS. It is intended purely as in introductory text with an emphasis on identifying and clearly illustrating fundamental concepts in GIS applications.
PREFACE
This workbook is a result of several years experience in applying geographic information systems (GIS) technology to typical forestry, natural resource management, and environmental problems. Many of the terms and concepts introduced in this book have been compiled from a variety of different sources. These include some of the prevalent text books in the field, but most have been firmly implanted from practical experience. GIS is in essence, an applied science. The more hands-on you have the more entrenched the methodologies and techniques become for effectively applying the technology.
The sample applications presented in the GIS Primer have been compiled from my experiences representing real operational requirements of selected IGIS clients, past and present. These sources include provincial and federal natural resource agencies in Canada and the United States, and private forestry companies across North America. The models and/or formulas used in the sample applications have been simplified in an effort to focus on procedures and techniques for applying GIS. The sample applications are presented to provide simple operational examples of fundamental GIS analysis techniques.
Annual updates are undertaken to this book to reflect the dynamic nature of the commercial GIS marketplace, and to reflect my understanding of what GIS really is. The ever increasing rate of technological change prompts me to update the Primer to reflect the new and exciting capabilities that GIS technology provides. For the novice reader, don’t be overwhelmed with this change. GIS has changed so drastically since this book was originally written in 1988; but in so many ways remains the same. Changing technology has provided many more capabilities and possibilities, often beyond the comprehension of the average user. Nonetheless, ultimately the tool is only as good as the craftsman using it. Consistently it is the imagination and creativity of the domain specialist using GIS that makes GIS work, not the new technological capabilities or increased performance. I believe that while the GIS vendor community, hardware and software vendors alike, provide us with newer, better and faster technological tools, it is in the end, the domain specialists applying the tool that define state-of-the-art. The heartbeat of GIS still lies in the field and district offices, the logging divisions, the engineering offices, and with the small GIS entrepreneurs in offices everywhere.
Many thanks to my colleagues, past and present, who have supported me and worked with me over the years. This workbook reflects our collective experiences and knowledge. A special thanks to my partners at IGIS who share a common vision of the role of GIS in today’s society. And lastly, to Joe Berry, my GIS partner in crime, who continues to amaze me with his insight and genuine love for all things GISsy. Many of the figures and diagrams in the Primer are graciously provided by Joe from his gCON Software set. Many thanks for all your support.
The GIS Primer is provided by Innovative GIS Solutions, Inc. as the workbook and reference document for all our introductory GIS education workshops. If you’d like more copies please give us a call.
David J. Buckley
Fort Collins, Colorado
February 1997
e-mail: dbuckley@ pacificmeridian.com

PURPOSE
The purpose of this book is to provide an overview of the issues and requirements for implementing and applying geographic information systems technology.
The book is intended to provide resource specialists and managers with an exposure to GIS technology and terminology, so that papers, applications, and exhibits on GIS will be more understandable and useful in the future. This book presents a substantial amount of GIS theory, and a whole bunch of buzzwords, but is also supplemented with relevant forestry based applications to illustrate the concepts and techniques for applying GIS technology.
The focus of this book is on practical issues concerned with the implementation and application of GIS technology. This book is directed at the resource specialist and/or manager who has had limited exposure to GIS. It is intended purely as an introductory text with an emphasis on identifying and clearly illustrating primitive concepts in geographic information system applications.
Hopefully, with this approach in mind the confusion and mystique that often surrounds GIS can be clarified, resulting in an understandable framework for the successful evaluation, implementation, and application of GIS technology.
This book is based purely on practical experience of the author and in no way should be construed as a comprehensive statement on GIS. References are provided at the back of the book for further reading and detail.
Important points or quotes are identified throughout the book by bold text. Italics are used throughout the text to identify technical terms that imply something other that their conventional meaning.
Any comments or suggestions on the content or format of this book are welcome. Please send any comments to "buck@innovativegis.com".
Enjoy !

ABOUT THE AUTHOR
Biographical Sketch
David J. Buckley
Corporate GIS Solutions Manager Pacific Meridian Resources, Inc.
David Buckley is the Corporate GIS Soluions Manager for Pacific Meridian Resources, Inc. (PMR), a firm dedicated to providing responsible GIS implementation and application solutions for a wide range of land related management disciplines.
Mr. Buckley is considered a leading GIS implementation and application consultant throughout North America consulting to government agencies, hardware vendors, software vendors, and private industry. Mr. Buckley is well versed in the issues critical to proper GIS implementation and responsible application development. His senior consulting experience provides the necessary background and ability to understand and act upon the business requirements of an organization, and to place information systems and resources in their appropriate context with respect to the goals and objectives of those organizations. Specifically, Mr. Buckley has several years experience applying GIS technology to operational forest management issues and problems within government and the private sector in Canada and the United States.
Mr. Buckley has managed and participated in projects that focus on integrating custom modeling domain requirements utilizing GIS technologies. Specific examples include integrated resource planning, forest inventory management, forest fire modeling, environmental impact assessments, ecosystem simulation modeling, atmospheric dispersion modeling, among others. In his role as the principal GIS consultant at IGIS he has developed significant expertise focused on the integration and application of commercial GIS software platforms into operational working environments.
Mr. Buckley has also conducted numerous workshops and seminars on GIS technology for both public and private sector audiences. This has included the publication of an introduction to GIS book entitled The GIS Primer. Mr. Buckley is a frequent presenter at GIS conferences and symposiums throughout North America. He has numerous publications in industry journals focusing on the successful and cost effective application of GIS technologies.
David J. Buckley, E-mail: dbuckley@pacificmeridian.com
|
Pacific Meridian Solutions, Inc.
|
Suite 300, 2000 South College Ave.
|
|
Fort Collins, CO 80525 |
Telephone: (970) 490 – 5900 |
|
|
FAX : (970) 490 - 2300 |
|
|
Web Site: www.innovativegis.com |
CHAPTER 1: THE NATURE OF GEOGRAPHIC INFORMATION
This chapter reviews the basic fundamentals of geographic data and information. The focus is on understanding the basic structure of geographic data, and how issues of accuracy, error, and quality are paramount to properly using GIS technology. The establishment of a robust database is the cornerstone of a successful GIS.
|
|
Maps and Spatial Information |
|
|
Characterizing Geographic Features |
|
|
Spatial Data Accuracy and Quality |
MAPS AND SPATIAL INFORMATION
The main method of identifying and representing the location of geographic features on the landscape is a map. A map is a graphic representation of where features are, explicitly and relative to one another. A map is composed of different geographic features represented as either points, lines, and/or areas. Each feature is defined both by its location in space (with reference to a coordinate system), and by its characteristics (typically referred to as attributes). Quite simply, a map is a model of the real world.
The map legend is the key linking the attributes to the geographic features. Attributes, e.g. such as the species for a forest stand, are typically represented graphically by use of different symbology and/or color. For GIS, attributes need to be coded in a form in which they can be used for data analysis (Burrough, 1986). This implies loading the attribute data into a database system and linking it to the graphic features.
Maps are simply models of the real world. They represent snapshots of the land at a specific map scale. The map legend is the key identifying which features are represented on a map.
For geographic data, often referred to as spatial data, features are usually referenced in a coordinate system that models a location on the earth's surface. The coordinate system may be of a variety of types. For natural resource applications the most common are:
|
|
geographic coordinates such as latitude and longitude, e.g. 56°27'40" and 116°11'25". These are usually referred by degrees, minutes, and seconds. Geographic coordinates can also be identified as decimal degrees, e.g. 54.65°. |
|
|
a map projection, e.g. Universe Transverse Mercator (UTM) where coordinates are measured in metres, e.g. 545,000.000 and 6,453,254.000 normally reference to a central meridian. Eastings refer to X coordinates while Northings refer to Y coordinates. |
|
|
a legal survey description, e.g. Meridian, Township, Range such as the Alberta Township System, e.g. Township 075 Range 10 West of 4th Meridian. |
Geographic data is distinguished from attribute data in that it is referenced spatially by a coordinate system, e.g. it has a spatial extent. Natural resource applications commonly use a Legal Survey system, e.g. the Alberta Township System (ATS), which identifies feature's locations as being a Meridian, Township, and a Range; or a projection such as the UTM coordinate system which identifies features by an Easting coordinate (X) and a Northing coordinate (Y) in a particular UTM zone.
In the UTM projection the area of the earth between 80 degrees North and 80 degrees South latitude is divided into north-south columns 6 degrees of longitude wide called zones. These are numbered 1 to 60 eastward beginning at the 180th meridian. Within each zone the central meridian is given an Easting value of 500,000 metres. The equator is designated as having a Northing value of 0 for northern hemisphere coordinates. Coordinates are recorded relative to the central meridian in metres in a particular zone. The basis of the UTM projection defines that the coordinates are duplicated within each UTM zone. Accordingly, use of the UTM projection is only appropriate for certain spatial extents and scales of data. It is not appropriate to use this projection if your area of interest crosses UTM zone boundaries.
For example, the province of Alberta is located in UTM zones 11 and 12. The central meridian for zone 11 is 117° longitude. The central meridian for zone 12 is 111° longitude. The UTM coordinate system is the most widely used projection in the mapping industry and consequently is becoming an de facto standard for use with geographic information systems. This is particularly true for regional data in Canada. The State Plane coordinate system is widely used in the United States.
Maps are the traditional method of storing and displaying geographic information.
A map portrays 3 kinds of information about geographic features. The:
|
|
Location and extent of the feature |
|
|
Attributes (characteristics) of the feature |
|
|
Relationship of the feature to other features. |
Geography has often been described as the study of why what is where. This description is quite appropriate when considering the three kinds of information that are portrayed by the traditional map;
|
|
the location and extent of a feature is identified explicitly by reference to a coordinate system representing the earth's surface. This is where a feature is. |
|
|
the attributes of a feature describe or characterize the feature. This is what the feature is. |
|
|
The relationship of a feature to other features is implied from the location and attributes of all features. Relationships can be defined explicitly, e.g. roads connecting towns, regions adjacent to one another, or implicitly, e.g. close to, far from, similar to, etc. Implicit relationships are interpreted according to the knowledge that we have about the natural world. Relationships are described as how or why a feature is. |
The geographic information system distinguishes between the spatial and attribute aspect of geographic features.
The identification of relationships between features, within a common theme or across different themes, is the primary function of a GIS.
CHARACTERIZING GEOGRAPHIC FEATURES
All geographic features on the earth's surface can be characterized and defined as one of three basic feature types. These are points, lines, and areas.
|
|
Point data exists when a feature is associated with a single location in space. Examples of point features include a fire lookout tower, an oil well or gas activity site, and a weather station. |
|
|
Linear data exists when a feature's location is described by a string of spatial coordinates. Examples of linear data include rivers, roads, pipelines, etc. |
|
|
Areal data exists when a feature is described by a closed string of spatial coordinates. An area feature is commonly referred to as a polygon. Polygonal data is the most common type of data in natural resource applications. Examples of polygonal data include forest stands, soil classification areas, administrative boundaries, and climate zones. Most polygon data is considered to be homogeneous in nature and thus is consistent throughout. |
Every geograpic phenomenon can in principle be represented by either a point, line, and/or an area.
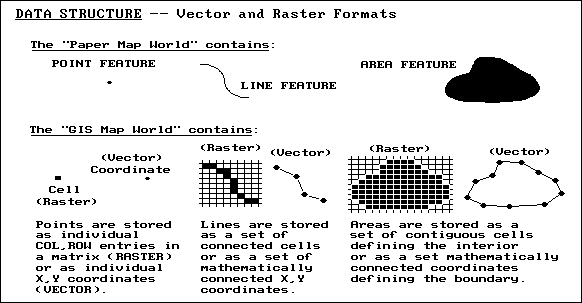
GIS Data Structures illustrating the difference between Vector and Raster formats (Adapted from Berry)
Commonly, an identifier accompanies all types of geographic features. This description or identifier is referred to as a label. Labels distinguish geographic features of the same type, e.g. forest stands, from one another. Labels can be in the form of a name, e.g. "Lake Louise", a description, e.g. "WELL" or a unique number, e.g. "123". Forest stand numbers are examples of polygon labels. Each label is unique and provides the mechanism for linking the feature to a set of descriptive characteristics, referred to as attribute data.
It is important to note that geographic features and the symbology used to represent them, e.g. point, line, or polygon, are dependant on the graphic scale (map scale) of the data. Some features can be represented by point symbology at a small scale, e.g. villages on a 1:1,000,000 map, and by areal symbology at a larger scale, e.g. villages on a 1:10 ,000 map. Accordingly, the accuracy of the feature's location is often fuzzier at a smaller scale than a larger scale. The generalization of features is an inherent characteristic of data presented at a smaller scale.
Data can always be generalized to a smaller scale, but detail CANNOT be created !
Remember, as the scale of a map increases, e.g. 1:15,000 to 1:100,000, the relative size of the features decrease and the following may occur:
|
|
Some features may disappear, e.g. features such as ponds, hamlets, and lakes, become indistinguishable as a feature and are eliminated.; |
|
|
Features change from areas to lines or to points, e.g. a village or town represented by a polygon at 1:15,000 may change to point symbology at a 1:100,000 scale.; |
|
|
Features change in shape, e.g. boundaries become less detailed and more generalized.; and |
|
|
Some features may appear, e.g. features such as climate zones may be indistinguishable at a large scale (1:15,000) but the full extent of the zone becomes evident at a smaller scale (1:1,000,000). |
Accordingly, the use of data from vastly different scales will result in many inconsistencies between the number of features and their type.
The use and comparison of geographic data from vastly different source scales is totally inappropriate and can lead to significant error in geographic data processing.

DATA ACCURACY AND QUALITY
The quality of data sources for GIS processing is becoming an ever increasing concern among GIS application specialists. With the influx of GIS software on the commercial market and the accelerating application of GIS technology to problem solving and decision making roles, the quality and reliability of GIS products is coming under closer scrutiny. Much concern has been raised as to the relative error that may be inherent in GIS processing methodologies. While research is ongoing, and no finite standards have yet been adopted in the commercial GIS marketplace, several practical recommendations have been identified which help to locate possible error sources, and define the quality of data. The following review of data quality focuses on three distinct components, data accuracy, quality, and error.
Accuracy
The fundamental issue with respect to data is accuracy. Accuracy is the closeness of results of observations to the true values or values accepted as being true. This implies that observations of most spatial phenomena are usually only considered to estimates of the true value. The difference between observed and true (or accepted as being true) values indicates the accuracy of the observations.
Basically two types of accuracy exist. These are positional and attribute accuracy. Positional accuracy is the expected deviance in the geographic location of an object from its true ground position. This is what we commonly think of when the term accuracy is discussed. There are two components to positional accuracy. These are relative and absolute accuracy. Absolute accuracy concerns the accuracy of data elements with respect to a coordinate scheme, e.g. UTM. Relative accuracy concerns the positioning of map features relative to one another.
Often relative accuracy is of greater concern than absolute accuracy. For example, most GIS users can live with the fact that their survey township coordinates do not coincide exactly with the survey fabric, however, the absence of one or two parcels from a tax map can have immediate and costly consequences.
Attribute accuracy is equally as important as positional accuracy. It also reflects estimates of the truth. Interpreting and depicting boundaries and characteristics for forest stands or soil polygons can be exceedingly difficult and subjective. Most resource specialists will attest to this fact. Accordingly, the degree of homogeneity found within such mapped boundaries is not nearly as high in reality as it would appear to be on most maps.
Quality
Quality can simply be defined as the fitness for use for a specific data set. Data that is appropriate for use with one application may not be fit for use with another. It is fully dependant on the scale, accuracy, and extent of the data set, as well as the quality of other data sets to be used. The recent U.S. Spatial Data Transfer Standard (SDTS) identifies five components to data quality definitions. These are :
|
|
Lineage |
|
|
Positional Accuracy |
|
|
Attribute Accuracy |
|
|
Logical Consistency |
|
|
Completeness |
Lineage
The lineage of data is concerned with historical and compilation aspects of the data such as the:
|
|
|
|
|
source of the data; |
|
|
content of the data; |
|
|
data capture specifications; |
|
|
geographic coverage of the data; |
|
|
compilation method of the data, e.g. digitizing versus scanned; |
|
|
ransformation methods applied to the data; and |
|
|
the use of an pertinent algorithms during compilation, e.g. linear simplification, feature generalization. |
Positional Accuracy
The identification of positional accuracy is important. This includes consideration of inherent error (source error) and operational error (introduced error). A more detailed review is provided in the next section.
Attribute Accuracy
Consideration of the accuracy of attributes also helps to define the quality of the data. This quality component concerns the identification of the reliability, or level of purity (homogeneity), in a data set.
Logical Consistency
This component is concerned with determining the faithfulness of the data structure for a data set. This typically involves spatial data inconsistencies such as incorrect line intersections, duplicate lines or boundaries, or gaps in lines. These are referred to as spatial or topological errors.
Completeness
The final quality component involves a statement about the completeness of the data set. This includes consideration of holes in the data, unclassified areas, and any compilation procedures that may have caused data to be eliminated.
The ease with which geographic data in a GIS can be used at any scale highlights the importance of detailed data quality information. Although a data set may not have a specific scale once it is loaded into the GIS database, it was produced with levels of accuracy and resolution that make it appropriate for use only at certain scales, and in combination with data of similar scales.
Error
Two sources of error, inherent and operational, contribute to the reduction in quality of the products that are generated by geographic information systems. Inherent error is the error present in source documents and data. Operational error is the amount of error produced through the data capture and manipulation functions of a GIS. Possible sources of operational errors include:
|
|
Mis-labelling of areas on thematic maps; |
|
|
misplacement of horizontal (positional) boundaries; |
|
|
human error in digitizing |
|
|
classification error;. |
|
|
GIS algorithm inaccuracies; and |
|
|
human bias. |
While error will always exist in any scientific process, the aim within GIS processing should be to identify existing error in data sources and minimize the amount of error added during processing. Because of cost constraints it is often more appropriate to manage error than attempt to eliminate it. There is a trade-off between reducing the level of error in a data base and the cost to create and maintain the database.
An awareness of the error status of different data sets will allow user to make a subjective statement on the quality and reliability of a product derived from GIS processing.
The validity of any decisions based on a GIS product is directly related to the quality and reliability rating of the product.
Depending upon the level of error inherent in the source data, and the error operationally produced through data capture and manipulation, GIS products may possess significant amounts of error.
One of the major problems currently existing within GIS is the aura of accuracy surrounding digital geographic data. Often hardcopy map sources include a map reliability rating or confidence rating in the map legend. This rating helps the user in determining the fitness for use for the map. However, rarely is this information encoded in the digital conversion process.
Often because GIS data is in digital form and can be represented with a high precision it is considered to be totally accurate. In reality, a buffer exists around each feature which represents the actual positional location of the feature. For example, data captured at the 1:20,000 scale commonly has a positional accuracy of +/- 20 metres. This means the actual location of features may vary 20 metres in either direction from the identified position of the feature on the map. Considering that the use of GIS commonly involves the integration of several data sets, usually at different scales and quality, one can easily see how errors can be propagated during processing.
Example of areas of uncertainty for overlaying data
Several comments and guidelines on the recognition and assessment of error in GIS processing have been promoted in papers on the subject. These are summarized below:
|
|
There is a need for developing error statements for data contained within geographic information systems (Vitek et al, 1984). |
|
|
The integration of data from different sources and in different original formats (e.g. points, lines, and areas), at different original scales, and possessing inherent errors can yield a product of questionable accuracy (Vitek et al, 1984). |
|
|
The accuracy of a GIS-derived product is dependent on characteristics inherent in the source products, and on user requirements, such as scale of the desired output products and the method and resolution of data encoding (Marble, Peuquet, 1983). |
|
|
The highest accuracy of any GIS output product can only be as accurate as the least accurate data theme of information involved in the analysis (Newcomer, Szajgin, 1984). |
|
|
Accuracy of the data decreases as spatial resolution becomes more coarse (Walsh et al, 1987). ; and |
|
|
As the number of layers in an analysis increases, the number of possible opportunities for error increases (Newcomer, Szajgin, 1984). |
CHAPTER 2: THE NATURE OF GEOGRAPHIC INFORMATION
This chapter reviews the structural components and design of GIS data models. The focus is on reviewing spatial and attribute data models, and how data is encoded by the GIS software. This chapter describes GIS technical components and will be of most interest to technical staff and GIS operators.
|
|
What is a GIS ? |
|
|
Components of a GIS |
|
|
GIS Data Models |
|
|
Spatial Data Relationships |
WHAT IS A GIS ?
A geographic information system (GIS) is a computer-based tool for mapping and analyzing geographic phenomenon that exist, and events that occur, on Earth. GIS technology integrates common database operations such as query and statistical analysis with the unique visualization and geographic analysis benefits offered by maps. These abilities distinguish GIS from other information systems and make it valuable to a wide range of public and private enterprises for explaining events, predicting outcomes, and planning strategies. Map making and geographic analysis are not new, but a GIS performs these tasks faster and with more sophistication than do traditional manual methods.
Today, GIS is a multi-billion-dollar industry employing hundreds of thousands of people worldwide. GIS is taught in schools, colleges, and universities throughout the world. Professionals and domain specialists in every discipline are become increasingly aware of the advantages of using GIS technology for addressing their unique spatial problems.
We commonly think of a GIS as a single, well-defined, integrated computer system. However, this is not always the case. A GIS can be made up of a variety of software and hardware tools. The important factor is the level of integration of these tools to provide a smoothly operating, fully functional geographic data processing environment.
Overall, GIS should be viewed as a technology, not simply as a computer system.
In general, a GIS provides facilities for data capture, data management, data manipulation and analysis, and the presentation of results in both graphic and report form, with a particular emphasis upon preserving and utilizing inherent characteristics of spatial data.
The ability to incorporate spatial data, manage it, analyze it, and answer spatial questions is the distinctive characteristic of geographic information systems.
A geographic information system, commonly referred to as a GIS, is an integrated set of hardware and software tools used for the manipulation and management of digital spatial (geographic) and related attribute data.
GIS SUBSYSTEMS
A GIS has four main functional subsystems. These are:
|
|
a data input subsystem; |
|
|
a data storage and retrieval subsystem; |
|
|
a data manipulation and analysis subsystem; and |
|
|
a data output and display subsystem. |
Data Input
A data input subsystem allows the user to capture, collect, and transform spatial and thematic data into digital form. The data inputs are usually derived from a combination of hard copy maps, aerial photographs, remotely sensed images, reports, survey documents, etc.
Data Storage and Retrieval
The data storage and retrieval subsystem organizes the data, spatial and attribute, in a form which permits it to be quickly retrieved by the user for analysis, and permits rapid and accurate updates to be made to the database. This component usually involves use of a database management system (DBMS) for maintaining attribute data. Spatial data is usually encoded and maintained in a proprietary file format.
Data Manipulation and Analysis
The data manipulation and analysis subsystem allows the user to define and execute spatial and attribute procedures to generate derived information. This subsystem is commonly thought of as the heart of a GIS, and usually distinguishes it from other database information systems and computer-aided drafting (CAD) systems.
Data Output
The data output subsystem allows the user to generate graphic displays, normally maps, and tabular reports representing derived information products.
The critical function for a GIS is, by design, the analysis of spatial data.
It is important to understand that the GIS is not a new invention. In fact, geographic information processing has a rich history in a variety of disciplines. In particular, natural resource specialists and environmental scientists have been actively processing geographic data and promoting their techniques since the 1960's.
Today's generic, geographic information system, is distinguished from the geo-processing of the past by the use of computer automation to integrate geographic data processing tools in a friendly and comprehensive environment.
The advent of sophisticated computer techniques has proliferated the multi-disciplinary application of geo-processing methodologies, and provided data integration capabilities that were logistically impossible before.
COMPONENTS OF A GIS
An operational GIS also has a series of components that combine to make the system work. These components are critical to a successful GIS.
|
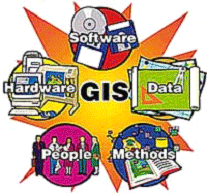
A working GIS integrates five key components:
|
HARDWARE, SOFTWARE, DATA, PEOPLE, METHODS
|
Hardware
Hardware is the computer system on which a GIS operates. Today, GIS software runs on a wide range of hardware types, from centralized computer servers to desktop computers used in stand-alone or networked configurations.
Software
GIS software provides the functions and tools needed to store, analyze, and display geographic information. A review of the key GIS software subsystems is provided above.
Data
Perhaps the most important component of a GIS is the data. Geographic data and related tabular data can be collected in-house, compiled to custom specifications and requirements, or occasionally purchased from a commercial data provider. A GIS can integrate spatial data with other existing data resources, often stored in a corporate DBMS. The integration of spatial data (often proprietary to the GIS software), and tabular data stored in a DBMS is a key functionality afforded by GIS.
People
GIS technology is of limited value without the people who manage the system and develop plans for applying it to real world problems. GIS users range from technical specialists who design and maintain the system to those who use it to help them perform their everyday work. The identification of GIS specialists versus end users is often critical to the proper implementation of GIS technology.
Methods
A successful GIS operates according to a well-designed implementation plan and business rules, which are the models and operating practices unique to each organization.
As in all organizations dealing with sophisticated technology, new tools can only be used effectively if they are properly integrated into the entire business strategy and operation. To do this properly requires not only the necessary investments in hardware and software, but also in the retraining and/or hiring of personnel to utilize the new technology in the proper organizational context. Failure to implement your GIS without regard for a proper organizational commitment will result in an unsuccessful system ! Many of the issues concerned with organizational commitment are described in Implementation Issues and Strategies.
It is simply not sufficient for an organization to purchase a computer with some GIS software, hire some enthusiastic individuals and expect instant success.
GIS DATA MODELS
A GIS stores information about the world as a collection of thematic layers that can be linked together by geography. This simple but extremely powerful and versatile concept has proven invaluable for solving many real-world problems from tracking delivery vehicles, to recording details of planning applications, to modeling global atmospheric circulation. The thematic layer approach allows us to organize the complexity of the real world into a simple representation to help facilitate our understanding of natural relationships.
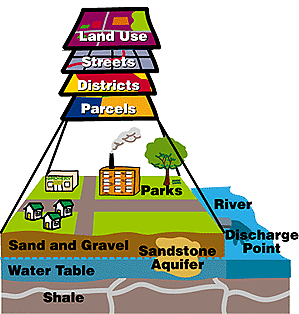
The thematic layer approach allows us to organize the complexity of the real world
GIS DATA TYPES
The basic data type in a GIS reflects traditional data found on a map. Accordingly, GIS technology utilizes two basic types of data. These are:
|
|
Spatial data |
describes the absolute and relative location of geographic features.
|
|
|
Attribute data |
describes characteristics of the spatial features. These characteristics can be quantitative and/or qualitative in nature. Attribute data is often referred to as tabular data. |
The coordinate location of a forestry stand would be spatial data, while the characteristics of that forestry stand, e.g. cover group, dominant species, crown closure, height, etc., would be attribute data. Other data types, in particular image and multimedia data, are becoming more prevalent with changing technology. Depending on the specific content of the data, image data may be considered either spatial, e.g. photographs, animation, movies, etc., or attribute, e.g. sound, descriptions, narration’s, etc.
SPATIAL DATA MODELS
Traditionally spatial data has been stored and presented in the form of a map. Three basic types of spatial data models have evolved for storing geographic data digitally. These are referred to as:
|
|
Vector; |
|
|
Raster; |
|
|
Image. |
The following diagram reflects the two primary spatial data encoding techniques. These are vector and raster. Image data utilizes techniques very similar to raster data, however typically lacks the internal formats required for analysis and modeling of the data. Images reflect pictures or photographs of the landscape.
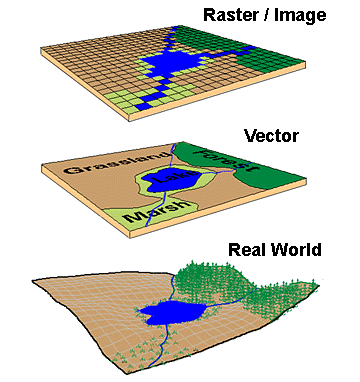
Representation of the real world and showing differences in how a vector and a raster GIS will represent this real world.