

01 POWER ISLAND / 02 H2+NH3 / (BNEF) 2022 Japans-Costly-Ammonia-Coal-Co-Firing-Strategy
.pdfJapan’s Costly Ammonia Coal Co-Firing Strategy
September 28, 2022
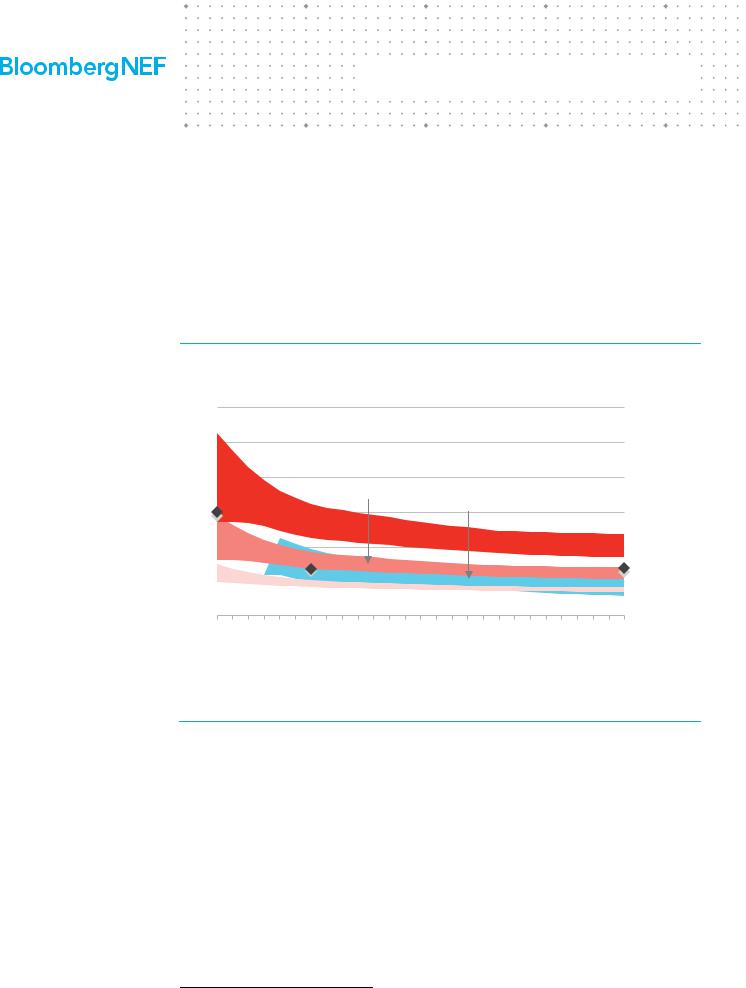
Figure 7: Comparison of levelized cost of electricity in 2024
2024
$/MWh (2021 real) |
|
|
|
|
526 |
Green ammonia |
|||||||
|
|
|
|
from Japan |
|||||||||
|
|
|
|
|
|
|
|
|
|
|
|||
|
|
|
|
|
|
|
|
|
|
|
|
||
|
|
|
310 |
|
|
|
|
|
|
324 |
Green ammonia |
||
|
|
|
|
|
|
290 |
|
from Australia |
|||||
272 |
|
|
|
|
|
|
|
|
|||||
|
|
|
|
|
|
|
|
|
|
Blue ammonia |
|||
|
|
|
|
|
|
|
|
|
|
|
|
||
|
|
|
|
|
|
|
|
|
|
|
269 |
||
|
|
|
|
|
|
|
|
|
189 |
|
from the Middle East |
||
|
182 |
|
|
188 |
|
|
148 |
|
|
|
|||
|
|
|
|
|
|
|
|
|
|
|
|||
|
|
|
|
|
|
|
|
162 |
|
|
|
|
|
135 |
|
128 |
|
|
108 |
|
|
|
|
||||
|
|
|
97 |
|
|
|
|
|
|
||||
|
|
|
|
|
|
|
|
|
|
|
|
|
|
|
|
|
|
|
|
||||||||
Onshore wind |
Solar + battery |
80% coal - 20%50% coal - 50%100% ammonia |
|
||||||||||
|
+battery |
|
|
|
|
ammonia |
|
ammonia |
|
|
|
||
|
Renewables |
|
|
Coal retrofits |
|
|
|
||||||
Source: BloombergNEF. Note: Four hours duration for energy storage systems.
In 2030-2040, the cost of coal retrofits using green ammonia from Australia could undercut the costs of projects using blue ammonia from the Middle East, mainly due to cost reductions of renewable projects in Australia (Figure 8). The retrofits with locally produced green ammonia continues to be the most expensive during this period based on our analysis. By 2050 (Figure 9), coal retrofits co-firing 20% locally produced green ammonia ($80/MWh) could become cheaper than retrofits burning blue ammonia from the Middle East ($83/MWh). We expect retrofits co-firing green ammonia imported from Australia to be the cheapest ($69/MWh) out to 2050.
Figure 8: Comparison of levelized cost of electricity in 2030 Figure 9: Comparison of levelized cost of electricity in 2050
|
|
|
|
|
|
|
|
|
|
|
|
|
2030 |
|
|
|
|
|
|
|
|
|
|
|
|
|
|
|
|
|
2050 |
|
|
|
|
Blue ammonia |
|||||||
|
|
$/MWh (2021 real) |
|
|
|
|
|
|
|
|
|
|
|
|
Green ammonia |
|
|
|
|
|
|
|
|
|
|
|
|
|
|
|
|
|
|
|
|
||||||||
|
|
|
|
|
|
|
|
|
|
|
|
|
|
|
$/MWh (2021 real) |
|
|
|
|
|
|
|
|
from the |
|||||||||||||||||||
|
|
|
|
|
|
|
|
|
|
|
|
|
|
|
|
|
|
|
322 from Japan |
|
|
|
|
|
|
|
|
|
|||||||||||||||
|
|
|
|
|
|
|
|
|
|
|
|
|
|
|
|
|
|
|
|
|
|
|
|
|
|
|
|
|
|
|
|
|
|
|
236 |
|
Middle East |
||||||
|
|
|
|
|
|
|
|
|
|
|
|
|
|
|
|
|
|
|
|
|
|
Blue ammonia |
|
|
|
|
|
|
|
|
|
|
|
|
|
|
|
|
|
||||
|
|
|
|
|
|
|
|
|
|
|
|
|
|
|
|
|
|
|
|
|
|
|
|
|
|
|
|
|
|
|
|
|
|
|
|
|
|
|
|
|
223 |
||
|
|
|
|
|
|
|
|
|
|
|
|
|
|
|
|
|
|
|
|
|
263 from the |
|
|
|
|
|
|
|
|
|
|
|
|
|
|
|
|
|
|
|
|||
|
|
|
230 |
|
|
|
|
|
|
|
|
|
|
|
|
|
|
174 |
|
|
|
|
|
|
|
|
|
Green ammonia |
|||||||||||||||
|
|
|
|
|
|
|
|
|
|
|
|
|
|
|
|
|
|
|
|
|
|
|
|
||||||||||||||||||||
|
|
|
199 |
|
|
|
|
|
|
|
|
|
|
|
|
|
|
|
|
Middle East |
|
|
|
|
|
|
|
|
|
|
|
|
|
|
|
|
|
|
|
from Japan |
|||
155 |
|
|
|
|
|
|
|
|
|
|
184 |
224 |
|
Green ammonia |
|
|
|
123 |
|
|
|
|
|
|
|
|
|
140 |
168 |
Green ammonia |
|||||||||||||
|
|
|
|
|
|
|
|
|
|
|
|
|
|
|
from Australia |
103 |
|
|
|
|
|
|
|
|
|
|
|||||||||||||||||
|
|
|
|
|
|
|
|
|
|
|
|
|
|
|
|
|
155 |
|
|
|
|
|
|
|
|
|
|
|
83 |
|
|
|
134 |
from Australia |
|||||||||
|
|
|
|
|
|
131 |
|
|
135 102 |
|
|
|
|
|
|
|
|
|
|
|
|
|
|
|
80 |
|
|
|
99 |
80 |
106 |
|
|
|
|
|
|||||||
|
|
|
96 |
|
|
|
90 136 |
|
|
|
|
|
|
|
|
|
63 |
|
|
|
|
|
|
|
|||||||||||||||||||
|
|
|
|
|
|
|
|
|
|
|
|
|
|
|
|
|
|
|
|
|
|
|
|
|
|
|
|
|
|
|
|||||||||||||
71 |
103 |
|
|
|
89 |
83 |
|
|
|
|
|
|
|
|
|
|
47 |
60 |
|
|
|
63 |
|
|
69 |
|
|
|
|
|
|
|
|
||||||||||
|
|
|
|
|
|
|
|
|
|
|
|
|
|
|
|
|
|
|
|
|
|
|
|
|
|
|
|
|
|||||||||||||||
|
|
|
|
|
|
|
|
|
|
|
|
|
|
|
|
|
|
|
|
|
|
|
|
|
|
|
|
|
|
|
|||||||||||||
|
|
|
|
|
|
|
|
|
|
|
|
|
|
|
|
|
|
|
|
|
|
|
|
|
|
|
|
|
|
|
|
|
|
|
|
|
|
||||||
|
|
|
|
|
|
|
|
|
|
|
|
|
|
|
|
|
|
|
|
|
|
|
|
|
|
|
|
|
|
|
|
|
|
|
|
|
|
|
|
|
|||
|
|
|
|
|
|
|
|
|
|
|
|
|
|
|
|
|
|
|
|
|
|
|
|
|
|
|
|
|
|
|
|
|
|
|
|
|
|
|
|||||
|
Onshore wind + battery |
|
|
Offshore wind |
|
Solar + battery |
|
80% coal - 20% ammonia |
|
50% coal - 50% ammonia |
|
|
100% ammonia |
|
|
|
|
Onshore wind + battery |
|
|
Offshore wind |
|
Solar + battery |
|
80% coal - 20% ammonia |
|
|
50% coal - 50% ammonia |
|
|
100% ammonia |
|
|
||||||||||
|
|
Renewables |
|
|
Coal retrofits |
|
|
|
|
Renewables |
|
|
|
Coal retrofits |
|
|
|||||||||||||||||||||||||||
Source: BloombergNEF. Note: Four hours duration for energy |
Source: BloombergNEF. Note: Four hours duration for energy |
||||||||||||||||||||||||||||||||||||||||||
storage systems. |
|
|
|
|
|
|
|
|
|
|
|
|
|
storage systems. |
|
|
|
|
|
|
|
|
|
|
|
|
|||||||||||||||||
|
|
|
|
|
|
|
|
|
|
|
|
|
|
|
|
|
|
|
|
|
|
|
|
|
|
|
|
|
|
|
|
|
|
|
|
|
|
|
|
|
|
|
|
|
No portion of this document may be reproduced, scanned into an electronic system, distributed, publicly |
|
|
displayed or used as the basis of derivative works without the prior written consent of Bloomberg Finance |
|
|
L.P. For more information on terms of use, please contact sales.bnef@bloomberg.net. Copyright and |
8 |
© Bloomberg Finance L.P.2022 |
Disclaimer notice on page 26 applies throughout. |
|
|
|
|

Japan’s Costly Ammonia Coal Co-Firing Strategy
September 28, 2022
Retrofitting coal plants to burn ammonia is economically unviable, especially with a high co-firing ratio. Burning 20% ammonia at coal-fired plants would be more expensive than the running costs, or short-run marginal costs, of CCGT plants in 2024-2030. However, the retrofits burning 20% green ammonia from Australia could become cost competitive against CCGT in 2040 and offshore wind in 2050. The retrofits with other ammonia types are also set to remain uncompetitive throughout 2050. Yet, 20% ammonia co-firing would only cut CO2 emissions by 20% and emit more CO2 than CCGT. More analysis on emissions can be found in Section 5.1.
The retrofits with 50% and 100% ammonia blending are set to be far more expensive than 20% ammonia blending and therefore uncompetitive against other low-emission technologies (Figure 7 to Figure 9) For instance, offshore wind is one of the most expensive renewable technologies in Japan. Yet, offshore wind would be cheaper than coal retrofits burning 50%+ ammonia in 2030 and onward. This underscores the importance of deploying more offshore wind and other types of renewable energy, not ammonia co-firing technologies, to decarbonize the power sector in a costcompetitive manner. Retrofitting coal-fired power plants with ammonia should be used for seasonal balancing, instead of baseload power, to recoup the high costs.
Based on our analysis on the relative costs of different types of ammonia, retrofitting coal-fired power plants using domestically sourced green ammonia would not become cost competitive against other ammonia options, due to the high costs of domestic green ammonia. This means, from an economic standpoint, Japan will need to import large volumes of ammonia from overseas markets to fuel the retrofitted coal plants. The implication of high volumes of ammonia imports from an energy security angle can be found in Section 7.3.
Proponents of retrofitting existing coal power plants would cite the need for investment in grid infrastructure as well as balancing services for new renewable power plants as major challenges for adding more renewables. Indeed, connecting renewable projects larger than 2MW to the Japanese grid can currently cost up to a few billion yen. The higher capital expenditure can push up the LCOE of a solar plant5 by up to 37%. This would still be below the LCOE of a retrofitted coal power plant running at 100% ammonia. More importantly, Japan can reduce the costs required by improving its power market regulations. Japan’s grid infrastructure is currently underutilized due to legacy contracts prioritizing usage by older thermal and nuclear power plants regardless of their actual usage rates. Japan’s grid connection costs for new renewables are also higher than most other OECD markets due to lack of a fair transparent manner for awarding new network connections. Adding more renewables to Japan’s electricity system will certainly need more balancing services. Fortunately, Japan already has a large fleet of pumped hydro assets, originally developed to store excess nuclear power at night. And as figures 7 through 9 show, pairing renewables with energy storage would still be more economically viable than ammonia cofiring at the high blend rates required for decarbonization.
4.2.Cost comparison with carbon capture and storage (CCS) technologies
The emissions from fossil-fueled thermal power plants can be captured through chemical reaction either before or after fuel combustion. In this report, we only consider post-combustion liquid absorption capture, using an amine solvent that binds with CO2–the dominant capture technology
5 See Renewable Projects in Japan Challenged by Opaque Grid (web | terminal) for more details.
|
No portion of this document may be reproduced, scanned into an electronic system, distributed, publicly |
|
|
displayed or used as the basis of derivative works without the prior written consent of Bloomberg Finance |
|
|
L.P. For more information on terms of use, please contact sales.bnef@bloomberg.net. Copyright and |
9 |
© Bloomberg Finance L.P.2022 |
Disclaimer notice on page 26 applies throughout. |
|
|
|
|
Japan’s Costly Ammonia Coal Co-Firing Strategy
September 28, 2022
in the power sector. See LCOE Highlights: Hydrogen, CCS, Small Nuclear (web | terminal) for more details.
Our analysis (Figure 10) shows that carbon capture and storage (CCS) technologies can be cheaper than retrofitting coal plants for ammonia, especially at co-firing ratios above 50%. However, the cost decline of CCS technologies highly depends on global CCS market growth. Our cost forecast assumes that cumulative capacity would reach 30GW by 2030. If the deployment falls below 30GW, the speed of cost reductions could be slower than our expectation. Japan is unlikely to contribute to the pre-2030 deployment of CCS technologies. The country’s current target is to begin operations of CCS projects in 2030 by starting feasibility tests by FY2023 and making final investment decisions by FY2026.
Figure 10: LCOE comparison of different technologies
$/MWh (2021 real) 600
500
100% NH3 firing
400 |
50% NH3 |
co-firing |
|
|
|
||
300 |
|
Offshore wind |
|
|
|
|
|
200 |
|
|
|
|
|
|
Coal CCS |
100 |
|
|
CCGT CCS |
20% NH3 co-firing |
|
|
|
0 |
|
|
|
2024 |
2030 |
2040 |
2050 |
Source: BloombergNEF. Note: CCS stands for carbon capture and storage. CCS LCOEs do not capture the cost of CO2 transport and storage. Cost declines for CCS in 2024-2030 are contingent on a ramp-up of deployments to around 30GW by 2030 for the technology. Financing years are used for 2030 and 2050 of CCS LCOE.
Once captured, CO2 needs to be permanently stored in a permeable underground layer underneath a cap rock, or re-used as an industrial feedstock. The Japanese government has thus far identified 11 sites in Japan that could store 16 billion metric tons of CO2, more than Japan’s cumulative emissions between 2010-2020 (14.4 billion metric tons of CO2). While this may suggest there is ample space to store emissions from Japan’s coal power plants, the technical and economic feasibility of such an approach is still uncertain. For example, how to transport the emissions captured at a power plant to one of the 11 storage sites remains a key challenge. Public acceptance also remains unclear. In addition, some CCS projects have failed to deploy in other markets due to technical and environmental challenges.
The Japanese government aims to gradually increase the volume of annual CO2 injections from 2030 and reach 120-140 million tons of CO2 injections by 2050. This is equivalent to 11-13% of Japan’s annual CO2 emissions in 2020, or the volume of emissions from up to 26GW of coal power plants6.
6 The calculation assumes a 75% capacity factor, 0.9 tons of CO2 per MWh for emissions during electricity generation, and a 90% capturing rate by CCS technology.
|
No portion of this document may be reproduced, scanned into an electronic system, distributed, publicly |
|
|
displayed or used as the basis of derivative works without the prior written consent of Bloomberg Finance |
|
|
L.P. For more information on terms of use, please contact sales.bnef@bloomberg.net. Copyright and |
10 |
© Bloomberg Finance L.P.2022 |
Disclaimer notice on page 26 applies throughout. |
|
|
|
|

Japan’s Costly Ammonia Coal Co-Firing Strategy
September 28, 2022
Section 5. Greenhouse gas emissions
Reduction in CO2 emissions is the main advantage of ammonia co-firing at coal power plants. But burning ammonia can lead to emission of other greenhouse gases such as nitrous oxide (N2O). And a coal power plant retrofitted to co-fire ammonia at 50% or lower blend rates still emits more CO2 than a natural gas fueled combined cycle gas turbine power plant.
5.1.Carbon dioxide (CO2) emission reductions
Co-firing ammonia with coal can reduce CO2 emissions from a coal power plant. Figure 11, Figure 12, and Figure 13 show the emission reduction potential depending on the ammonia source, with green ammonia offering the best option. Japan’s current regulations do not differentiate the source of ammonia. Even with green ammonia, at co-firing rates of 50% or lower, CO2 emissions from a retrofitted coal plant would still be worse than a natural gas fueled combined cycle gas turbine.
Figure 11: Emissions from power |
Figure 12: Emissions from power |
Figure 13: Emissions from power |
generation and production of green NH3 |
generation and production of blue NH3 |
generation and production of gray NH3 |
ton of CO2 per MWh |
|
ton of CO2 per MWh |
|
ton of CO2 per MWh |
||
0.90 |
|
0.90 |
|
0.90 |
0.86 |
0.79 |
0.72 |
|
0.73 |
|
|
|
|
|
|
|
|
0.68 |
||
|
|
|
|
|
||
0.45 |
0.40 |
0.48 |
0.40 |
|
|
0.40 |
|
|
|
||||
|
|
|
|
|||
|
|
0.00 |
|
0.07 |
|
|
|
|
|
|
|
|
|
100% coal |
20% ammonia – 80% coal |
50% ammonia/coal |
Natural gas fueled CCGT |
100% ammonia |
100% coal |
20% ammonia – 80% coal |
50% ammonia/coal |
Natural gas fueled CCGT |
100% ammonia |
100% coal |
20% ammonia – 80% coal |
50% ammonia/coal |
100% ammonia |
Natural gas fueled CCGT |
Source: BloombergNEF. Note: Emissions for power generation and ammonia production. Gray (unabated) ammonia production assumes 9kg of CO2 emissions to produce 1kg of hydrogen. Blue ammonia production assumes 90% CO2 capture rates of carbon capture and storage (CCS) technologies for unabated hydrogen production.
5.2.Marginal abatement cost of ammonia coal co-firing
Based on avoided CO2 emissions (in CO2 emissions intensity) and project costs (in LCOE), we estimate (Figure 14) a carbon price of at least $300/ton of CO2 would be needed to make clean ammonia co-firing at 20% blend rate economically viable in 2030. By 2050 (Figure 15), the carbon price needed to make 100% ammonia fueled retrofitted coal plants economically viable could be
|
No portion of this document may be reproduced, scanned into an electronic system, distributed, publicly |
|
|
displayed or used as the basis of derivative works without the prior written consent of Bloomberg Finance |
|
|
L.P. For more information on terms of use, please contact sales.bnef@bloomberg.net. Copyright and |
11 |
© Bloomberg Finance L.P.2022 |
Disclaimer notice on page 26 applies throughout. |
|
|
|
|

Japan’s Costly Ammonia Coal Co-Firing Strategy
September 28, 2022
reduced to around $159/ton of CO2. These values are far higher than Japan’s current “tax for climate change mitigation” set at below $3/ton of CO2.
Figure 14: Marginal abatement cost in 2030
2030
Marginal abatement cost ($/ton of CO2)
410
345
302
|
|
|
|
|
|
|
|
|
|
80% coal – 20% |
|
80% coal – 20% |
|
80% coal – 20% |
|||
|
green ammonia |
|
blue ammonia from |
|
green ammonia |
|||
|
from Australia |
|
the Middle East |
|
from Japan |
|||
Source: BloombergNEF
Figure 15: Marginal abatement cost in 2050
2050
Marginal abatement cost ($/ton of CO2)
219 |
233 |
|
158
100% ammonia from100% ammonia from100% ammonia from
Australia |
Japan |
the Middle East |
Source: BloombergNEF
5.3.Nitrous oxide (N2O) emissions: no laughing matter
Figure 16: No laughing matter: global warming potential of CO2 vs. N2O
GWP
CO2 N2O
Source: BloomberrgNEF, EPA. Note: GWP for a 100year timescale.
Since the ammonia molecule includes nitrogen, ammonia combustion generates nitrous oxide, colloquially referred to as laughing gas. Nitrous oxide’s global warming potential (GWP) is 273 times larger than that of CO2 for a 100-year timescale. Nitric oxide (NO) and nitrogen dioxide (NO2) are not greenhouse gases. Japan’s Central Research Institute of Electric Power Industry’s research has shown at blend rates below 20%, higher rates of ammonia co-firing leads to higher nitrous oxide emissions. Other studies have suggested nitrous oxide emissions rise until 40% ammonia co-firing, while higher ammonia co-firing ratios lead to lower nitrous oxide emissions. Retrofitted coal plants would likely need to invest in technologies to capture the nitrous oxide emissions to ensure GHG emission reduction benefits. This in turn will further undermine the poor economics of ammonia co-firing.
Figure 17: Nitrous oxide (N2O) emission intensity for different ammonia co-firing ratio
Source: School of Energy and Environment at Anhui University of Technology in China
|
No portion of this document may be reproduced, scanned into an electronic system, distributed, publicly |
|
|
displayed or used as the basis of derivative works without the prior written consent of Bloomberg Finance |
|
|
L.P. For more information on terms of use, please contact sales.bnef@bloomberg.net. Copyright and |
12 |
© Bloomberg Finance L.P.2022 |
Disclaimer notice on page 26 applies throughout. |
|
|
|
|

Japan’s Costly Ammonia Coal Co-Firing Strategy
September 28, 2022
Section 6. Safety and toxicity
Ammonia needs to be handled with care due to its toxicity and flammability. The regulatory framework around safety is another concern as current regulations were not designed for ammonia use in power generation.
6.1.Safety and toxicity
Figure 18: Ammonia-related fire in China in 2013
Source: Washington Post.
Ammonia is colorless but has a distinct odor. The molecule can pose a big threat to human health as it reacts with water to form ammonium hydroxide, which is corrosive and damages cells in the body on contact. Thus, ammonia is classified as toxic under Japan’s regulations such as the Industrial Safety and Health Act and the Poisonous and Deleterious Substances Control Act.
Japan’s High Pressure Gas Safety Institution reported 28 minor ammonia-related7 incidents, such as leakage, in 2021. Other countries saw more severe cases. For example, at a poultry plant in China’s Jinlin province, ammonia leakage caused a fire and killed 120 people in 2013. In the same year, another ammonia leakage killed 15 and injured 25 at a frozen seafood plant in Shanghai, China.
Table 2: Safety comparison of ammonia and natural gas
|
Ammonia |
Natural gas (methane) |
|
|
|
Flammability |
- Flammable |
- Flammable |
|
|
|
Toxicity |
- Acute poisoning from inhaling |
- None |
|
- Skin/eye/respiratory damages |
|
|
|
|
Classification under the Industrial Safety |
- Specified Chemical Substance Type-3: a |
- Hazardous chemicals, flammable |
and Health Act |
mass leakage causes acute poisoning |
|
|
- Hazardous chemicals, flammable |
|
|
|
|
Classification under the Poisonous and |
- Deleterious substance |
- Not listed |
Deleterious Substances Control Act |
|
|
|
|
|
Source: BloombergNEF, The Globally Harmonized System of Classification and Labelling of Chemical (GHS), Ministry of Health, Labor, and Welfare of Japan. Safety levels are colored as dangerous, medium, and safe.
6.2.Ammonia-related regulations
Japan’s current ammonia regulations were not designed for electricity generation
Since ammonia has been traded internationally and processed domestically in Japan, the country already has multiple regulations on ammonia. These are listed in Table 3 and cover handling, marine transport, storage and supply of ammonia. However, Japan’s current ammonia regulations were not designed for electricity generation. To ensure safety, Japan needs to implement new
7 Ammonia-related accidents in this section distinguish ammonia from ammonium nitrates.
|
No portion of this document may be reproduced, scanned into an electronic system, distributed, publicly |
|
|
displayed or used as the basis of derivative works without the prior written consent of Bloomberg Finance |
|
|
L.P. For more information on terms of use, please contact sales.bnef@bloomberg.net. Copyright and |
13 |
© Bloomberg Finance L.P.2022 |
Disclaimer notice on page 26 applies throughout. |
|
|
|
|

Japan’s Costly Ammonia Coal Co-Firing Strategy
September 28, 2022
regulations overseeing materials used for boilers, gas leakage at power plants, and safety/hazard sign standards for ammonia use in the power sector.
Table 3: Current regulations related to ammonia use
Type |
Relevant regulations |
|
|
Facilities |
- High Pressure Gas Safety Act |
-Industrial Safety and Health Act
-Noise/Vibration Regulation Act
-Act on the Prevention of Disaster in Petroleum Industrial Complexes and Other Petroleum Facilities
-Building Standard Act
-Port and Harbor Act
-Fire Services Act
-Poisonous and Deleterious Substances Control Act
-Offensive Odor Control Law
Marine transport |
- |
Ship Safety Act |
|
- |
Fire Services Act |
|
- |
Cabinet Order Concerning the Control of Hazardous Materials |
|
- |
Regulation Concerning the Control of Hazardous Materials |
|
- |
Port Regulation Act |
|
|
|
Storage |
- |
Fire Services Act |
|
- |
Regulation on Safety of General High Pressure Gas |
|
- |
Warehouse Business Act |
|
|
|
Ammonia supply via |
- |
Road Traffic Act |
road or pipelines |
- |
Regulation on Safety of General High Pressure Gas |
|
||
|
- |
Regulation on Safety of Industrial Complexes |
|
- |
Seacoast Act |
|
- |
River Act |
Source: Ministry of Land, Infrastructure, Transport, and Tourism
The government is mulling more stringent requirements for safe distance and empty space near facilities handling ammonia. Current regulations are based on the category of high-pressure gas without considering ammonia’s toxicity. Under the current rules, ammonia facilities need to be 20 meters away from other high-pressure gas facilities, 30 meters away from facilities with many people (such as schools, hospitals, and theaters), and 50 meters away from historical sites. Empty space must also be secured within 15 meters of such facilities.
In addition, the government is aiming to revamp regulations for operation and maintenance at fossil-fueled power plants due to ammonia’s toxicity and flammability. Currently, regulations do not require dedicated electric/boiler technicians and the submission of construction schedules for small thermal power plants.
|
No portion of this document may be reproduced, scanned into an electronic system, distributed, publicly |
|
|
displayed or used as the basis of derivative works without the prior written consent of Bloomberg Finance |
|
|
L.P. For more information on terms of use, please contact sales.bnef@bloomberg.net. Copyright and |
14 |
© Bloomberg Finance L.P.2022 |
Disclaimer notice on page 26 applies throughout. |
|
|
|
|

Japan’s Costly Ammonia Coal Co-Firing Strategy
September 28, 2022
Section 7. Clean ammonia supply and demand
Japan’s current ammonia demand is relatively small at around 1 million tons per year, just shy of 1% of global production. The Japanese government wants to grow this demand by promoting ammonia co-firing at coal plants. Given the technology’s low economic competitiveness in electricity generation, promoting the use of clean ammonia in other applications such as fertilizer production or even shipping offers more advantages and opportunities for decarbonization.
7.1.Current market size
Japan’s annual ammonia demand is about 1 million tons8, less than 1% of global production9, in 2021. Around 80% of this demand is met through domestic production, using imported fossil fuel feedstock. The remaining 20% is imported10 from countries including Indonesia, Australia, and Malaysia.
Figure 19: Japan’s historical ammonia demand |
|
|
|
|
|
|
||||
thousand tons of NH3 |
|
|
|
|
|
|
|
|
||
1,200 |
1,124 |
1,095 |
1,121 |
|
1,105 |
|
1,114 |
|
|
|
|
1,070 |
|
|
|
|
|||||
|
|
|
|
|
|
|
|
|
|
|
1,000 |
200 |
221 |
241 |
|
|
963 |
244 |
|
|
|
|
244 |
|
|
|
|
|||||
|
|
271 |
|
|
|
|
||||
|
|
|
|
|
|
|
|
|
|
|
800 |
|
|
|
|
|
203 |
|
|
|
|
|
|
|
|
|
|
|
|
|
|
|
600 |
|
|
|
|
|
|
|
|
|
Other |
|
|
|
|
|
|
|
|
|
||
|
|
|
|
|
|
|
|
|
||
|
|
|
|
|
|
|
|
|
|
|
|
901 |
|
|
|
|
|
|
|
|
Import |
|
|
|
|
|
|
|
|
|
||
|
|
|
|
|
|
|
|
|
||
400 |
863 |
863 |
783 |
848 |
|
853 |
|
|
Production |
|
|
|
|
||||||||
|
|
|
||||||||
|
|
|
|
|
||||||
|
|
|
|
743 |
|
|
|
|
||
|
|
|
|
|
|
|
|
|
|
|
200 |
|
|
|
|
|
|
|
|
|
|
0 |
|
|
|
|
|
|
|
|
|
|
2015 |
2016 |
2017 |
2018 |
2019 |
2020 |
2021 |
|
|
|
|
|
|
|
|
|||||||
Source: Japan Fertilizer & Ammonia Producers Association, BloombergNEF. Note: Years show
Japan’s fiscal year starting from April to March.
|
8 |
Japan Fertilizer & Ammonia Producers Association |
|
|
9 |
International Energy Agency (IEA) |
|
|
10 Tariff item number for ammonia is 2814-10 for Japan customs. |
|
|
|
|
|
|
|
No portion of this document may be reproduced, scanned into an electronic system, distributed, publicly |
|
|
|
displayed or used as the basis of derivative works without the prior written consent of Bloomberg Finance |
|
|
|
L.P. For more information on terms of use, please contact sales.bnef@bloomberg.net. Copyright and |
15 |
|
© Bloomberg Finance L.P.2022 |
Disclaimer notice on page 26 applies throughout. |
||
|
|
|
|

Japan’s Costly Ammonia Coal Co-Firing Strategy
September 28, 2022
7.2.Future market size
Japan’s ambitious ammonia target underscores its desire to keep existing coal-fired power plants, which could otherwise become stranded in the country’s push for decarbonization.
IEA’s scenarios suggest global ammonia production could grow to 217-222 million tons by 2030 and to 254-319 million tons by 2050 from 185 million tons in 2020. Japan’s government aims to increase its ammonia demand to 3 million tons by 2030 and 30 million tons by 2050 from 1 million tons in 2021 (Figure 20). These targets do not include a breakdown by use case. Japan’s ammonia demand target seems ambitious given that the 2050 target would be equivalent to about
11% of IEA’s global demand projection in 2050.
Figure 20: Japan’s current ammonia demand size and targets for 2030 and 2050
million tons of NH3 per year |
30 |
|
 Volume needed for the targeted
volume
29
 Current demand
1
3
2
2021 actual 2030 target 2050 target
Source: BloombergNEF, Ministry of Economy, Trade, and Industry, Japan Fertilizer & Ammonia Producers Association.
Figure 21: Theoretical cumulative volume of ammonia supply globally (converted from clean hydrogen production projects proposed by developers)
million tons of NH3 per year |
|
|
7.8 |
|||
Green ammonia |
|
5.9 |
6.1 |
|
||
Blue ammonia |
|
|
||||
|
|
|
||||
|
|
|
|
|||
|
|
|
4.5 |
|
|
5.2 |
|
|
|
|
3.9 |
4.1 |
|
|
|
|
3.0 |
|
|
|
|
|
1.2 |
|
|
|
|
0.2 |
0.6 |
1.5 |
2.0 |
2.0 |
2.6 |
|
|
||||||
|
|
0.6 |
|
|
|
|
2021 |
'25 |
'30 |
'35 |
'40 |
N/A |
|
Source: BloombergNEF. Note: The volume of ammonia is converted from the volume of hydrogen assuming all hydrogen supply pipeline was used for ammonia production.
BloombergNEF tracks the volume of clean hydrogen supply pipeline proposed by developers globally. Assuming all of those were used for clean ammonia production, the cumulative volume of clean ammonia supply would be only 6.1 million tons of ammonia per year in 2040 (Figure 21)
– much less than Japan’s 2050 target, showing how ambitious Japan’s ammonia demand target is. At the same time, not all clean hydrogen supply projects would be for ammonia production.
To sense-check the Japanese government’s ammonia demand targets, we have estimated (Table 4) the volume of ammonia needed for co-firing at different blend rates, assuming coal power plants are only retired after 45 years of operation. By 2030, if all of Japan’s coal power plants were to co-fire ammonia at a 20% blend rate, annual demand would reach 22.6 million tons, significantly higher than the government’s 3 million tons target. This suggests the government expects few coal plants will be co-firing with ammonia in 2030. By 2050, if all remaining coal power plants try to run only on ammonia, annual demand would reach 40.4 million tons, higher than the government’s 30 million tons. This suggests the government is assuming some coal power retirements and/or usage of carbon capture and storage at some coal plants.
|
No portion of this document may be reproduced, scanned into an electronic system, distributed, publicly |
|
|
displayed or used as the basis of derivative works without the prior written consent of Bloomberg Finance |
|
|
L.P. For more information on terms of use, please contact sales.bnef@bloomberg.net. Copyright and |
16 |
© Bloomberg Finance L.P.2022 |
Disclaimer notice on page 26 applies throughout. |
|
|
|
|

Japan’s Costly Ammonia Coal Co-Firing Strategy
September 28, 2022
Table 4: Ammonia demand size comparison
|
2030: 20% ammonia co-firing |
2040: 50% ammonia co-firing |
2050: 100% ammonia firing |
|
|
|
|
Cumulative coal capacity |
45GW |
35GW |
16GW |
|
|
|
|
NH3 Ammonia burned by |
22.6 million tons of |
43.7 million tons of |
40.4 million tons of |
all coal-fired power |
ammonia/year |
ammonia/year |
ammonia/year |
plants |
|
|
|
|
|
|
|
Government target |
3 |
Not applicable |
30 |
Source: BloombergNEF. Note: The volume of ammonia needed per GW per year is assumed to be 500,000 tons for 20% co-firing, 1,250,000 tons of ammonia for 50% co-firing, and 2,500,000 tons of ammonia for 100% firing. Efficient coal-fired power plants include ultra-super critical plants. Inefficient coal-fired power plants include sub-critical and supercritical plants.
7.3.Energy security considerations
Coal retrofits could enable existing coal-fired power plants to stay in the market. However, as discussed in Section 5, it would be crucial for coal-fired power plants to blend at least 50% ammonia to limit CO2 emissions below that of natural gas-fired CCGT plants. Since Japan is yet to commercialize 20% co-firing technology, it would take time to achieve 50%+ levels. The immaturity of ammonia co-firing technology means that Japan would need to continue thermal coal imports for many years to come, putting its energy security at risk.
Figure 22: Outlook on ammonia production costs for Japan
$ per ton of NH3 (2021 real) 2,500
2,000
1,500
1,000
500
0
2030 |
2040 |
2050 |
Source: BloombergNEF. Note: See Appendix B for more details.
Green ammonia in Japan
Green ammonia from Australia
Blue ammonia from Middle East
In addition, Japan would likely need to rely on clean ammonia from other countries due to the high cost of domestically sourced green ammonia. Green ammonia produced in Japan is set to cost more than green ammonia imported from Australia throughout 2050, as shown in Figure 22. Similarly, Japanese green ammonia could be more expensive than blue ammonia imported from the Middle East until 2040.
|
No portion of this document may be reproduced, scanned into an electronic system, distributed, publicly |
|
|
displayed or used as the basis of derivative works without the prior written consent of Bloomberg Finance |
|
|
L.P. For more information on terms of use, please contact sales.bnef@bloomberg.net. Copyright and |
17 |
© Bloomberg Finance L.P.2022 |
Disclaimer notice on page 26 applies throughout. |
|
|
|
|