

01 POWER ISLAND / 02 H2+NH3 / Royal Swiss 2024 Techno-Economic Analysis of Wind Power-to-Hydrogen
.pdfThe hourly spot prices (Figure 24 28) used in the calculations, belong to bidding area two. The wind speed influencing these spot prices, were measured by the wind station Eggegrund A (Figure 27 29). Placing the wind speed and spot price figures side by side, shows the correlation between the wind velocity and electricity price. One notable example of this correlation can be observed between 3000 and 5000 h in Figure 24 and 27. During this period, the wind speed in Figure 27 fluctuates from low to high and then back to low, resembling the shape of an arrowhead. As the result, the spot prices in Figure 24, follow a similar pattern of variation, however, negatively correlated.
Moreover, the Figures 27–29 were used in combination with Table 11 to generate the annual power production of the offshore wind farm. The annual power production was then used to generate simulations of hydrogen productions at hours where the spot prices were below break-even point. Hydrogen was only produced when the wind turbine generated a power at or higher than the electrolyzer’s capacity.
Figure 24. Simulation of spot price year 2019. |
Figure 27. Simulation of wind speed year 2019. |
Figure 25. Simulation of spot price year 2020.
Figure 28. Simulation of wind speed year 2020.
59
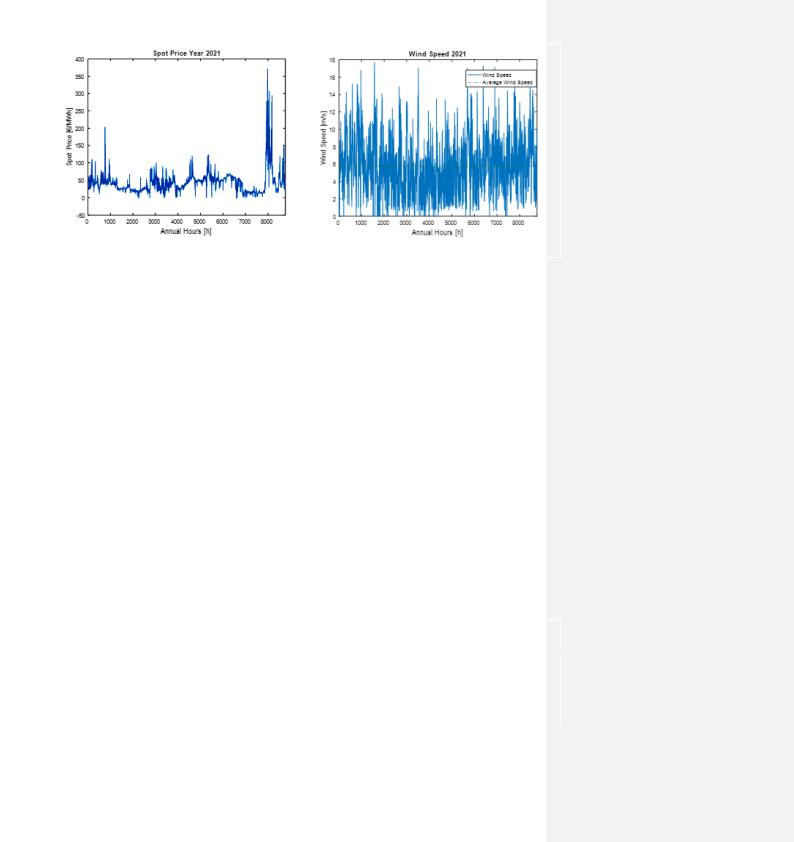
Figure 26. Simulation of spot price year 2021.
Figure 29. Simulation of wind speed year 2021.
6.1.2 The Profitability of Power-to-Hydrogen Park
The annual investment cost of the hydrogen production facilities was expected to be covered by the yearly income generated from hydrogen production; this means that the facility is generating a profit. To investigate and determine whether the annual revenue generated were sufficient to cover the variable expenses, the contribution margin in equation (13) was applied. The investment cost of each facility size available in Table 19–21, was subtracted from the generated income that is listed in Table 40–48, in Appendix B. The resulting values are detailly documented in Appendix C as Table 49–57 and serves as indicators of the profitability. A negative value signifies a financial loss, indicating that the generated income from the hydrogen sales is insufficient to cover the annual investment costs. An example of this can be observed in Table 40, where the spotand hydrogen price of 49.3 (€/MWh) and 3 (€/kg), respectively, resulted in a yearly loss of -0.38 m€, as seen in Table 49. In contrary to this, when the spotand hydrogen price are 89.13 (€/MWh) and 5 (€/kg), respectively, a profit of 0.7 m€ was yielded as is seen in Table 49. In such instances, the hydrogen facility can be deemed as profitable. However, it is important to keep in mind that the hydrogen facilities modeled in this report are simplified versions. This means that not all costs have been included and that the 0.7 m€ profit would in the reality be used to cover other expenses, which ultimately could result in a break-even or an economic loss scenario. Moreover, the Tables 49 51 and Table 52 54 in Appendix C, shows that the 5 MW and 10 MW facilities started to yield positive contribution margins at hydrogen prices ≥4 €/kg for all target years. The 20 MW facility obtained a positive contribution margin at hydrogen prices ≥5 €/kg for all target years, according to Table 55 57 in Appendix C. However, these profits were significantly low. The following Tables 36 38 are a summarization of Table 49 57 in Appendix C, for all target years.
Table 36. Profit generated from hydrogen sales 5 MW, 10 MW and 20 MW in 2019, hydrogen price ranges from 3–7 €/kg.
Spot Price |
Hydrogen Price |
Profit of 5 MW |
Profit of 10 MW |
Profit of 20 MW |
|
|
|
|
|
|
|
|
|
|
|
|
|
49.3 |
[€/MWh] |
3 [€/kg] |
-0.36 [m€] |
-0.91 [m€] |
-2.20 [m€] |
69.2 |
[€/MWh] |
4 [€/kg] |
0.19 [m€] |
0.04 [m€] |
-0.77 [m€] |
89.13 |
[€/MWh] |
5 [€/kg] |
0.69 [m€] |
0.87 [m€] |
0.46 [m€] |
109.1 |
[€/MWh] |
6 [€/kg] |
1.19 [m€] |
1.70 [m€] |
1.68 [m€] |
129 |
[€/MWh] |
7 [€/kg] |
1.68 [m€] |
2.52 [m€] |
2.90 [m€] |
|
|
|
|
|
|
60

Table 37. Profit generated from hydrogen sales 5 MW, 10 MW and 20 MW in 2020, hydrogen price ranges from 3–7 €/kg.
Spot Price |
Hydrogen Price |
Profit of 5 MW |
Profit of 10 MW |
Profit of 20 MW |
|
|
|
|
|
|
|
|
|
|
|
|
|
50.7 |
[€/MWh] |
3 [€/kg] |
-0.29 [m€] |
-0.77 [m€] |
-2.03 [m€] |
70.7 |
[€/MWh] |
4 [€/kg] |
0.23 [m€] |
0.07 [m€] |
-0.82 [m€] |
90.6 |
[€/MWh] |
5 [€/kg] |
0.75 [m€] |
0.90 [m€] |
0.38 [m€] |
110.5 |
[€/MWh] |
6 [€/kg] |
1.26 [m€] |
1.73 [m€] |
1.57 [m€] |
130.5 |
[€/MWh] |
7 [€/kg] |
1.77 [m€] |
2.56 [m€] |
2.77 [m€] |
|
|
|
|
|
|
Table 38. Profit generated from hydrogen sales 5 MW, 10 MW and 20 MW in 2021, hydrogen price ranges from 3–7 €/kg.
Spot Price |
Hydrogen Price |
Profit of 5 MW |
Profit of 10 MW |
Profit of 20 MW |
|
|
|
|
|
|
|
|
|
|
|
|
|
52.3 |
[€/MWh] |
3 [€/kg] |
-0.37 [m€] |
-0.89 [m€] |
-2.17 [m€] |
72.2 |
[€/MWh] |
4 [€/kg] |
0.26 [m€] |
0.17 [m€] |
-0.62 [m€] |
92.2 |
[€/MWh] |
5 [€/kg] |
0.86 [m€] |
1.11 [m€] |
0.78 [m€] |
112.1 |
[€/MWh] |
6 [€/kg] |
1.39 [m€] |
2.06 [m€] |
2.15 [m€] |
132.1 |
[€/MWh] |
7 [€/kg] |
1.96 [m€] |
3.00 [m€] |
3.53 [m€] |
|
|
|
|
|
|
6.2 Hydrogen Demand of Gävle Harbor
The daily hydrogen demand for each transition stage (15%, 50% and 100%) listed in Table 27, are derived from the suggested vehicle composition in Table 63, in Appendix E. These quantity demands can serve as an axis to analyze and determine at which stage of the transition process these different hydrogen facilities potentially will be positioned. These positions were obtained by converting the annual hydrogen produced listed in Table 40–48 in Appendix B, into average daily hydrogen production. These daily hydrogen productions were then used to estimate to which
transition stage the respective facility can contribute to by applying |
equation 32. |
|||
Transition Stage [%] = |
Average Daily Production [H2 kg] |
(32) |
||
100% Transition Stage [H2 kg] |
|
|||
|
|
|||
Where the 100% transition state corresponds to the daily hydrogen production of 12 062 kg, as seen in Table 27.
The average transition stage for each facility size is listed in Table 39. Based on the amount of annual hydrogen production of 5 MW facility, it can be determined that the 5 MW facility contributes to less 15% of the transition stage. Furthermore, the 10 MW-facility seems to be capable of contributing between 10% and 20% to the transitioning process, while the 20 MW facility can contribute between the range of 23% and 30%. The purpose of doing such measure, is to estimate facilities capability to contribute to Gävle port’s green transition goals.
61

Table 39. Average TS contribution of the three different PtH plants.
H2 Production Facility Size |
Average Transition Stage |
||
|
|
|
|
|
|
|
|
5 |
[MW] |
9.6–12.5 |
[%] |
10 |
[MW] |
15.7–20.8 |
[%] |
20 |
[MW] |
23.2–30.6 |
[%] |
|
|
|
|
62

CHAPTER 7. DISCUSSION AND CONCLUSION
7.1 Discussion
The aim of this project was to investigate whether a hydrogen production facility powered by an offshore wind farm, had the potential of becoming profitable. Thus, it is important to note that the facilities modeled in this report were designed to provide a generalized configuration of how a typical PtH plant would look like. As a result, certain equipment, e.g., AC/DC converter and thermal module, and additional factors, e.g., electricity consumption of storage and HRS’s operation, that also could influence the economic and technical aspects, have not been included in the calculations.
The primary objective was to determine if the amount of hydrogen produced and sold were sufficient to cover the variable and fixed cost of the main components and HRS. The results presented in Table 36–38 in section 6.1.2 indicates that significant profits were only attainable at higher hydrogen prices for all facility sizes and target years. One of the main reasons were the high capital cost of equipment used in the hydrogen production plant, which are expected to be reduced in the future. Furthermore, one can argue that including the investment costs of HRS was also a contributing factor to the results of only obtaining significant profits at high hydrogen prices. To investigate this matter, the influence of the HRS’ investment cost (Table 19–21) on the annual total investment cost for all facility sizes (Table 49–57) in appendix C, were studied. For example, the annual total investment costs for the 5 MW facility, for all target years, in Table 49–51 were between 1.32 m€ and 1.86 m€, and the investment cost of HRS used in the 5 MW facility (Table 19) was 2.5–4.73 m€; which corresponds to an annual cost of 0.28–0.52 m€ using the annuity method. This means that the annual cost of HRS (0.28–0.52 m€) contributed around 21–28% to the annual total investment cost (Table 49–51) of the 5 MW facility. The same approach was applied to investigate the influence of the HRS’ investment cost (Table 20–21) to the annual investment cost of 10 MW (Table 52–54) and 20 MW (Table 55–57) facilities for all target years.
The total cost of HRS used in the 10 MW facility (Table 20) was between 4.73 m€ and 7.0 m€, which corresponds to an annual cost of 0.52–0.77 m€ using the annuity method. The annual investment cost of the 10 MW facility (Table 52–54) was between 2.98 m€ and 3.42 m€. This means that the annual cost of HRS (0.52–0.77 m€) increased the total annual investment cost of 10 MW facility (Table 52–54) by 17–23%. Lastly, the investment cost of HRS used in the 20 MW facility (Table 21) was around 7.0 9.3 m€. By using the annuity method, the annual cost of HRS used in the 20 MW facility (Table 21) was between 0.77 m€ and 1 m€. The total annual investment cost of 20 MW facility (Table 55–57) was between 5.26 m€ and 5.90 m€. This means that the annual cost of HRS (0.77 1 m€) increased the 20 MW facility’s total investment cost by 15–17%.
One common denominator for all these facility sizes is that the investment cost of HRS contributed to less than 30% of the total annual investment cost (Table 49–57) for all target years. For the
5 MW facility, the influence of the HRS’ investment cost on the total annual investment cost was at its highest (21–28%), while for the 20 MW facility, the HRS’ investment cost on the total annual investment cost was at its lowest (15–17%) for all target years. The influence of the HRS’ investment cost on the 10 MW facility’s total annual investment cost, fell between the 5 MW and
20 MW facilities (17–23%) for all target years. Now, if the investment cost of the HRS was not included, e.g., was paid by the costumer Gävle harbor, then the total annual investment cost for all facilities would have been reduced by 15–28% depending on facility size. How this would have influenced the economic outcome can for example be seen in the 5 MW facility in Table 49, at a hydrogen price 3 €/kg, where a loss of -0.36 m€ was obtained. If the cost of HRS (0.28 m€) was
63

excluded at the hydrogen price of 3 €/kg, then the annual investment cost of the 5 MW facility would have been reduced by 21% from 1.32 m€ to 1.04 m€, which in turn would have yield a profit of 0.22 m€ instead of the -0.36 m€ loss. However, 0.22 m€ is still considered to be a significantly low profit to generate when considering the previous mentioned factors that were excluded when constructing the Power-to-hydrogen plant. Same approach can be applied for the 10 MW and 20 MW facilities for all target years. Based on this, one can conclude that the investment cost of HRS in this report, does not significantly influence the resulting economic outcome. Meaning, whether HRS is included in the total investment cost of 5 MW, 10 MW and 20 MW facilities or not, significant profits are to be still only attainable at high hydrogen prices.
Moreover, the generated revenue listed in Table 36–38, would in a real practice be consumed by the expenses of the excluded equipment’s capital (e.g., AC/DC converter and thermal module) and operational costs (e.g., electricity consumption of storage and HRS’s operation). Apart from that, it is also important to consider the risk of additional unforeseen expenses that may occur. These expenses may arise due to limited knowledge about executing and operating a large-scaled hydrogen production facility and the lack of an established hydrogen infrastructure. Therefore, an economic buffer is necessary.
Storage is one of the most expensive components of a hydrogen production facility. Therefore, it is the one of the main components that needs to become less expensive in order to increase the chances of green hydrogen becoming profitable at lower prices. Therefore, geological storage such as salt caverns, have the potential to reduce the capital cost of hydrogen storage and at the same time be able to store large quantities. However, the drawback is that geological storage is geographically limited.
This study introduces three different sizes of H2 production facilities. The objective was to a find a correlation between the facility size and the probability of achieving economic profitability. The purpose was to determine which plant size demonstrated a greater chance of achieving economic profitability.
As observed in Table 40–42 in Appendix B, the 5 MW facility demonstrated the most profitable annual operational hours (4203–5115 h), while the 20 MW facility had the fewest (2552–3369 h). This outcome was expected, not only due to lower power requirement to operate a 5 MW electrolyzer but also because lower power levels are more frequently attainable compared to higher power levels when dependent on wind speed. As previously mentioned, low wind speeds generate low power while high wind speeds generate high power, which can also be seen in Table 11. Additionally, this can as well be seen in the durability diagram in Figure 22, where there were more hours of 5 MW being produced by the wind turbine compared to 10 MW and 20 MW. This was also visually observed in the simulations of hydrogen production (Figure 30–44) Appendix D), where the 5 MW electrolyzer had more spikes in the plots compared to 20 MW electrolyzer. However, the 20 MW electrolyzer produces four times more hydrogen than 5 MW per hour, resulting in a higher income generated. Therefore, the calculated profits (Table 49–57, Appendix C) were much higher for the 20 MW compared to the 5 MW. Nonetheless, the 5 MW electrolyzer had a more frequent production over the target years, whereas the 20 MW electolyzer experienced prolonged periods, longer than seven days, of zero production for all target years; keeping in mind that the storage was dimensioned for maximum 7 days of production. In order words, there were periods of the storage being empty. Thus, it is not accurate to claim that the 20 MW plant had an average daily production. However, for the sake of this report, the 20 MW facility was assumption to provide an average daily hydrogen production to enable different calculations e.g., determining the contribution of the 20 MW facility to the transition process of Gävle harbor.
64

The 10 MW electrolyzer fell between that of 5 MW and 20 MW, both in terms of the economic and technical aspect. The 10 MW had fewer operational hours than 5 MW, but more than 20 MW for all target years. As the result, the 10 MW facility’s generated income exceeded that of the 5 MW but was lower than the income generated by the 20 MW as seen in Table 33-35. This is due to the 10 MW electrolyzer producing two times more hydrogen than the 5 MW electrolyzer per hour but two times less than 20 MW per hour. Nevertheless, the facility sizes demonstrated both advantages and drawbacks based on which aspect that is being viewed. From the production aspect, the 5 MW electrolyzer is more reliable to deliver an average daily production due to having more operational hours, while the 10 MW electrolyzer was on the verge of becoming capable to do so as well. However, similar to the 20 MW electrolyzer, the 10 MW facility had some periods longer than 7 days with zero hydrogen production. The 20 MW electrolyzer demonstrated the fewest operational hours and therefore had prolonged gaps of zero hydrogen production. This would mean that the HRS would not be able to provide fuel to the vehicles in Gävle Habror due to no production taking place for so long that the storage would have been empty. Consequently, no vehicles would be able to operate. This makes both 20 MW and 10 MW facilities too unreliable to operate if these facilities were solely powered by an intermittent power source such as wind energy. Nonetheless, it is still difficult to determine which facility size that had the highest chance of becoming profitable due to previously mentioned excluded factors. Apart from that, complex simulations of the facility’s operation are necessary in order to obtain a detailed analysis of its performance. In this way more information can be gathered to make a final accurate decision.
7.2 Conclusion
Based on the results presented for the investigated cases in this thesis, green hydrogen from electrolyzers does not seem to be profitable at low selling prices but rather needs to have a price exceeding 7 €/kg to become profitable. Even the revenues obtained at the selling price of 6 €/kg and 7 €/kg for all facilities sizes, with or without including the investment cost of HRS, for all target year, were too low to generate a profit. Additionally, if the facilities would have been more complexly designed than the simplified cases analyzed here, the revenues would have been even lower if not entirely consumed by the expenses for the equipment and operational costs that were disregarded in the investigated cases in this thesis.
Developing a large-scale hydrogen production facility powered by a renewable energy source is a complex and expensive process. For a seasonal hydrogen production to become profitable, the investment cost of the equipment also needs to be reduced and the hydrogen infrastructure must become well-established. In this way, green hydrogen will get a higher chance to compete with diesel fueled and electric cars. Once these factors have been achieved, then this would increase the probability of companies and people becoming encouraged to invest in hydrogen fueled cars due to the cheap fuel cost and easy access to a hydrogen refuel station.
65

CHAPTER 8. FUTURE WORKS
A suggestion for future work would be to eliminate the delimitations of this thesis. Specifically, implementing a deeper analysis of the Power-to-Hydrogen’s operational process, where important factors (e.g., hydrogen and electricity losses) and the excluded components (e.g., thermal module) are considered. In this way, a more detailed data performance of a PtH plant’s operation as well as the construction of the hydrogen production facility, can be obtained. A detailed facility can then be both quantitatively and qualitatively analyzed by proper simulation tools to provide a more accurate and realistic presentation of the components’ inlet and outlet flows.
66

Bibliography
[1]Government offices of Sweden. (2020). “Sweden’s long-term strategy for reducing greenhouse gas emissions”. Ministry of the Environment. [Online].
Available: https://unfccc.int/sites/default/files/resource/LTS1_Sweden.pdf.
[2]Government Offices of Sweden. (2015). “Goal 12: Responsible consumption and production”. [Online]. Available: https://www.government.se/government-policy/the-global- goals-and-the-2030-Agenda-for-sustainable-development/goal-12-responsible-consumption-and- production/.
[3]European Climate Law. (2021). [Online]. Available: https://climate.ec.europa.eu/eu- action/european-green-deal/european-climate-law_en.
[4]International Energy Agency. (2023). “Transport - Energy System”. [Online].
Available: https://www.iea.org/energy-system/transport.
[5]International Energy Agency. (2021). “Transport – Topics”. [Online]. Available: https://www.iea.org/topics/transport.
[6]A. Züttel. (2004). ”Hydrogen storage methods”. Naturwissenschaften, vol. 91, no. 4, pp. 157– 172. [Online]. Available: doi: 10.1007/s00114-004-0516-x.
[7]H. Cavendish and S. A. Arrhenius. (1997). “Hydrogen”. Chemistry of the Elements. [Online]. Available: doi: 10.1016/B978-0-7506-3365-9.50009-2.
[8]S. S. Makridis. (2016). “Hydrogen storage and compression”. Methane Hydrogen. Energy Storage. [Online]. Available: https://doi.org/10.1049/PBPO101E_ch1
[9]H-deux Suiso. (2023). “What is hydrogen?”. [Online].
Available: https://en.h-deux.com/what-is-h2.
[10]Y. Huang, et al. (2021). “Experimental Techniques”. Industrial Ventilation Design Guidebook, vol. 2, pp. 185–277. [Online]. Available: https://doi.org/10.1016/b978-0-12-816673- 4.00004-3.
[11]J. Andersson, S. Grönkvist. (2019). “Large-Scale Storage of Hydrogen”. International Journal of Hydrogen Energy, vol. 44, no. 23, pp. 11901–11919. [Online].
Available: https://doi.org/10.1016/j.ijhydene.2019.03.063.
[12]S. Luidold, A. Helmut. (2007). “Hydrogen as a Reducing Agent: State-of-The-Art Science and Technology”. JOM, vol. 59, no. 6, pp. 20–26. [Online].
Available: https://doi.org/10.1007/s11837-007-0072-x.
[13]A. Davoodabadi, A. Mahmoudi, H. Ghasemi. (2021). “The potential of hydrogen hydrate as a future hydrogen storage medium”. IScience, vol. 24, no. 1. [Online]. Available: https://doi: 10.1016/j.isci.2020.101907.
[14]A. Wickström. (2022). “Vätgasens potentiella värde som bränsle för framdrift av fordon samt andra industriella processer”. [Online]. Available: https://www.ri.se/sites/default/files/2022-05/HyCoGen.
[15]S. Shiva Kumar and V. Himabindu. (2019). “Hydrogen production by PEM water electrolysis – A review”. Mater. Sci. Energy Technol., vol. 2, no. 3. [Online]. Available: https://doi: 10.1016/j.mset.2019.03.002.
[16]Hydrogen Council. (2020). Path to Hydrogen Competitiveness a Cost Perspective. [Online]. Available: https://hydrogencouncil.com/wp-content/uploads/2020/01/Path-to-Hydrogen- Competitiveness_Full-Study-1.pdf.
67

[17]Naturvårdsverket. (2023). “Sveriges Utsläpp Och Upptag Av Växthusgaser”. [Online]. Available: https://www.naturvardsverket.se/data-och-statistik/klimat/sveriges-utslapp-och- upptag-av-vaxthusgaser/.
[18]“Sweden Energy Prices.” (2023). [Online]. Available: https://www.globalpetrolprices.com/Sweden/.
[19]H. Langels and O. Syrjä. (2021). “Hydrogen production and storage optimization based on technical and financial conditions: a study of hydrogen strategies focusing on demand and integration of wind power”. [Online].
Available: https://www.diva-portal.org/smash/record.jsf?pid=diva2:1530360.
[20]M. Rabe. (2021)”. 100-Tals Miljoner till Svensk Satsning På Vätgasstationer.” Teknikens Värld, 13 december. [Online]. Available: https://teknikensvarld.expressen.se/nyheter/miljo-och- teknik/100-tals-miljoner-till-svensk-satsning-pa-vatgasstationer/.
[21]M. J. Palys, P. Daoutidis. (2022). “Power-To-X: A Review and Perspective”. Computers & Chemical Engineering, vol. 165. [Online]. Available: https://doi.org/10.1016/j.compchemeng.2022.107948.
[22]M. Mahapatra, P. Singh. (2013). “Fuel Cells. Future Energy”. [Online].
Available: https://doi.org/10.1016/b978-0-08-099424-6.00024-7.
[23]T. Tsoutsos. (2010). Hybrid wind–hydrogen energy systems. [Online]. Available: https://www.sciencedirect.com/science/article/pii/B9781845695279500081?via%3Dihub.
[24]Svenska Kraftnät. (2021). ” Uträkning av stödnivåer till elområde 3 och 4 (oktober 2021 – september 2022)”. [Online]. Available: https://svk.se/stod-till-elanvandare/elstod-till- privatpersoner-elomrade-3-och-4/utrakning-av-stodnivaer-elomrade-3-och-4/
[25]Svenska Kraftnät. “Mimer”. [Online]. Available: https://mimer.svk.se/ProductionConsumption/ProductionIndex.
[26]Elrpiser24. “Spotpriser på el”. (2022). [Online]. Available: https://elpriser24.se/spotpris/.
[27]WindEurope. “Wind Energy in Europe: 2022 Statistics and the Outlook for 2023–2027”. (2023). [Online]. Available: https://windeurope.org/intelligence-platform/product/wind-energy- in-europe-2022-statistics-and-the-outlook-for-2023-2027/.
[28]R. Puertas, M. Luisa. (2022)”. Renewable Energy Production Capacity and Consumption in Europe”. Science of the Total Environment, vol. 853. [Online].
Available: https://doi.org/10.1016/j.scitotenv.2022.158592.
[29]IEA. (2019). “Africa Energy Outlook 2019”. [Online].
Available: www.iea.org/reports/africa-energy-outlook-2019.
[30]S. Hussain, Siyal. (2019). “Techno-Economic Assessment of Wind Energy for Renewable
Hydrogen Production in Sweden”.
[31]Eon. (2023). “Så Fungerar Sveriges Elnät.” [Online].
Available: https://www.eon.se/artiklar/sa-fungerar-elnaetet.
[32]A. Wegener. (2007). “Nätanslutning av vindkraft,” no. 489.
[33]E. Effektavgiften and E. Energiavgiften. (2021). “TRANSMISSIONSNÄTET”.
[34]E. Effektavgiften and E. Energiavgiften. (2022). “TRANSMISSIONSNÄTET”.
[35]M. Kindmark. (2022). “Lokaliseringens och tidpunktens inverkan på ersättning vid inmatning av el”. En utvärdering av Metod 2020.
[36]J. Moore, et al. (2022). “Chapter 9 - Compressors and Expanders”. Machinery and Energy Systems for the Hydrogen Economy. [Online]. Available: https://doi.org/10.1016/B978-0-323- 90394-3.00002-3.
68