

Public Disclosure Authorized
Public Disclosure Authorized Public Disclosure Authorized
Public Disclosure Authorized
April 2014
Poverty Reduction and Economic
Management, South Asia Region
The World Bank

Table of Contents |
|
Summary ........................................................................................................................................ |
3 |
Recent Economic Developments ................................................................................................... |
4 |
Economic Outlook and Medium-term Prospects ........................................................................ |
18 |
Structural Policies for the Medium Term .................................................................................... |
20 |
Annex 1: World Bank Group Assistance to Afghanistan.............................................................. |
23 |
Annex 2: The Afghan Economy at a Glance ................................................................................. |
25 |
Annex 3: Selected Economic Indicators....................................................................................... |
26 |
This report was prepared by Omar Joya (Economist, SASEP) and Faruk Khan (Lead Economist,
SASEP), with useful inputs from the wider country team.
The authors gratefully acknowledge comments and suggestions received from Claudia Nassif, Silvia Redaelli, and Deepak Bhattasali. This report was prepared under the overall guidance of Vinaya Swaroop (Sector Manager), Ernesto May (Sector Director), and Robert Saum (Country Director).
The authors also gratefully acknowledge the cooperation and suggestions received from the Afghan authorities.
2 | P a g e

Summary
Economic growth slowed considerably in 2013 despite robust agricultural production as heightened uncertainty surrounding the political and security transition led to a slump in investor and consumer confidence. Agricultural output reached record levels for a second consecutive year in 2013 due to favorable weather conditions, with cereals production increasing 2.7 percent over the bumper crop of 2012. On the other hand, uncertainty surrounding the political and security transition led to a slump in investor and consumer confidence, thus resulting in a sharp slowdown in private investment and growth in the non-agricultural sectors. Economic growth in 2013 is estimated at 3.6 percent, down sharply from strong growth of 14.4 percent in 2012. Uncertainty remains over the security outlook after most international forces withdraw in 2014 and over whether a cohesive and broadly accepted government will take hold within a reasonable period of time following the April 2014 elections. Growth is projected to remain weak in 2014. A smooth political and security transition would help restore confidence in the economy and enable a pickup in growth in 2015.
Revenue collection weakened in 2013, while Afghanistan’s large security expenditure obligations and high aid dependence pose the risk of crowding out important civilian operating and development spending. After a decade of strong revenue growth, domestic revenues declined to 9.5 percent of GDP in 2013 from 10.3 percent in 2012 and the peak of 11.6 percent in 2011. In nominal terms, revenues amounted to Afs 109 billion in 2013, almost level with the pro-rated figure for 2012. The decline in revenue collections is a result of the economic slowdown as well as weaknesses in enforcement in both tax and customs administration. In order to preserve fiscal sustainability, a concerted effort will be required going forward to improve revenue mobilization by strengthening tax and customs enforcement and by expediting introduction and implementation of the planned value-added tax. At the same time, given Afghanistan’s extraordinary security expenditure obligations, safeguarding important civilian operating and development expenditures is a priority. As security expenditures have continued to grow, austerity measures in 2013 disproportionately affected civilian expenditures and the 2014 budget projects a considerable further increase in recurrent security expenditures.
In spite of the transition-related uncertainty and underperformance, Afghanistan will need to stay focused on its medium term structural reform goals. These include: (i) Ensuring fiscal sustainability by mobilizing revenue, securing grant assistance, and safeguarding non-security expenditures; (ii) supporting inclusive and job-creating private-sector led growth by unlocking the potential of the agriculture, services, and natural resource sectors and by tapping the potential of regional integration; (iii) improving upon the still low levels of human capital and skills; and (iv) continuing to strengthen institutions and governance. Reforms in these areas will be critical to reducing poverty and promoting shared prosperity through sustainable development while helping Afghanistan become more self-reliant in the long term.
3 | P a g e
Recent Economic Developments
Economic growth slowed considerably in 2013 due to increased uncertainty, despite robust agricultural output.
After rapid growth in 2012, economic growth slowed considerably in 2013 with heightened uncertainty leading to a sharp slowdown in the non-agriculture sectors. Real (non-opium) GDP growth is estimated to have slowed sharply from 14.4 percent in 2012 to 3.6 percent in 2013. Growth in 2012 benefited from an exceptional agricultural harvest and rapid growth in the services sector. While
agricultural |
|
output |
in |
2013 |
|
|
Figure 1: Growth of real GDP and output |
|
|||||||||||||||||||||||||||||||||||||||||||||||||||||||||||||||
exceeded |
even |
the |
bumper |
|
|
|
|||||||||||||||||||||||||||||||||||||||||||||||||||||||||||||||||
|
|
|
|
|
|
|
|
|
|
|
|
|
|
|
|
|
|
|
|
|
|
|
|
sectors |
|
|
|
|
|
|
|
|
|
|
|
|
|
|
|
|
|
|
|
|
|
|
|
||||||||||||||||||||||||
harvest |
of |
2012, |
increased |
|
|
|
|
|
|
|
|
|
|
|
|
|
|
|
|
|
|
|
|
|
|
|
|
|
|
|
|
|
|
|
|
|
|
|
|
|
|
|
|
|
|
|
|
|
|
|
|||||||||||||||||||||
|
45.0 |
|
|
|
|
|
|
|
|
|
|
|
|
|
|
|
|
|
|
|
|
|
|
|
|
|
|
|
|
|
|
|
|
|
|
|
|
|
|
|
|
|
|
|
|
|
|
|
|
|
|
|
|
|
|
|
|
|
|
|
|
||||||||||
uncertainty |
|
surrounding |
the |
|
|
|
|
|
|
|
|
|
|
|
|
|
|
|
|
|
|
|
|
|
|
|
|
|
|
|
|
|
|
|
|
|
|
|
|
|
|
|
|
|
|
|
|
|
|
|
|
|
|
|
|
|
|
|
|
|
|
|
|
|
|||||||
|
|
|
|
|
|
|
|
|
|
|
|
|
|
|
|
|
|
|
|
|
|
|
|
|
|
|
|
|
|
|
|
|
|
|
|
|
|
|
|
|
|
|
|
|
|
|
|
|
|
|
|
|
|
|
|
|
|
|
|
|
|||||||||||
political |
and |
security |
transition |
|
30.0 |
|
|
|
|
|
|
|
|
|
|
|
|
|
|
|
|
|
|
|
|
|
|
|
|
|
|
|
|
|
|
|
|
|
|
|
|
|
|
|
|
|
|
|
|
|
|
|
|
|
|
|
|
|
|
|
|
|
|
|
|
||||||
|
|
|
|
|
|
|
|
|
|
|
|
|
|
|
|
|
|
|
|
|
|
|
|
|
|
|
|
|
|
|
|
|
|
|
|
|
|
|
|
|
|
|
|
|
|
|
|
|
|
|
|
|
|
|
|
|
|
|
|
||||||||||||
has led to |
a slump in investor |
Percent |
15.0 |
|
|
|
|
|
|
|
|
|
|
|
|
|
|
|
|
|
|
|
|
|
|
|
|
|
|
|
|
|
|
|
|
|
|
|
|
|
|
|
|
|
|
|
|
|
|
|
|
|
|
|
|
|
|
|
|
|
|
|
|
||||||||
and |
consumer confidence |
and |
|
|
|
|
|
|
|
|
|
|
|
|
|
|
|
|
|
|
|
|
|
|
|
|
|
|
|
|
|
|
|
|
|
|
|
|
|
|
|
|
|
|
|
|
|
|
|
|
|
|
|
|
|
|
|
|
|
|
|
|
|||||||||
|
|
|
|
|
|
|
|
|
|
|
|
|
|
|
|
|
|
|
|
|
|
|
|
|
|
|
|
|
|
|
|
|
|
|
|
|
|
|
|
|
|
|
|
|
|
|
|
|
|
|
|
|
|
|
|
|
|
|
|||||||||||||
|
|
|
|
|
|
|
|
|
|
|
|
|
|
|
|
|
|
|
|
|
|
|
|
|
|
|
|
|
|
|
|
|
|
|
|
|
|
|
|
|
|
|
|
|
|
|
|
|
|
|
|
|
|
|
|
|
|
|
|
|
|
||||||||||
resulted in a sharp slowdown in |
0.0 |
|
|
|
|
|
|
|
|
|
|
|
|
|
|
|
|
|
|
|
|
|
|
|
|
|
|
|
|
|
|
|
|
|
|
|
|
|
|
|
|
|
|
|
|
|
|
|
|
|
|
|
|
|
|
|
|
|
|
|
|
||||||||||
|
|
|
|
|
|
|
|
|
|
|
|
|
|
|
|
|
|
|
|
|
|
|
|
|
|
|
|
|
|
|
|
|
|
|
|
|
|
|
|
|
|
|
|
|
|
|
|
|
|
|
|
|
|
|
|
|
|
|
|||||||||||||
the |
non-agricultural |
sectors. |
|
-15.0 |
|
|
|
|
|
|
|
|
|
|
|
|
|
|
|
|
|
|
|
|
|
|
|
|
|
|
|
|
|
|
|
|
|
|
|
|
|
|
|
|
|
|
|
|
|
|
|
|
|
|
|
|
|
|
|
|
|
|
|
|
|||||||
Agriculture accounts for about a |
|
|
|
|
|
|
|
|
|
|
|
|
|
|
|
|
|
|
|
|
|
|
|
|
|
|
|
|
|
|
|
|
|
|
|
|
|
|
|
|
|
|
|
|
|
|
|
|
|
|
|
|
|
|
|
|
|
|
|
|
|
||||||||||
|
|
|
|
|
|
|
|
|
|
|
|
|
|
|
|
|
|
|
|
|
|
|
|
|
|
|
|
|
|
|
|
|
|
|
|
|
|
|
|
|
|
|
|
|
|
|
|
|
|
|
|
|
|
|
|
|
|
|
|
||||||||||||
|
|
|
|
|
|
|
|
|
|
|
|
|
|
|
|
|
|
|
|
|
|
|
|
|
|
|
|
|
|
|
|
|
|
|
|
|
|
|
|
|
|
|
|
|
|
|
|
|
|
|
|
|
|
|
|
|
|
|
|
|
|
|
|||||||||
quarter |
of |
GDP |
|
(excluding |
|
-30.0 |
|
|
|
|
|
|
|
|
|
|
|
|
|
|
|
|
|
|
|
|
|
|
|
|
|
|
|
|
|
|
|
|
|
|
|
|
|
|
|
|
|
|
|
|
|
|
|
|
|
|
|
|
|
|
|
|
|
|
|
|
|||||
|
|
|
|
|
|
|
|
|
|
|
|
|
|
|
|
|
|
|
|
|
|
|
|
|
|
|
|
|
|
|
|
|
|
|
|
|
|
|
|
|
|
|
|
|
|
|
|
|
|
|
|
|
|
|
|
|
|
|
|
|
|||||||||||
opium) and also has strong links |
|
|
|
|
|
|
|
|
|
|
|
|
|
|
|
|
|
|
|
|
|
|
|
|
|
|
|
|
|
|
|
|
|
|
|
|
|
|
|
|
|
|
|
|
|
|
|
|
|
|
|
|
|
|
|
|
|
|
|
|
|
|
|
||||||||
to the rest of the economy, so |
|
|
|
|
|
|
|
|
|
|
|
|
|
|
|
|
|
|
|
|
|
|
|
|
|
|
|
|
|
|
|
|
|
|
|
|
|
|
|
|
|
|
|
|
|
|
|
|
|
|
|
|
|
|
|
|
|
|
|
|
|
|
|
||||||||
that |
the |
robust |
agricultural |
|
|
|
|
|
|
|
Real GDP growth |
|
|
|
|
|
Agriculture growth |
|
|||||||||||||||||||||||||||||||||||||||||||||||||||||
|
|
|
|
|
|
|
|
|
|
|
|
|
|||||||||||||||||||||||||||||||||||||||||||||||||||||||||||
output in 2013 would normally |
|
|
|
|
|
|
|
Services growth |
|
|
|
Industries growth |
|
||||||||||||||||||||||||||||||||||||||||||||||||||||||||||
have |
|
buoyed |
overall |
GDP |
|
|
|
|
|
|
|
|
|
|
|
||||||||||||||||||||||||||||||||||||||||||||||||||||||||
|
|
Source: CSO |
|
|
|
|
|
|
|
|
|
|
|
|
|
|
|
|
|
|
|
|
|
|
|
|
|
|
|
|
|
|
|
|
|
|
|
|
|
|
|
|
|
|
|
|
|
|
|
|
|
|
|||||||||||||||||||
growth. |
However, |
with |
the |
|
|
|
|
|
|
|
|
|
|
|
|
|
|
|
|
|
|
|
|
|
|
|
|
|
|
|
|
|
|
|
|
|
|
|
|
|
|
|
|
|
|
|
|
|
|
|
|
|
|
|
|||||||||||||||||
|
|
|
|
|
|
|
|
|
|
|
|
|
|
|
|
|
|
|
|
|
|
|
|
|
|
|
|
|
|
|
|
|
|
|
|
|
|
|
|
|
|
|
|
|
|
|
|
|
|
|
|
|
|
|
|
|
|
|
|
|
|
|
|||||||||
services |
|
and |
|
construction |
|
Figure 2: Sector contributions to GDP growth, |
|
||||||||||||||||||||||||||||||||||||||||||||||||||||||||||||||||
sectors |
particularly |
hard hit by |
|
|
|||||||||||||||||||||||||||||||||||||||||||||||||||||||||||||||||||
|
|
|
|
|
|
|
|
|
|
|
|
|
|
|
|
|
|
2005-2013 |
|
|
|
|
|
|
|
|
|
|
|
|
|
|
|
|
|
|
|
|
|
|
|
|
|
|
|
|
|||||||||||||||||||||||||
the slump in confidence, 2013 |
|
|
|
|
|
|
|
|
|
|
|
|
|
|
|
|
|
|
|
|
|
|
|
|
|
|
|
|
|
|
|
|
|
|
|
|
|
|
|
|
|
|
|
|
|
|
|||||||||||||||||||||||||
|
|
|
|
|
|
|
|
|
|
|
|
|
|
|
|
|
|
|
|
|
|
|
|
|
|
|
|
|
|
|
|
|
|
|
|
|
|
|
|
|
|
|
|
|
|
|
|
|
|
|
|
|
|
|
|
|
|
|
|
|
|
|
|||||||||
would mark the first year that a |
|
25.0 |
|
|
|
|
|
|
|
|
|
|
|
|
|
|
|
|
|
|
|
|
|
|
|
|
|
|
|
|
|
|
|
|
|
|
|
|
|
|
|
|
|
|
|
|
|
|
|
|
|
|
|
|
|
|
|
|
|
|
|
|
|||||||||
|
|
|
|
|
|
|
|
|
|
|
|
|
|
|
|
|
|
|
|
|
|
|
|
|
|
|
|
|
|
|
|
|
|
|
|
|
|
|
|
|
|
|
|
|
|
|
|
|
|
|
|
|
|
|
|
|
|
|
|
|
|||||||||||
bumper agricultural output has |
|
20.0 |
|
|
|
|
|
|
|
|
|
|
|
|
|
|
|
|
|
|
|
|
|
|
|
|
|
|
|
|
|
|
|
|
|
|
|
|
|
|
|
|
|
|
|
|
|
|
|
|
|
|
|
|
|
|
|
|
|
|
|
|
|||||||||
|
|
|
|
|
|
|
|
|
|
|
|
|
|
|
|
|
|
|
|
|
|
|
|
|
|
|
|
|
|
|
|
|
|
|
|
|
|
|
|
|
|
|
|
|
|
|
|
|
|
|
|
|
|
|
|
|
|
|
|
|
|||||||||||
been |
accompanied |
by overall |
Percent |
15.0 |
|
|
|
|
|
|
|
|
|
|
|
|
|
|
|
|
|
|
|
|
|
|
|
|
|
|
|
|
|
|
|
|
|
|
|
|
|
|
|
|
|
|
|
|
|
|
|
|
|
|
|
|
|
|
|
|
|
|
|
|
|||||||
|
|
|
|
|
|
|
|
|
|
|
|
|
|
|
|
|
|
|
|
|
|
|
|
|
|
|
|
|
|
|
|
|
|
|
|
|
|
|
|
|
|
|
|
|
|
|
|
|
|
|
|
|
|
|
|
|
|
|
|
||||||||||||
GDP growth under 5 percent. |
10.0 |
|
|
|
|
|
|
|
|
|
|
|
|
|
|
|
|
|
|
|
|
|
|
|
|
|
|
|
|
|
|
|
|
|
|
|
|
|
|
|
|
|
|
|
|
|
|
|
|
|
|
|
|
|
|
|
|
|
|
|
|
||||||||||
|
|
|
|
|
|
|
|
|
|
|
|
|
|
|
|
|
|
|
|
|
|
|
|
|
|
|
|
|
|
|
|
|
|
|
|
|
|
|
|
|
|
|
|
|
|
|
|
|
|
|
|
|
|
|
|
|
|
|
|
||||||||||||
Agricultural |
|
output |
in |
2013 |
5.0 |
|
|
|
|
|
|
|
|
|
|
|
|
|
|
|
|
|
|
|
|
|
|
|
|
|
|
|
|
|
|
|
|
|
|
|
|
|
|
|
|
|
|
|
|
|
|
|
|
|
|
|
|
|
|
|
|
|
|
|
|
||||||
|
|
|
|
|
|
|
|
|
|
|
|
|
|
|
|
|
|
|
|
|
|
|
|
|
|
|
|
|
|
|
|
|
|
|
|
|
|
|
|
|
|
|
|
|
|
|
|
|
|
|
|
|
|
|
|
|
|
|
|
|
|||||||||||
|
|
|
|
|
|
|
|
|
|
|
|
|
|
|
|
|
|
|
|
|
|
|
|
|
|
|
|
|
|
|
|
|
|
|
|
|
|
|
|
|
|
|
|
|
|
|
|
|
|
|
|
|
|
|
|
|
|
|
|
|
|
|
|||||||||
|
|
0.0 |
|
|
|
|
|
|
|
|
|
|
|
|
|
|
|
|
|
|
|
|
|
|
|
|
|
|
|
|
|
|
|
|
|
|
|
|
|
|
|
|
|
|
|
|
|
|
|
|
|
|
|
|
|
|
|
|
|
|
|
|
|||||||||
reached record levels for a |
|
|
|
|
|
|
|
|
|
|
|
|
|
|
|
|
|
|
|
|
|
|
|
|
|
|
|
|
|
|
|
|
|
|
|
|
|
|
|
|
|
|
|
|
|
|
|
|
|
|
|
|
|
|
|
|
|
|
|
|
|
||||||||||
|
-5.0 |
|
|
|
|
|
|
|
|
|
|
|
|
|
|
|
|
|
|
|
|
|
|
|
|
|
|
|
|
|
|
|
|
|
|
|
|
|
|
|
|
|
|
|
|
|
|
|
|
|
|
|
|
|
|
|
|
|
|
|
|
||||||||||
second consecutive year as a |
|
|
|
|
|
|
|
|
|
|
|
|
|
|
|
|
|
|
|
|
|
|
|
|
|
|
|
|
|
|
|
|
|
|
|
|
|
|
|
|
|
|
|
|
|
|
|
|
|
|
|
|
|
|
|
|
|
|
|
|
|
||||||||||
|
|
|
|
|
|
|
|
|
|
|
|
|
|
|
|
|
|
|
|
|
|
|
|
|
|
|
|
|
|
|
|
|
|
|
|
|
|
|
|
|
|
|
|
|
|
|
|
|
|
|
|
|
|
|
|
|
|
|
|
|
|||||||||||
result |
of |
favorable |
weather |
|
-10.0 |
|
|
|
|
|
|
|
|
|
|
|
|
|
|
|
|
|
|
|
|
|
|
|
|
|
|
|
|
|
|
|
|
|
|
|
|
|
|
|
|
|
|
|
|
|
|
|
|
|
|
|
|
|
|
|
|
|
|
|
|
||||||
|
|
|
|
|
|
|
|
|
|
|
|
|
|
|
|
|
|
|
|
|
|
|
|
|
|
|
|
|
|
|
|
|
|
|
|
|
|
|
|
|
|
|
|
|
|
|
|
|
|
|
|
|
|
|
|
|
|
|
|
|
|||||||||||
conditions. |
|
Cereals production |
|
2005 |
|
|
2006 |
2007 |
2008 |
|
2009 |
|
|
2010 |
2011 |
|
2012 2013p |
|
|||||||||||||||||||||||||||||||||||||||||||||||||||||
|
|
|
|
|
|
|
|
|
|
|
|
|
|
|
|
|
|
|
|
|
|
|
|
|
|
|
|
|
|
|
|
|
|
|
|
|
|
|
|
|
|
|
|
|
|
|
|
|
|
|
|
|
|
|
|
|
|
|
|
|
|
|
|
||||||||
in 2013 is estimated at 6.5 |
|
|
|
|
|
|
|
|
|
|
Agriculture |
|
|
|
|
Industries |
|
|
Services |
|
|
|
|
|
|
|
|
|
|
|
|
||||||||||||||||||||||||||||||||||||||||
|
|
|
|
|
|
|
|
|
|
|
|
|
|
|
|
|
|
|
|
|
|
|
|
|
|
|
|
||||||||||||||||||||||||||||||||||||||||||||
|
|
|
|
|
|
|
|
|
|
|
|
|
|
|
|
|
|
|
|
|
|
|
|
|
|
|
|
||||||||||||||||||||||||||||||||||||||||||||
million |
metric |
tonnes, |
an |
|
Source: CSO and Bank staff estimates |
|
|
|
|
|
|
|
|
|
|
|
|
|
|
|
|
|
|
||||||||||||||||||||||||||||||||||||||||||||||||
increase by 2.7 percent over the |
|
|
|
|
|
|
|
|
|
|
|
|
|
|
|
|
|
|
|
||||||||||||||||||||||||||||||||||||||||||||||||||||
|
|
|
|
|
|
|
|
|
|
|
|
|
|
|
|
|
|
|
|
|
|
|
|
|
|
|
|
|
|
|
|
|
|
|
|
|
|
|
|
|
|
|
|
|
|
|
|
|
|
|
|
|
|
|
|
|
|
|
|
|
|
|
|||||||||
4 | P a g e

previous year and the highest level achieved over the past decade. Wheat production increased by 2.4 percent to 5.2 million metric tonnes, with both irrigated and rainfed production increasing further from the surge in 2012 (see Table 1). Other cereals such as rice, maize and barley also had higher yield compared to previous year. Given favorable precipitation particularly for the second harvest season in the year, the Ministry of Agriculture, Irrigation and Livestock (MAIL) also estimates very favorable horticulture – particularly fruits – and livestock output in 2013. While the record agriculture output in 2013 helped to counterbalance the overall confidence shock to the economy, it was up only modestly over the bumper harvest of 2012 and was thus not sufficient to fully circumvent the overall slowdown in GDP growth (see Figure 2).
Table 1: Cereals production in the past 5 years (thousand metric tonnes)
|
|
2009 |
|
2010 |
|
2011 |
|
2012 |
|
2013 |
|
|
|
|
|
|
|
|
|||||
Wheat |
5,115 |
4,532 |
3,388 |
5,050 |
5,169 |
|
|||||
Irrigated |
3,433 |
3,082 |
3,067 |
3,460 |
3,518 |
|
|||||
Rainfed |
1,682 |
1,450 |
321 |
1,590 |
1,651 |
|
|||||
Other cereals |
1,218 |
1,056 |
1,056 |
1,286 |
1,338 |
|
|||||
Total cereals |
6,333 |
5,588 |
4,444 |
6,336 |
6,507 |
|
|||||
Source: Agriculture Prospects Report, MAIL
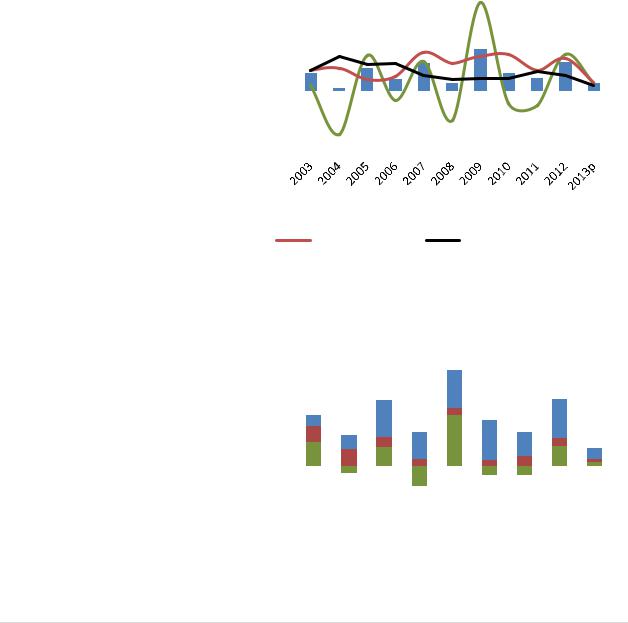
Private investment and growth in construction, manufacturing, and services slowed considerably in 2013 due to increased uncertainty. Heightened uncertainty about the political and security transition affected investor decisions to commit resources in Afghanistan in 2013. The number of new firm registrations fell sharply in 2013 to its lowest level in five years, with a reduction in both local and foreign new fixed investments
(Figure |
3). |
The Afghanistan |
|
|
Figure 3: New firm registrations since 2003, by |
|
|
|
|
|
||||||||||||||||||||||||||||||||||||
Investment |
Support |
Agency |
|
|
|
|
|
|
|
|
|
|
source of investment |
|
|
|
|
|
|
|
|
|
|
|
|
|
||||||||||||||||||||
|
|
|
|
|
|
|
|
|
|
|
|
|
|
|
|
|
|
|
|
|
|
|
|
|
|
|
|
|
|
|
|
|
|
|
|
|
|
|
|
|
|
|||||
(AISA) |
|
registered |
7,000 |
|
|
|
|
|
|
|
|
|
|
|
|
|
|
|
|
|
|
|
|
|
|
|
|
|
|
|
|
|
|
|
|
|
|
|
|
|
|
|
|
|
||
|
|
|
|
|
|
|
|
|
|
|
|
|
|
|
|
|
|
|
|
|
|
|
|
|
|
|
|
|
|
|
|
|
|
|
|
|
|
|
|
|
|
|||||
approximately |
3,100 |
6,000 |
|
|
|
|
|
|
|
|
|
|
|
|
|
|
|
|
|
|
|
|
|
|
|
|
|
|
|
|
|
|
|
|
|
|
|
|
|
|
|
|
|
|||
|
|
|
|
|
|
|
|
|
|
|
|
|
|
|
|
|
|
|
|
|
|
|
|
|
|
|
|
|
|
|
|
|
|
|
|
|
|
|
|
|
||||||
enterprises in 2013, down 38 |
5,000 |
|
|
|
|
|
|
|
|
|
|
|
|
|
|
|
|
|
|
|
|
|
|
|
|
|
|
|
|
|
|
|
|
|
|
|
|
|
|
|
|
|
||||
|
|
|
|
|
|
|
|
|
|
|
|
|
|
|
|
|
|
|
|
|
|
|
|
|
|
|
|
|
|
|
|
|
|
|
|
|
|
|
|
|
||||||
percent from around 5,000 in |
4,000 |
|
|
|
|
|
|
|
|
|
|
|
|
|
|
|
|
|
|
|
|
|
|
|
|
|
|
|
|
|
|
|
|
|
|
|
|
|
|
|
|
|
||||
2012. The reduction in new |
|
|
|
|
|
|
|
|
|
|
|
|
|
|
|
|
|
|
|
|
|
|
|
|
|
|
|
|
|
|
|
|
|
|
|
|
|
|
|
|
|
|||||
3,000 |
|
|
|
|
|
|
|
|
|
|
|
|
|
|
|
|
|
|
|
|
|
|
|
|
|
|
|
|
|
|
|
|
|
|
|
|
|
|
|
|
|
|||||
firm registrations in 2013 has |
|
|
|
|
|
|
|
|
|
|
|
|
|
|
|
|
|
|
|
|
|
|
|
|
|
|
|
|
|
|
|
|
|
|
|
|
|
|
|
|
|
|||||
2,000 |
|
|
|
|
|
|
|
|
|
|
|
|
|
|
|
|
|
|
|
|
|
|
|
|
|
|
|
|
|
|
|
|
|
|
|
|
|
|
|
|
|
|||||
taken place across all sectors, |
|
|
|
|
|
|
|
|
|
|
|
|
|
|
|
|
|
|
|
|
|
|
|
|
|
|
|
|
|
|
|
|
|
|
|
|
|
|
|
|
|
|||||
|
|
|
|
|
|
|
|
|
|
|
|
|
|
|
|
|
|
|
|
|
|
|
|
|
|
|
|
|
|
|
|
|
|
|
|
|
|
|
|
|
||||||
1,000 |
|
|
|
|
|
|
|
|
|
|
|
|
|
|
|
|
|
|
|
|
|
|
|
|
|
|
|
|
|
|
|
|
|
|
|
|
|
|
|
|
|
|||||
with |
construction |
and |
|
|
|
|
|
|
|
|
|
|
|
|
|
|
|
|
|
|
|
|
|
|
|
|
|
|
|
|
|
|
|
|
|
|
|
|
|
|
|
|
|
|||
|
|
|
|
|
|
|
|
|
|
|
|
|
|
|
|
|
|
|
|
|
|
|
|
|
|
|
|
|
|
|
|
|
|
|
|
|
|
|
|
|
||||||
- |
|
|
|
|
|
|
|
|
|
|
|
|
|
|
|
|
|
|
|
|
|
|
|
|
|
|
|
|
|
|
|
|
|
|
|
|
|
|
|
|
|
|||||
services |
particularly |
hard |
hit |
|
|
|
|
|
|
|
|
|
|
|
|
|
|
|
|
|
|
|
|
|
|
|
|
|
|
|
|
|
|
|
|
|
|
|
|
|
|
|
|
|
||
|
|
|
|
2005 |
2006 |
2007 |
|
2008 |
2009 |
2010 |
2011 |
|
2012 |
2013 |
|
|||||||||||||||||||||||||||||||
(Figure 4). Although no high- |
2004 |
|
|
|
||||||||||||||||||||||||||||||||||||||||||
|
|
|
|
|
|
|
|
|
|
|
|
|
|
|
|
|
|
|
|
|
|
|
|
|
|
|
|
|
|
|
|
|
|
|
|
|
|
|
|
|
|
|||||
frequency data are |
available |
|
|
|
|
|
Local investments |
|
|
|
Foreign investments |
|
|
|
|
|
|
|
|
|||||||||||||||||||||||||||
|
|
|
|
|
|
|
|
|
|
|
|
|
|
|
|
|||||||||||||||||||||||||||||||
|
|
|
|
|
|
|
|
|
|
|
|
|
|
|
|
|||||||||||||||||||||||||||||||
on firm inventories and gross |
Source: AISA |
|
|
|
|
|
|
|
|
|
|
|
|
|
|
|
|
|
|
|
|
|
|
|
|
|
|
|
|
|
|
|
|
|
|
|||||||||||
fixed capital |
formation, new |
|
|
|
|
|
|
|
|
|
|
|
|
|
|
|
|
|
|
|
|
|
|
|
|
|
|
|
|
|
|
|
|
|
|
|||||||||||
|
|
|
|
|
|
|
|
|
|
|
|
|
|
|
|
|
|
|
|
|
|
|
|
|
|
|
|
|
|
|
|
|
|
|
|
|
|
|
|
|
|
|||||
firm registrations should be a relatively good proxy for business confidence and investment activity in the private sector. Decisions to establish new fixed investments in Afghanistan or to expand existing
5 | P a g e
investments, horizontally (expanding existing products) or vertically (investing in the supply chain), are highly sensitive to confidence in market conditions and the political environment. The number of new firm registrations would particularly reflect new fixed investments and vertical investments in the economy. Though this is a not a perfect proxy for level of economic activity, it can fairly reflect the level of confidence of both local and foreign investors.
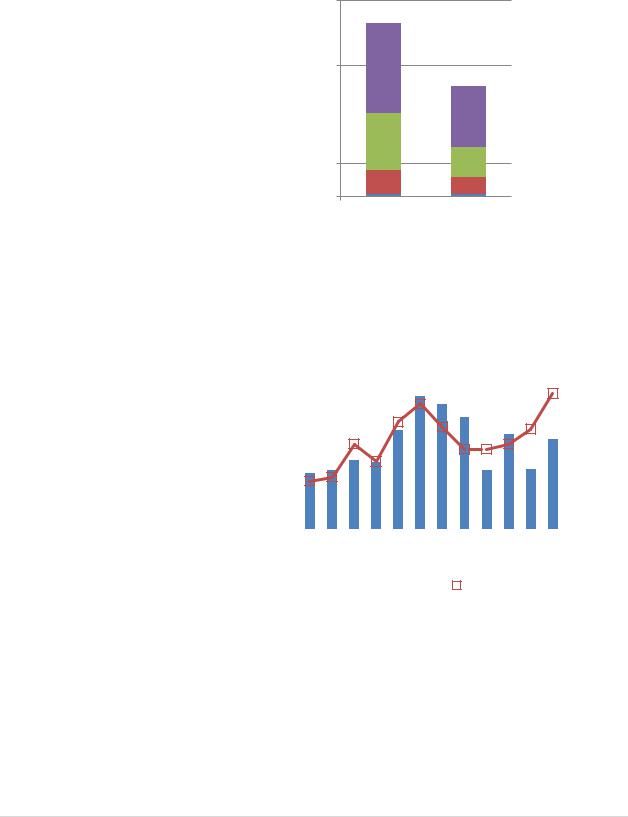
Figure 4: Number of new firms registered in 2012 and 2013 by sectors
6,000
5,000 |
|
|
|
|
|
|
|
|
|
|
|
|
|
4,000 |
2,715 |
|
|
|
|
Services |
|
|
|
|
|||
|
|
|
|
|
||
3,000 |
|
|
|
|
|
Construction |
|
|
|
|
|
||
|
1,857 |
|||||
|
|
|
||||
2,000 |
|
|
|
Industries |
||
|
|
|
||||
|
|
|
||||
|
|
|
|
|
|
|
1,759 |
899 |
|
|
Agriculture |
||
1,000 |
|
|
||||
|
|
|||||
|
|
|||||
725 |
|
|
|
|||
|
536 |
|
|
|
||
- |
95 |
|
76 |
|
|
|
|
|
|
|
|||
|
2012 |
2013 |
|
|
|
|
Source: AISA
Both opium production and area under poppy cultivation increased considerably in 2013, although this is not reflected in estimated non-opium GDP growth figures for 2013. According to UNODC data,
opium production increased by |
|
Figure 5: Opium production and area under |
|
|||||||||||||||||||||||||||||||||||||||||||||||||||||||||
almost 50 percent to 5,500 tons |
|
|
||||||||||||||||||||||||||||||||||||||||||||||||||||||||||
in 2013, while the total area |
|
10,000 |
|
|
|
|
|
|
|
|
|
|
|
|
|
poppy cultivation |
|
|
|
|
|
|
|
|
|
|
|
|
|
250 |
|
|||||||||||||||||||||||||||||
|
|
|
|
|
|
|
|
|
|
|
|
|
|
|
|
|
|
|
|
|
|
|
|
|
|
|
|
|
|
|
|
|
|
|
|
|
|
|
|
|
|
|
|
|
|
|
|
|
|
|
|
|
||||||||
under |
poppy |
cultivation |
Metric tonnes |
8,000 |
|
|
|
|
|
|
|
|
|
|
|
|
|
|
|
|
|
|
|
|
|
|
|
|
|
|
|
|
|
|
|
|
|
|
|
|
|
|
|
|
|
|
|
|
|
|
|
|
|
|
|
200 |
Thousand Hectares |
|||
expanded by 36 percent to |
|
|
|
|
|
|
|
|
|
|
|
|
|
|
|
|
|
|
|
|
|
|
|
|
|
|
|
|
|
|
|
|
|
|
|
|
|
|
|
|
|
|
|
|
|
|
|
|
|
|
|
|||||||||
|
|
|
|
|
|
|
|
|
|
|
|
|
|
|
|
|
|
|
|
|
|
|
|
|
|
|
|
|
|
|
|
|
|
|
|
|
|
|
|
|
|
|
|
|
|
|
|
|
|
|
||||||||||
209,000 |
hectares |
(Figure |
5). |
6,000 |
|
|
|
|
|
|
|
|
|
|
|
|
|
|
|
|
|
|
|
|
|
|
|
|
|
|
|
|
|
|
|
|
|
|
|
|
|
|
|
|
|
|
|
|
|
|
|
|
|
|
|
150 |
||||
|
|
|
|
|
|
|
|
|
|
|
|
|
|
|
|
|
|
|
|
|
|
|
|
|
|
|
|
|
|
|
|
|
|
|
|
|
|
|
|
|
|
|
|
|
|
|
|
|
|
|
||||||||||
|
|
|
|
|
|
|
|
|
|
|
|
|
|
|
|
|
|
|
|
|
|
|
|
|
|
|
|
|
|
|
|
|
|
|
|
|
|
|
|
|
|
|
|
|
|
|
|
|
|
|
||||||||||
Opium |
production |
in |
2013 |
|
|
|
|
|
|
|
|
|
|
|
|
|
|
|
|
|
|
|
|
|
|
|
|
|
|
|
|
|
|
|
|
|
|
|
|
|
|
|
|
|
|
|
|
|
|
|
|
|
|
|
||||||
4,000 |
|
|
|
|
|
|
|
|
|
|
|
|
|
|
|
|
|
|
|
|
|
|
|
|
|
|
|
|
|
|
|
|
|
|
|
|
|
|
|
|
|
|
|
|
|
|
|
|
|
|
|
100 |
||||||||
|
|
|
|
|
|
|
|
|
|
|
|
|
|
|
|
|
|
|
|
|
|
|
|
|
|
|
|
|
|
|
|
|
|
|
|
|
|
|
|
|
|
|
|
|
|
|
|
|
|
|
||||||||||
appears to have recovered from |
|
|
|
|
|
|
|
|
|
|
|
|
|
|
|
|
|
|
|
|
|
|
|
|
|
|
|
|
|
|
|
|
|
|
|
|
|
|
|
|
|
|
|
|
|
|
|
|
|
|
|
|||||||||
|
|
|
|
|
|
|
|
|
|
|
|
|
|
|
|
|
|
|
|
|
|
|
|
|
|
|
|
|
|
|
|
|
|
|
|
|
|
|
|
|
|
|
|
|
|
|
|
|
|
|
||||||||||
|
|
|
|
|
|
|
|
|
|
|
|
|
|
|
|
|
|
|
|
|
|
|
|
|
|
|
|
|
|
|
|
|
|
|
|
|
|
|
|
|
|
|
|
|
|
|
|
|
|
|
||||||||||
the decline in 2012 triggered by |
|
2,000 |
|
|
|
|
|
|
|
|
|
|
|
|
|
|
|
|
|
|
|
|
|
|
|
|
|
|
|
|
|
|
|
|
|
|
|
|
|
|
|
|
|
|
|
|
|
|
|
|
|
|
|
50 |
||||||
|
|
|
|
|
|
|
|
|
|
|
|
|
|
|
|
|
|
|
|
|
|
|
|
|
|
|
|
|
|
|
|
|
|
|
|
|
|
|
|
|
|
|
|
|
|
|
|
|
|
|
|
|||||||||
adverse |
weather and disease. |
|
|
|
|
|
|
|
|
|
|
|
|
|
|
|
|
|
|
|
|
|
|
|
|
|
|
|
|
|
|
|
|
|
|
|
|
|
|
|
|
|
|
|
|
|
|
|
|
|
|
|
|
|
||||||
|
|
|
|
|
|
|
|
|
|
|
|
|
|
|
|
|
|
|
|
|
|
|
|
|
|
|
|
|
|
|
|
|
|
|
|
|
|
|
|
|
|
|
|
|
|
|
|
|
|
|
|
|
|
|
||||||
While the total value of opium |
|
- |
|
|
|
|
|
|
|
|
|
|
|
|
|
|
|
|
|
|
|
|
|
|
|
|
|
|
|
|
|
|
|
|
|
|
|
|
|
|
|
|
|
|
|
|
|
|
|
|
|
|
|
- |
|
|||||
production |
at farm-gate |
prices |
|
2002 |
|
2003 |
|
2004 |
2005 |
2006 |
2007 |
2008 |
2009 |
2010 |
|
2011 |
|
2012 |
2013 |
|
|
|
|
|||||||||||||||||||||||||||||||||||||
remained at about 4 percent of |
|
|
|
|
|
|
|
|
|
|||||||||||||||||||||||||||||||||||||||||||||||||||
|
|
|
|
|
|
|
|
Opium production |
|
|
|
|
|
|
|
|
Cultivated land |
|
||||||||||||||||||||||||||||||||||||||||||
GDP (or $950 million) in 2013 |
|
|
|
|
|
|
|
|
|
|
|
|
|
|
|
|
|
|||||||||||||||||||||||||||||||||||||||||||
|
|
|
|
|
|
|
|
|
|
|
|
|
|
|
|
|
||||||||||||||||||||||||||||||||||||||||||||
due to a decline in the farm-gate |
|
Source: UNODC |
|
|
|
|
|
|
|
|
|
|
|
|
|
|
|
|
|
|
|
|
|
|
|
|
|
|
|
|
|
|
|
|
|
|
|
|
|
|
|
|
||||||||||||||||||
price, |
the |
export |
value |
of |
|
|
|
|
|
|
|
|
|
|
|
|
|
|
|
|
|
|
|
|
|
|
|
|
|
|
|
|
|
|
|
|
|
|
|
|
|
|
|
|
|
|
|
|
|
|
|
|
|
|
|
|
|
|
|
|
opiates (including drugs) increased from 11 percent of GDP in 2012 to 15 percent of GDP – or $3.1 billion
– in 2013. The UNODC estimates that the net value of the domestic market for opiates is far smaller, worth approximately 1 percent of GDP or $200 million, compared to the net export value of opiates which is around $2.9 billion. Despite substantial financial flows from opium production, analysis suggests that the contribution of opium to economic growth in the past ten years has been minimal, although it is likely to be an important source of livelihood for a segment of the rural population.
6 | P a g e

Inflation has remained in single digits throughout 2013
Consumer prices inflation remained below 10 percent throughout the year. Period-average headline inflation increased slightly to 7.7 percent in 2013, up from 6.3 percent in previous year, but remained in
single digits throughout the year. |
|
Figure 6: Headline and core inflation |
|
Further, as shown in Figure 6, |
|
||
Afghanistan has enjoyed a period of |
|
50.0 |
|
-Y Growth) |
40.0 |
||
relative price stability in the last |
|||
30.0 |
|||
two years compared to the |
|||
20.0 |
|||
fluctuations and acute swings in |
|||
prices which occurred during and |
(Y-o |
10.0 |
|
after the 2008 world commodity |
Percent |
0.0 |
|
price crises. |
|
Food price increases exceeded non-food increases in the second half of 2013, in contrast to the first half of the year. The increase in food prices (year-on-year) was 9.8 percent in December 2013, up from 4.4 percent in December 2012. On the other hand, the increase in nonfood prices moderated to 4.8 percent from 7.4 percent over the same period (see Figure 7). Looking at the food basket, prices of cereals rose by around 13 percent, while prices of fresh and dried fruits declined due to favorable horticulture output in 2013. Among non-food items, the prices of communication services have constantly decreased as a result of declining costs for internet services and increased competition between GSM service providers.
Jun-13
Nov-12
Apr-12
Sep-11
Feb-11
Jul-10
Dec-09
May-09
Oct-08
Mar-08
Aug-07
Jan-07
Jun-06
Nov-05
Apr-05
Headline
Core inflation (excl. fuel & cereals)
Source: CSO and Bank staff calculations
Figure 7: Headline, food and non-food consumer prices inflation
|
14.0 |
-Y Growth) |
12.0 |
10.0 |
|
8.0 |
|
(Y-o |
6.0 |
Percent |
4.0 |
2.0 |
|
|
0.0 |
Headline |
|
Food |
|
Non-Food |
|
|
Source: CSO
7 | P a g e

Box 1: New Poverty Estimates for Afghanistan
On February 2, 2014, the Central Statistical Organization (CSO) released the results from the latest National Risk and Vulnerability Assessment (NRVA) household survey conducted in 2011-12. The results show that the national poverty rate in Afghanistan was around 36 percent in 2011-12, the same level measured in 2007-08 using the previous survey round (Figure 8). Furthermore, the results showed that inequality edged up. In particular, the Gini coefficient increased to 31.6 in 2011-12 from 29.7 in 200708, while the growth rate of per capita expenditure of the richest 20 percent of the population was three times as high as that of the
poorest 20 percent as shown in |
|
Figure 8: Trend in poverty headcount, by |
||||||||||||||||||
Table 2. In addition, the bottom forty |
|
|
|
|
|
residence |
||||||||||||||
percent of the population commands |
|
45.0 |
|
|
|
|
|
|
|
|
|
|
|
|
||||||
only 21 percent of total consumption |
|
|
|
|
|
|
|
|
|
|
|
|
|
|||||||
|
|
|
|
|
38.2 38.8 |
|
|
|
|
|
|
|||||||||
|
40.0 |
|
|
|
|
|
|
|
|
|
|
|||||||||
and more than 50 percent of the |
|
|
36.3 36.5 |
|
|
|
|
|
|
|
|
|||||||||
|
|
|
|
|
|
|
|
|
|
|
|
|||||||||
population |
is |
still vulnerable |
to |
|
35.0 |
|
|
|
|
|
|
|
|
|
|
|
|
|||
|
|
|
29.1 28.9 |
|
|
|
|
|
|
|
|
|||||||||
becoming poor. |
|
|
|
|
|
30.0 |
|
|
|
|
|
|
|
|
|
|
||||
|
|
|
|
Percent |
|
|
|
|
|
|
|
|
|
|
|
|
||||
The |
lack |
of |
sustained |
poverty |
25.0 |
|
|
|
|
|
|
|
|
|
|
2007-08 |
|
|||
|
|
|
|
|
|
|
|
|
|
|
||||||||||
|
|
|
|
|
|
|
|
|
|
|
||||||||||
20.0 |
|
|
|
|
|
|
|
|||||||||||||
|
|
|
|
|
|
|
|
|
|
2011-12 |
|
|||||||||
|
|
|
|
|
|
|
|
|
|
|
||||||||||
reduction |
in |
Afghanistan |
despite |
15.0 |
|
|
|
|
|
|
|
|
|
|
|
|||||
|
|
|
|
|
|
|
|
|
|
|
||||||||||
|
|
|
|
|
|
|
|
|
|
|
|
|
||||||||
strong growth during 2007-11 merits |
|
10.0 |
|
|
|
|
|
|
|
|
|
|
|
|
||||||
|
|
|
|
|
|
|
|
|
|
|
|
|
||||||||
further study. A number of factors |
|
5.0 |
|
|
|
|
|
|
|
|
|
|
|
|
||||||
could |
be |
contributing |
to |
the |
|
|
|
|
|
|
|
|
|
|
|
|
|
|||
|
0.0 |
|
|
|
|
|
|
|
|
|
|
|
|
|||||||
measured trends. First, the volatility |
|
|
|
National |
|
Urban |
|
Rural |
||||||||||||
of agricultural |
production |
would |
|
|
|
|
|
|||||||||||||
|
|
|
|
|
|
|
|
|
|
|
|
|
|
|||||||
affect measured poverty trends since |
|
|
|
Source: NRVA 2011/12, CSO |
|
|||||||||||||||
agriculture accounts for more than half of employment. It is worth noting that 2010 and 2011, the two |
||||||||||||||||||||
years preceding the 2011-12 survey, both featured negative growth in the agricultural sector. Second, pervasive underemployment likely affects the poverty impact of growth. Afghanistan faces a daunting demographic challenge, with around 400,000 new entrants into the labor force expected in the next few years.
Finally, the |
high dependency |
ratio, |
|
|
Table 2: Mean real per capita consumption (at 2011-12 local |
|
|
||||||||||
|
|
prices), by poverty quintile |
|
|
|
|
|
|
|||||||||
low levels |
of |
female |
labor |
force |
|
|
Quintile |
2007-08 |
2011-12 |
|
Annual |
|
|
||||
participation, |
and |
|
low |
labor |
|
|
|
|
|
|
|
|
growth (%) |
|
|
||
productivity all contribute to shaping |
|
|
|
|
|
|
|
|
|
|
|
||||||
|
|
Poorest |
984 |
1,019 |
|
0.9 |
|
|
|||||||||
Afghanistan’s poverty |
profile. |
High |
|
|
|
|
|
||||||||||
|
2 |
1,414 |
1,515 |
|
1.7 |
|
|
||||||||||
economic |
dependency |
due |
to |
|
|
|
|
||||||||||
|
3 |
1,818 |
1,971 |
|
2.0 |
|
|
||||||||||
demographic |
pressure |
is |
further |
|
|
|
|
||||||||||
|
|
4 |
|
2,412 |
|
2,645 |
|
2.3 |
|
|
|||||||
aggravated by extremely low levels of |
|
|
|
|
|
|
|
||||||||||
|
|
Richest |
|
4,294 |
|
4,863 |
|
3.2 |
|
|
|||||||
female labor force participation (19 |
|
|
|
|
|
|
|
||||||||||
percent) and |
the |
overwhelming |
|
|
Total |
|
2,184 |
|
2,403 |
|
2.4 |
|
|
||||
prevalence |
of |
vulnerable |
forms of |
|
|
Source: NRVA 2011/12, CSO |
|
|
|
|
|
|
|||||
employment in informal and low productivity jobs (81 percent). Creating more and better quality jobs, |
|||||||||||||||||
especially in the agriculture sector, and improving economic participation of women remain the key constraints to poverty reduction and crucial milestones in promoting a more sustainable and inclusive economic growth.
8 | P a g e

Revenue collection weakened in 2013, while large security expenditure obligations and high aid dependence risk crowding out important civilian operating and development spending
After a decade of strong revenue growth, domestic revenue collection weakened in 2012 and further in 2013. Domestic revenues declined to 9.5 percent of GDP in 2013 down from 10.3 percent in 2012 and 11.6 percent in 2011 (Figure 9). In nominal terms, domestic revenues amounted to Afs 109 billion ($1.9 billion) in 2013 compared to
the 12-month pro-rated figure of |
|
Figure 9: Domestic revenue performance since |
|
|||||||||||||||||||||||||||||||||
Afs 109 billion ($2.1 billion) in 2012. |
|
2003 |
|
|
|
|
|
|
|
|
|
|
|
|
||||||||||||||||||||||
Both tax revenues and customs |
|
14.0 |
|
|
|
|
|
|
|
|
|
|
|
|
|
|
|
|
|
|
|
|
|
|
|
|
|
2.5 |
|
|||||||
|
|
|
|
|
|
|
|
|
|
|
|
|
|
|
|
|
|
|
|
|
|
|
|
|
|
|
||||||||||
duties – which make up 48 percent |
|
12.0 |
|
|
|
|
|
|
|
|
|
|
|
|
|
|
|
|
|
|
|
|
|
|
|
|
|
2.0 |
Billion US$ |
|||||||
|
|
|
|
|
|
|
|
|
|
|
|
|
|
|
|
|
|
|
|
|
|
|
|
|
|
|||||||||||
and 26 percent respectively of all |
Percent |
10.0 |
|
|
|
|
|
|
|
|
|
|
|
|
|
|
|
|
|
|
|
|
|
|
|
|
|
|||||||||
|
|
|
|
|
|
|
|
|
|
|
|
|
|
|
|
|
|
|
|
|
|
|
|
|
1.5 |
|||||||||||
|
|
|
|
|
|
|
|
|
|
|
|
|
|
|
|
|
|
|
|
|
|
|
|
|
||||||||||||
revenues – declined as a share of |
8.0 |
|
|
|
|
|
|
|
|
|
|
|
|
|
|
|
|
|
|
|
|
|
|
|
|
|
||||||||||
|
|
|
|
|
|
|
|
|
|
|
|
|
|
|
|
|
|
|
|
|
|
|
|
|
||||||||||||
|
|
|
|
|
|
|
|
|
|
|
|
|
|
|
|
|
|
|
|
|
|
|
|
|||||||||||||
GDP |
(see |
|
Figure |
10). |
More |
6.0 |
|
|
|
|
|
|
|
|
|
|
|
|
|
|
|
|
|
|
|
|
|
|
|
|
|
1.0 |
||||
|
|
|
|
|
|
|
|
|
|
|
|
|
|
|
|
|
|
|
|
|
|
|
|
|
||||||||||||
|
|
|
|
|
|
|
|
|
|
|
|
|
|
|
|
|
|
|
|
|
|
|
|
|
|
|||||||||||
specifically, |
income |
tax |
and |
sales |
|
4.0 |
|
|
|
|
|
|
|
|
|
|
|
|
|
|
|
|
|
|
|
|
|
|
|
|
|
0.5 |
|
|||
|
|
|
|
|
|
|
|
|
|
|
|
|
|
|
|
|
|
|
|
|
|
|
|
|
|
|
||||||||||
|
2.0 |
|
|
|
|
|
|
|
|
|
|
|
|
|
|
|
|
|
|
|
|
|
|
|
|
|
|
|||||||||
|
|
|
|
|
|
|
|
|
|
|
|
|
|
|
|
|
|
|
|
|
|
|
|
|
|
|
||||||||||
tax |
revenues |
– which |
together |
|
|
|
|
|
|
|
|
|
|
|
|
|
|
|
|
|
|
|
|
|
|
|
|
|
|
- |
|
|||||
|
- |
|
|
|
|
|
|
|
|
|
|
|
|
|
|
|
|
|
|
|
|
|
|
|
|
|
|
|
||||||||
represent 32 percent of revenues – |
|
2003 2004 2005 2006 2007 2008 2009 |
2010 2011 2012-12 2013 |
|
|
|
||||||||||||||||||||||||||||||
decreased even in nominal terms, |
|
|
|
|
||||||||||||||||||||||||||||||||
by 8.2 percent and 10.4 percent, |
|
|
|
|
||||||||||||||||||||||||||||||||
|
|
|
|
|
|
|
|
|
|
|
|
|
|
|
|
|
|
|
|
|
|
|
|
|
|
|
|
|
|
|||||||
respectively. |
Furthermore, non-tax |
|
|
|
|
|
In percent of GDP |
|
|
|
In nominal values |
|
||||||||||||||||||||||||
|
|
|
|
|
|
|
|
|
||||||||||||||||||||||||||||
revenues |
(mostly |
income |
from |
|
Source: AFMIS and MoF |
|
|
|
|
|
|
|
|
|
|
|
|
|||||||||||||||||||
capital property and sales of goods |
|
|
|
|
|
|
|
|
|
|
|
|
|
|||||||||||||||||||||||
|
|
|
|
|
|
|
|
|
|
|
|
|
|
|
|
|
|
|
|
|
|
|
|
|
|
|
|
|
|
|||||||
and services) also declined as a share of GDP.
The decline in revenue collections is a result of the economic slowdown as well as weaknesses in enforcement in both tax and
customs administration. While the economic slowdown in 2013 is part of the explanation, weaknesses in enforcement and leakages are also part of the problem, particularly given that the decline in collections
began in 2012 when economic growth was very strong. Increased uncertainty around the political and security transition has likely encouraged greater rent-seeking
and tax evasion activity. Further, a
shift in the structure of imports – away from luxury and other higher
tariff items toward lower tariff
items, in part due to the economic slowdown – is also likely to have impacted customs revenues. An
9 | P a g e

analysis of the figures suggests that part of the decline in customs revenues can be attributed to lower imports of fuel, vehicles, and other high-tariff items.
The Ministry of Finance introduced a number of measures in 2013 to stabilize revenues, reduce leakages, and improve administration. These measures included the implementation of a computerized risk management module, improving procedures for random post-verification of examination, introducing post-clearance audits, salary incentives for detection of non-compliance, and an increase in fuel valuation at customs. While the immediate effects of these measures have been modest to date, they have likely prevented an accelerated decline. Furthermore, the authorities have submitted a Tax Administration Law to parliament to enhance and strengthen procedures in tax offices for small, medium and large tax payers. The law details all requirements and procedures in regard to tax payments, documentation, dispute resolution, and tax penalties.
Public expenditures increased only very modestly in 2013 to 24.2 percent of GDP, with austerity measures particularly affecting civilian recurrent and discretionary development spending.
Afghanistan’s medium term fiscal framework is one where total budget spending is projected to rise over time as more off-
budget spending (currently estimated to be as large as budget spending) comes on
budget.1 In 2013, however, total budget spending
increased only very modestly to 24.2 percent of
GDP ($5 billion) from 23.8 percent ($4.9 billion) in
2012. This is considerably lower than the previously projected budget spending
of 26.7 percent of GDP for 2013 and is a result of austerity measures put in
place given the weak revenue collection and overall lower discretionary resources. The austerity measures have particularly affected civilian recurrent and discretionary development spending. Civilian recurrent spending declined to 6.6 percent of GDP in 2013 from 6.8 percent in 2012, whereas recurrent security spending increased to 10.7 percent of GDP in 2013 from 10.3 percent in 2012. Discretionary development spending declined by 0.2 percent of GDP in 2013, while non-discretionary development spending increased by 0.5 percent of GDP.
1 The gradual move of off-budget spending into the budget is part of a medium term policy framework where Afghanistan’s public expenditure obligations are being consolidated within the budget. The World Bank’s analysis also indicates that on-budgeting of expenditures enhances their effectiveness and impact on economic growth and thus helps balance the medium term drawdown in aid.
10 | P a g e
Afghanistan’s large security expenditure obligations pose the risk of crowding out important civilian operating and development spending. With more security spending moving on budget, on-budget security expenditures increased to 11.5 percent of GDP in 2013 from 10.4 percent in 2012. Civilian expenditures, on the other hand, declined to 12.8 percent of GDP in 2013 from 13.4 percent in 2012, as the government tightened public spending following the mid-year review of the budget. Spending on sectors such as education, health, and agriculture & rural development increased modestly or held steady, while lower spending on infrastructure and economic governance accounted for most of the decline in civilian expenditures in 2013 (see Figure 12).
Percent of GDP
Figure 12: Core expenditures by sectoral shares, 2012 and 2013 (percent of GDP)
30.0 |
|
|
|
|
|
|
|
|
|
|
|
Economic Governance |
|
|
|
|
|
|
|
|
|
|
|
||
|
|
|
|
|
|
|
|
|
|
|
& PSD |
|
|
|
|
|
|
|
|
|
|
|
|
|
|
25.0 |
|
|
|
|
|
|
|
|
|
|
|
Social Protection |
|
|
|
|
|
|
|
|
|
|
|
||
|
|
|
|
|
|
|
|
|
|
|
||
|
|
2.2 |
|
|
|
2.2 |
|
|
|
|
Agriculture & Rural |
|
20.0 |
|
|
|
|
|
|
|
|
|
|||
|
|
|
|
|
|
|
|
|
||||
|
|
|
|
|
|
|
|
|
||||
|
|
|
|
|
3.6 |
|
|
|
|
Development |
||
|
|
|
|
|
|
|
|
|
||||
|
|
|
|
|
|
|
|
|
|
|
||
15.0 |
|
3.5 |
|
|
|
|
|
|
|
Health |
||
|
|
|
|
|
|
|
|
|||||
|
|
|
|
|
|
|
|
|||||
|
|
|
|
|
|
|
|
|
|
|
|
|
|
3.3 |
|
|
|
2.8 |
|
|
|
|
Education |
||
|
|
|
|
|
|
|
|
|
||||
10.0 |
|
|
|
|
|
|
|
|
|
|||
|
|
|
|
|
|
|
|
|
|
|
||
|
|
|
|
|
|
|
|
|
|
|
Infrastructure & |
|
|
|
|
|
|
|
11.5 |
|
|
|
|
||
|
|
|
|
|
|
|
|
|
|
|
||
|
|
|
|
|
|
|
|
|
|
|
||
|
|
|
|
|
|
|
|
|
|
|
||
5.0 |
|
10.4 |
|
|
|
|
|
|
|
Natural Resources |
||
- |
|
|
|
|
|
|
|
|
|
|
|
Governance |
|
|
|
|
|
|
|
|
|
|
|
||
|
|
|
|
|
|
|
|
|
|
|
||
|
|
|
|
|
|
|
|
|
|
|
Security |
|
|
2012-12 |
|
|
2013 |
|
|
|
|
||||
|
|
|
|
|
|
|
||||||
|
|
|
|
|
|
|
||||||
|
|
|
|
|
|
|
|
|||||
Source: AFMIS
While the grant share of budget financing is normally projected to rise due to the onbudgeting of off-budget spending, the decline in revenues has exacerbated this trend. Revenues financed 55 percent of recurrent expenditures and 39 percent of total core expenditures in 2013, while these ratios were respectively 60 percent and 43
percent a year earlier. As a result, the financing gap increased from 13.5 percent
of GDP in 2012 to 14.9 percent in 2013. As
Figure 13 shows, the financing gap for core budget has widened considerably since
2011, both due to the on-budgeting of off-
budget spending (as expected), but also due to weakness in domestic revenue collection.
11 | P a g e

Box 2: Budgeting in a period of transition: The 2014 (1393) budget
Afghanistan’s budget for 2014 (1393) has features that traditionally have been a part of the budget, as well as features that are unique to the current circumstances.
First, the annual budget has traditionally featured allocations for development expenditures that are far in excess of likely spending. For example, in 2013, total budgeted development expenditure was about $3 billion, while actual development spending turned out to be $1.45 billion. Similarly, budgeted development expenditure for 2014 of $2.6 billion is far in excess of likely actual spending. Low development budget execution has traditionally been a part of Afghanistan’s annual budget and spending.
On the other hand, actual recurrent spending has traditionally been much closer to budgeted recurrent spending. In 2013, actual recurrent spending was about 5 percent lower than budgeted because of the austerity measures, as already discussed. In 2014, recurrent spending is budgeted to increase by 40 percent (or about $1.4 billion) compared to actual 2013 recurrent spending. Most of this increase ($1.1 billion) comes from higher recurrent security expenditures, whereas only $0.3 billion comes from higher recurrent civilian spending. The budget assumes that domestic revenues in 2014 will be $0.5 billion higher than in 2013. If such an increase in revenues does not materialize in 2014 (not unlikely given heightened uncertainty) and the large budgeted increase in recurrent security spending is not accompanied by a similar increase in grants, Afghanistan may once again find itself in a situation where
austerity requires cuts in |
|
|
Table 3: National budget in 2014 compared to 2013 (million US$) |
|
|
|
||||||||||
important |
|
civilian |
|
|
|
|
|
|||||||||
operating |
|
|
and |
|
|
|
|
|
2013Bgt* |
2013Act |
2014Bgt |
|
||||
development spending. |
|
|
Recurrent budget |
3,775 |
3,575 |
|
|
5,008 |
|
|||||||
|
|
|
|
|
|
Discretionary development |
874 |
342 |
|
895 |
|
|||||
It is also worth making a |
|
|
Non-discretionary development |
2,159 |
1,107 |
|
1,746 |
|
||||||||
broader |
point |
in this |
|
|
Total core budget |
6,809 |
5,025 |
|
|
7,649 |
|
|||||
context. |
|
Off-budget |
|
|
Domestic revenues |
|
|
2,488 |
|
1,974 |
|
|
2,489 |
|
|
|
spending |
is |
|
financed |
|
|
Foreign grants |
|
|
4,022 |
|
3,307 |
|
|
4,738 |
|
|
fully by grants whereas |
|
|
External loans/credits |
|
|
54 |
|
25 |
|
|
49 |
|
|
|||
on-budget |
obligations |
|
|
|
|
|
|
|
|
|
||||||
|
|
Total financing |
6,565 |
5,307 |
|
7,277 |
|
|||||||||
are financed |
from a |
|
|
|
|
|||||||||||
mixture |
of |
|
domestic |
|
|
* 2013Bgt figures are initial budgeted figures. |
|
|
|
|||||||
|
|
|
|
|
|
|
|
|
|
|
|
|
|
|||
revenues and foreign grants. As more off-budget security spending moves on-budget, if the pace at which security obligations move on-budget exceeds the pace at which civilian obligations move onbudget, the competition from security obligations for domestic revenue and discretionary financing will increase, with the associated risk of crowding out important civilian operating and development spending.
12 | P a g e

Foreign aid inflows continue to finance the large trade deficit and sustain foreign exchange reserves.
The trade deficit remained large but declined slightly in 2013 as slower economic growth and demand led to a moderation of imports. Total estimated imports – including both official and smuggling – declined by an estimated 4 percent,
reducing the trade deficit from -42.4 |
|
|
|
Figure 14: Current account balance for |
|||||||||||||||||
percent of GDP in 2012 to -39.9 |
|
|
|
|
|
2013 (in percent of GDP) |
|
|
|
|
|
|
|
||||||||
percent in 2013. Because of an |
|
|
|
|
|
|
|
|
|
|
|
|
|
|
|
|
|
|
|
|
|
exceptionally high level of unofficial |
|
|
|
|
|
Exports |
|
|
|
12.6 |
|
|
|
|
|
|
|
||||
trade in Afghanistan, official recorded |
-52.5 |
|
|
Imports |
|
|
|
|
|
|
|
|
|
|
|
|
|
||||
|
|
|
|
|
|
|
|
|
|
|
|
|
|
|
|||||||
exports are estimated to represent |
|
|
|
|
|
|
|
|
|
|
|
|
|
|
|
||||||
|
|
|
|
|
|
|
|
|
|
|
|
|
|
|
|
|
|
|
|
|
|
only one-fifth of total exports.2 Total |
Merchandise |
|
|
|
|
-39.9 |
|
|
|
|
|
|
|
|
|
|
|||||
trade balance |
|
|
|
|
|
|
|
|
|
|
|
||||||||||
exports in 2013 are estimated at $2.6 |
|
|
|
|
|
Net income |
|
0.7 |
|
|
|
|
|
|
|
|
|
|
|||
|
|
|
|
|
|
|
|
|
|
|
|
|
|
|
|
||||||
billion, of which around $500 million |
|
|
|
|
|
|
|
|
|
|
|
|
|
|
|
|
|||||
|
|
|
Current transfers, net |
|
|
|
|
|
|
|
|
|
|
|
|
|
|||||
were recorded by official sources. On |
|
|
|
|
|
|
|
|
|
|
|
|
|
44.0 |
|
|
|||||
|
|
|
|
|
|
|
|
|
|
|
|
|
|||||||||
the other hand, official imports were |
|
|
Current Account balance |
|
|
3.6 |
|
|
|
|
|
|
|
|
|
|
|||||
|
|
|
|
|
|
|
|
|
|
|
|
|
|
||||||||
|
|
|
|
|
|
|
|
|
|
|
|
|
|
||||||||
$9.3 billion for 2013, while estimated |
|
|
|
|
|
|
|
|
|
|
|
|
|
|
|||||||
|
|
|
|
|
|
|
|
|
|
|
|
|
|
|
|
|
|
|
|
|
|
total imports are $10.9 billion. With |
-60.0 -40.0 -20.0 |
0.0 |
|
20.0 |
40.0 |
60.0 |
|||||||||||||||
the large trade deficit financed fully by |
|
|
|
Source: IMF staff estimates |
|
|
|
|
|
|
|
|
|
|
|||||||
foreign aid inflows, the current |
|
|
|
|
|
|
|
|
|
|
|
|
|
|
|
|
|
|
|
|
|
account was nearly balanced at 3.6 percent of GDP in 2013 (see Figure 14).
Official exports increased in 2013, most likely due to improved recording, but also possibly due to robust agricultural performance in the preceding year. Official exports grew by almost 50 percent in 2013 to $512 million in 2013, compared to $346 million in 2012. Dry fruits, carpets, medicinal plants, and animal byproducts (such as wool, skin, etc.) were some of the items that saw a major increase in recorded exports (see Figure 15). As most export items in Afghanistan are agricultural commodities, or
agriculture-related products, exports also
Figure 15: Official exports by product groups, |
|||||||||||||
|
|
|
|
2012 and 2013 |
|
|
|
Others |
|||||
600 |
|
|
|
|
|
|
|
|
|
|
|
|
|
|
|
|
|
|
|
|
|
|
|
|
|
Fresh fruits |
|
|
|
|
|
|
|
|
|
|
|
|
|
||
500 |
|
|
|
|
|
|
|
|
|
|
|
|
|
|
|
|
|
|
|
|
|
|
|
|
|
||
|
|
|
|
|
|
|
|
|
|
|
|
Oil seeds |
|
|
|
|
|
|
|
|
|
|
|
|
|
||
|
|
|
|
|
|
|
|
|
|
|
|
||
400 |
|
|
|
|
|
|
|
|
|
|
|
|
|
|
|
|
|
|
|
|
|
|
|
|
|
Cotton |
|
|
|
|
|
|
|
|
|
|
|
|
|
||
|
|
|
|
|
|
|
|
|
|
|
|
||
300 |
|
|
|
|
|
|
|
|
|
|
|
|
Karakul skins |
|
|
|
|
|
|
|
|
|
|
|
|
||
|
|
|
|
|
|
|
|
|
|
||||
200 |
|
|
|
|
|
|
|
|
|
|
|
|
Animal by-products |
|
|
|
|
|
|
|
|
|
|
|
|
||
|
|
|
|
|
|
|
|
|
|
|
|
||
|
|
|
|
|
|
|
|
|
|
|
|
(excl. Karakul) |
|
|
|
|
|
|
|
|
|
|
|
|
|
|
|
100 |
|
|
|
|
|
|
|
|
|
|
|
|
Medicinal plants |
|
|
|
|
|
|
|
|
|
|
|
|
||
|
|
|
|
|
|
|
|
|
|
|
|
||
|
|
|
|
|
|
|
|
|
|
|
|
Carpets |
|
|
|
|
|
|
|
|
|
|
|
|
|
||
0 |
|
|
|
|
|
|
|
|
|
|
|
|
|
|
|
|
|
|
|
|
|
|
|
|
|
||
|
|
|
|
|
|
|
|
|
|
|
|
||
|
|
|
|
|
|
|
|
|
|
|
|
Dry fruits |
|
2012 |
2013 |
|
|
|
|
|
|||||||
|
|
|
|
|
|||||||||
|
|
|
|
|
|||||||||
|
|
|
|
|
|
||||||||
Source: CSO
depend on the previous year’s agriculture productivity. In
2 The large difference between total estimated exports and official recorded exports is not explained by opium, but instead by unofficial non-opium exports.
13 | P a g e

particular, dry fruits and animal by-products are strongly impacted by agriculture performance in the previous year, as was the case in 2013.
According to official recorded export figures, Afghanistan’s largest export destinations are Pakistan, India, and Iran. Figure 16 shows that
exports to Pakistan, India and Iran |
Figure 16: Afghanistan's export partners |
|||||||||||
represent around 45 percent of Afghan |
in 2013 (percent share of exports) |
|||||||||||
exports. |
While |
official |
|
recorded |
|
|
|
|
Pakistan |
|||
exports |
are |
only a |
fraction |
of |
total |
3% |
|
|
|
|||
|
|
|
||||||||||
|
|
|
Other |
|||||||||
estimated |
exports, |
the |
change in |
4% |
|
|
|
|||||
|
|
|
||||||||||
|
|
|
||||||||||
|
|
|
|
|||||||||
exports |
in |
2013 |
is |
unlikely |
to |
have |
|
|
|
India |
||
6% |
|
|
|
|||||||||
|
|
|
||||||||||
been affected |
by |
exchange |
rate |
|
|
|
Iran |
|||||
|
|
40% |
|
|||||||||
|
|
|
||||||||||
movements. |
While the |
Afghani |
|
|
|
China |
||||||
19% |
|
|
|
|||||||||
|
|
|
||||||||||
depreciated |
against |
the |
US |
dollar |
|
|
|
|||||
|
|
|
|
Russia |
||||||||
during 2013, it remained stable against |
|
|
|
|
||||||||
|
|
|
|
|||||||||
|
|
|
|
Tajikistan |
||||||||
Pakistani Rupee and the Indian Rupee |
|
24% |
|
|
||||||||
|
|
|
||||||||||
|
|
|
Germany |
|||||||||
and appreciated against the Iranian |
|
|
|
|
||||||||
|
|
|
|
|||||||||
|
|
|
|
|||||||||
Rial during the year. As such, most of |
|
|
|
|
Uzbekistan |
|||||||
|
|
|
|
|||||||||
|
|
|
|
|||||||||
export trends in 2013 are likely to have |
|
|
|
|
|
|||||||
been driven by structural factors, with |
Source: CSO |
|
the exchange rate likely to have played only a minor role if any.
The Afghani continued to depreciate against the US dollar and the euro in 2013. The nominal exchange rate depreciated by, respectively, 8.8 percent and 12.3 percent vis-à-vis the US dollar and the euro. The
period average exchange rate during |
|
|
|
|
|
|
|
|
|
|
|
|
|
|
|
|
|
|
|
|
|
|
|
|
|
|
|
|
|
|
|||
2013 was Afs 55.4 per US dollar and |
|
|
Figure 17: Afghani exchange rate against |
||||||||||||||||||||||||||||||
Afs 73.4 per euro. The depreciation is |
|
|
|
|
|
|
|
|
the US dollar and the Euro |
||||||||||||||||||||||||
largely in line with expectations and is |
60.0 |
|
|
|
|
|
|
|
|
|
|
|
|
|
|
|
|
|
|
|
|
|
|
|
|
|
|
|
|
85.0 |
|||
|
|
|
|
|
|
|
|
|
|
|
|
|
|
|
|
|
|
|
|
|
|
|
|
|
|
|
|
||||||
explained by a number of factors. First, |
57.5 |
|
|
|
|
|
|
|
|
|
|
|
|
|
|
|
|
|
|
|
|
|
|
|
|
|
|
|
|
80.0 |
|||
as already discussed, |
other |
major |
|
|
|
|
|
|
|
|
|
|
|
|
|
|
|
|
|
|
|
|
|
|
|
|
|
|
|
|
|||
55.0 |
|
|
|
|
|
|
|
|
|
|
|
|
|
|
|
|
|
|
|
|
|
|
|
|
|
|
|
|
|||||
|
|
|
|
|
|
|
|
|
|
|
|
|
|
|
|
|
|
|
|
|
|
|
|
|
|
|
|
|
|||||
South Asian currencies, including the |
|
|
|
|
|
|
|
|
|
|
|
|
|
|
|
|
|
|
|
|
|
|
|
|
|
|
|
|
75.0 |
||||
52.5 |
|
|
|
|
|
|
|
|
|
|
|
|
|
|
|
|
|
|
|
|
|
|
|
|
|
|
|
|
|||||
|
|
|
|
|
|
|
|
|
|
|
|
|
|
|
|
|
|
|
|
|
|
|
|
|
|
|
|
||||||
Indian Rupee and the Pakistani Rupee, |
|
|
|
|
|
|
|
|
|
|
|
|
|
|
|
|
|
|
|
|
|
|
|
|
|
|
|
|
70.0 |
||||
|
|
|
|
|
|
|
|
|
|
|
|
|
|
|
|
|
|
|
|
|
|
|
|
|
|
|
|
||||||
50.0 |
|
|
|
|
|
|
|
|
|
|
|
|
|
|
|
|
|
|
|
|
|
|
|
|
|
|
|
|
|||||
have also depreciated against the US |
|
|
|
|
|
|
|
|
|
|
|
|
|
|
|
|
|
|
|
|
|
|
|
|
|
|
|
|
|||||
|
|
|
|
|
|
|
|
|
|
|
|
|
|
|
|
|
|
|
|
|
|
|
|
|
|
|
|
65.0 |
|||||
dollar during 2013. The Afghani has |
47.5 |
|
|
|
|
|
|
|
|
|
|
|
|
|
|
|
|
|
|
|
|
|
|
|
|
|
|
|
|
||||
|
|
|
|
|
|
|
|
|
|
|
|
|
|
|
|
|
|
|
|
|
|
|
|
|
|
|
|
||||||
|
|
|
|
|
|
|
|
|
|
|
|
|
|
|
|
|
|
|
|
|
|
|
|
|
|
|
|
|
|||||
thus remained relatively stable against |
45.0 |
|
|
|
|
|
|
|
|
|
|
|
|
|
|
|
|
|
|
|
|
|
|
|
|
|
|
|
|
60.0 |
|||
these currencies. The real effective |
|
Jan-12 Mar-12 May-12 Jul-12 Sep-12 Nov-12 Jan-13 |
Mar-13 May-13 Jul-13 Sep-13 Nov-13 |
||||||||||||||||||||||||||||||
exchange rate |
depreciated |
only |
|
||||||||||||||||||||||||||||||
marginally by 1.3 percent during the |
|
||||||||||||||||||||||||||||||||
|
|
|
|
|
|
US dollar (left axis) |
|
|
|
|
Euro (right axis) |
||||||||||||||||||||||
year. Second, |
the |
drawdown in |
|
|
|
|
|
|
|
|
|
|
|||||||||||||||||||||
|
|
|
|
|
|
|
|
|
|
||||||||||||||||||||||||
|
|
|
|
|
|
|
|
|
|
|
|
|
|
|
|
|
|
|
|
|
|
|
|
|
|
|
|
|
|
||||
international security |
forces |
which |
|
Source: DAB |
|
|
|
|
|
|
|
|
|
|
|
|
|
||||||||||||||||
started in 2012 and is continuing through 2013, can affect capital inflows and thus the exchange rate trend. Third, increased uncertainty surrounding the political and security transition could raise demand
14 | P a g e

for foreign exchange and lead to an increase in the pace of capital flight. Finally, official grants could be affected by slower policy implementation during the transition.
Foreign exchange reserves closed the year at nearly the same level as at end 2012. While fluctuating throughout the year, gross foreign exchange reserves were recorded at US7.4 billion in December 2013 compared to US7.2 billion twelve months earlier. Increased fluctuations in monthly reserves – as shown in Figure 18 – and plateauing of end-year reserves are not unexpected in light of the political and security transition. Foreign exchange reserves could be affected by a slowdown in capital inflows and
foreign |
grants |
during |
the |
|
|
|
|
|
|
|
|
|
|
|
|
|
|
|
|
|
|
|
|
|
|
|
|
|
|
|
|
|
|
|
|
|
|
|
|
|
|
|
|
|
|
|
|
|
|
|
|
|
|
|
|
|
|
|
|
|
|
|
|
|
|
|
|
transition period, as well as |
|
Figure 18: Gross international reserves (billion |
|
|
|
|
|
|
|
|
|||||||||||||||||||||||||||||||||||||||||||||||||||||||||
any changes in the pace of |
|
|
|
|
|
|
|
|
|
|
|
|
|
|
|
|
|
|
|
|
|
|
|
|
US$) |
|
|
|
|
|
|
|
|
|
|
|
|
|
|
|
|
|
|
|
|
|
|
|
|
|
|
|
|
|
|
|
|
|
|||||||||
capital flight. Nonetheless, the |
|
7.5 |
|
|
|
|
|
|
|
|
|
|
|
|
|
|
|
|
|
|
|
|
|
|
|
|
|
|
|
|
|
|
|
|
|
|
|
|
|
|
|
|
|
|
|
|
|
|
|
|
|
|
|
|
|
|
|
|
|
|
|
|
|
||||
foreign exchange reserves are |
|
|
|
|
|
|
|
|
|
|
|
|
|
|
|
|
|
|
|
|
|
|
|
|
|
|
|
|
|
|
|
|
|
|
|
|
|
|
|
|
|
|
|
|
|
|
|
|
|
|
|
|
|
|
|
|
|
|
|
|
|
|
|||||
|
|
|
|
|
|
|
|
|
|
|
|
|
|
|
|
|
|
|
|
|
|
|
|
|
|
|
|
|
|
|
|
|
|
|
|
|
|
|
|
|
|
|
|
|
|
|
|
|
|
|
|
|
|
|
|
|
|
|
|
|
|
|
|||||
|
|
|
|
|
|
|
|
|
|
|
|
|
|
|
|
|
|
|
|
|
|
|
|
|
|
|
|
|
|
|
|
|
|
|
|
|
|
|
|
|
|
|
|
|
|
|
|
|
|
|
|
|
|
|
|
|
|
|
|
|
|
|
|||||
of the level that can finance |
|
7.0 |
|
|
|
|
|
|
|
|
|
|
|
|
|
|
|
|
|
|
|
|
|
|
|
|
|
|
|
|
|
|
|
|
|
|
|
|
|
|
|
|
|
|
|
|
|
|
|
|
|
|
|
|
|
|
|
|
|
|
|
|
|
||||
around 7 months of imports, |
US$ |
6.5 |
|
|
|
|
|
|
|
|
|
|
|
|
|
|
|
|
|
|
|
|
|
|
|
|
|
|
|
|
|
|
|
|
|
|
|
|
|
|
|
|
|
|
|
|
|
|
|
|
|
|
|
|
|
|
|
|
|
|
|
|
|
||||
|
|
|
|
|
|
|
|
|
|
|
|
|
|
|
|
|
|
|
|
|
|
|
|
|
|
|
|
|
|
|
|
|
|
|
|
|
|
|
|
|
|
|
|
|
|
|
|
|
|
|
|
|
|
|
|
|
|
|
|
|
|||||||
|
|
|
|
|
|
|
|
|
|
|
|
|
|
|
|
|
|
|
|
|
|
|
|
|
|
|
|
|
|
|
|
|
|
|
|
|
|
|
|
|
|
|
|
|
|
|
|
|
|
|
|
|
|
|
|
|
|
|
|
|
|||||||
|
|
|
|
|
|
|
|
|
|
|
|
|
|
|
|
|
|
|
|
|
|
|
|
|
|
|
|
|
|
|
|
|
|
|
|
|
|
|
|
|
|
|
|
|
|
|
|
|
|
|
|
|
|
|
|
|
|
|
|
|
|||||||
which is an adequate level |
|
|
|
|
|
|
|
|
|
|
|
|
|
|
|
|
|
|
|
|
|
|
|
|
|
|
|
|
|
|
|
|
|
|
|
|
|
|
|
|
|
|
|
|
|
|
|
|
|
|
|
|
|
|
|
|
|
|
|
|
|
||||||
Billion |
|
|
|
|
|
|
|
|
|
|
|
|
|
|
|
|
|
|
|
|
|
|
|
|
|
|
|
|
|
|
|
|
|
|
|
|
|
|
|
|
|
|
|
|
|
|
|
|
|
|
|
|
|
|
|
|
|
|
|
|
|
|
|||||
|
|
|
|
|
|
|
|
|
|
|
|
|
|
|
|
|
|
|
|
|
|
|
|
|
|
|
|
|
|
|
|
|
|
|
|
|
|
|
|
|
|
|
|
|
|
|
|
|
|
|
|
|
|
|
|
|
|
|
|
|
|
||||||
given the size of the economy. |
6.0 |
|
|
|
|
|
|
|
|
|
|
|
|
|
|
|
|
|
|
|
|
|
|
|
|
|
|
|
|
|
|
|
|
|
|
|
|
|
|
|
|
|
|
|
|
|
|
|
|
|
|
|
|
|
|
|
|
|
|
|
|
|
|||||
However, |
if abrupt |
swings |
5.5 |
|
|
|
|
|
|
|
|
|
|
|
|
|
|
|
|
|
|
|
|
|
|
|
|
|
|
|
|
|
|
|
|
|
|
|
|
|
|
|
|
|
|
|
|
|
|
|
|
|
|
|
|
|
|
|
|
|
|
|
|
|
|||
|
|
|
|
|
|
|
|
|
|
|
|
|
|
|
|
|
|
|
|
|
|
|
|
|
|
|
|
|
|
|
|
|
|
|
|
|
|
|
|
|
|
|
|
|
|
|
|
|
|
|
|
|
|
|
|
|
|
|
|
|
|||||||
|
|
|
|
|
|
|
|
|
|
|
|
|
|
|
|
|
|
|
|
|
|
|
|
|
|
|
|
|
|
|
|
|
|
|
|
|
|
|
|
|
|
|
|
|
|
|
|
|
|
|
|
|
|
|
|
|
|
|
|
|
|
||||||
happen in foreign grants and |
|
|
|
|
|
|
|
|
|
|
|
|
|
|
|
|
|
|
|
|
|
|
|
|
|
|
|
|
|
|
|
|
|
|
|
|
|
|
|
|
|
|
|
|
|
|
|
|
|
|
|
|
|
|
|
|
|
|
|
|
|
|
|||||
|
|
|
|
|
|
|
|
|
|
|
|
|
|
|
|
|
|
|
|
|
|
|
|
|
|
|
|
|
|
|
|
|
|
|
|
|
|
|
|
|
|
|
|
|
|
|
|
|
|
|
|
|
|
|
|
|
|
|
|
|
|
|
|||||
net capital inflows to the |
|
5.0 |
|
|
|
|
|
|
|
|
|
|
|
|
|
|
|
|
|
|
|
|
|
|
|
|
|
|
|
|
|
|
|
|
|
|
|
|
|
|
|
|
|
|
|
|
|
|
|
|
|
|
|
|
|
|
|
|
|
|
|
|
|
||||
economy, |
a |
|
prudent |
|
|
Jan-11 |
|
Apr-11 |
Jul-11 |
|
Oct-11 |
|
Jan-12 |
|
|
Apr-12 |
|
Jul-12 |
|
Oct-12 |
|
Jan-13 |
|
Apr-13 |
|
Jul-13 |
|
Oct-13 |
|
||||||||||||||||||||||||||||||||||||||
management |
of |
foreign |
|
|
|
|
|
|
|
|
|
|
|
|
|
|
|||||||||||||||||||||||||||||||||||||||||||||||||||
exchange |
reserves |
will |
be |
|
Source: DAB |
|
|
|
|
|
|
|
|
|
|
|
|
|
|
|
|
|
|
|
|
|
|
|
|
|
|
|
|
|
|
|
|
|
|
|
|
|
|
|
|
|
|
|
|
|
|
|
|
|
|
|
|
|
|||||||||
critical during |
periods |
of |
|
|
|
|
|
|
|
|
|
|
|
|
|
|
|
|
|
|
|
|
|
|
|
|
|
|
|
|
|
|
|
|
|
|
|
|
|
|
|
|
|
|
|
|
|
|
|
|
|
|
|
|
|
|
|
|
|
|
|
|
|
|
|
||
heightened uncertainty.
Monetary and banking performance indicators have still not recovered from the Kabul Bank crisis.
Money growth picked up towards the end of the year but still remains lower than the pre-2010 levels.
Reserve money growth – which is currency-in-circulation plus required reserves of the Central Bank – increased to 8.5 percent in November 2013, up from 2.3 percent in December 2012. Though the money supply increased in 2013, it is still significantly lower than what it was prior to the Kabul Bank crisis in 2010, as shown in Figure 19. The Da Afghanistan Bank (DAB) uses reserve money as the nominal anchor for its open market operations. It uses foreign exchange auctions to control money supply, while preserving a floating exchange rate regime. The Central Bank auctions, on average, around $30 million per week to control excessive liquidity in the market. On the other hand, broad money (M2) – which is currency in circulation plus deposits in commercial banks (including transferable/demand, savings and time deposits) – grew by 9.5 percent in November 2013 and increased in percent of GDP from 32 percent in 2012 to 33 percent in 2013 (see Figure 20).
15 | P a g e

Figure 19: Reserve and broad money growth (12-month percent change)
60.0 |
|
|
|
|
|
|
|
|
|
|
|
|
|
40.0 |
|
|
|
|
|
|
|
|
|
|
|
|
|
20.0 |
|
|
|
|
|
|
|
|
|
|
|
|
|
0.0 |
|
|
|
|
|
|
|
|
|
|
|
|
|
-20.0 |
|
|
|
|
|
|
|
|
|
|
|
|
|
Jul-09 |
Nov-09 |
Mar-10 |
Jul-10 |
Nov-10 |
Mar-11 |
Jul-11 |
Nov-11 |
Mar-12 |
Jul-12 |
Nov-12 |
Mar-13 |
Jul-13 |
Nov-13 |
Reserve money growth
Broad money (M2) growth
Source: DAB
Figure 20: Broad money, M2 (in percent of GDP)
50.0 |
40.0 |
30.0 |
20.0 |
10.0 |
0.0 |
The banking sector has still not fully recovered from the Kabul Bank crisis. Deposits of the banking sector marginally increased to Afs 198 billion ($3.4 billion) in November 2013, up from Afs 187 billion ($3.6 billion) in December 2012. In percent of GDP, total deposits of the banking sector have in fact declined from 16.1 percent in 2012 to 15.5 percent in 2013. Lending to the private sector, on the other hand, has remained steady at around 4 percent of GDP or $820 million. Both total loans and loan-to- deposit ratio remain sharply lower than the pre-crisis levels, as indicated in Figure 21. Lower lending is also impacted, to a certain degree, by increased perceptions of uncertainty by businesses and lower non-agricultural growth that lead to reduced demand for credit.
Figure 21: Loans and deposits of banks (in billion US$)
Figure 22: Loans and deposits of banks (in percent of GDP)
4.5 |
|
|
|
|
|
|
|
|
|
|
|
25.0 |
3.8 |
|
|
|
|
|
|
|
|
|
|
|
20.0 |
3.0 |
|
|
|
|
|
|
|
|
|
|
|
15.0 |
|
|
|
|
|
|
|
|
|
|
|
|
|
2.3 |
|
|
|
|
|
|
|
|
|
|
|
10.0 |
1.5 |
|
|
|
|
|
|
|
|
|
|
|
|
|
|
|
|
|
|
|
|
|
|
|
5.0 |
|
0.8 |
|
|
|
|
|
|
|
|
|
|
|
|
|
|
|
|
|
|
|
|
|
|
|
|
|
- |
|
|
|
|
|
|
|
|
|
|
|
0.0 |
|
May-10 |
|
|
May-11 |
|
|
May-12 |
|
|
May-13 |
|
|
Sep-09 |
Jan-10 |
Sep-10 |
Jan-11 |
Sep-11 |
Jan-12 |
Sep-12 |
Jan-13 |
Sep-13 |
||||
|
|
|
|
Deposits |
|
|
Loans |
|
|
|
||
2006 2007 2008 2009 2010 2011 2012 2013 |
Deposits |
|
|
|
Loans to private sector |
|
|
|
||
|
|
|||
|
|
|
|
|
Source: DAB
16 | P a g e

The privatization of the New Kabul Bank is on-going. In early 2013, the Ministry of Finance rejected the only bid received from a local bidder due to the disqualification of the technical proposal. The privatization of the bank was relaunched later in the year, with a UAE-based and a US firm qualifying as approved bidders. The Ministry of Finance announced in December 2013 that Kru Capital won the bid for New Kabul Bank with a US$28.5 million offer (including US$20 million for capital injection). This bid now needs to be approved by the Cabinet, with the approval still pending.
17 | P a g e