

TRADE FLOWS 2030
Enabling factors
•The tendency to reduce the cost of production, because improved liquefaction technology
Rising consumption of GHG (up to 145 trillion by 2015). The share of LNG ~ 5% (2001), 19% (to 2011) Market development of spot transactions (1997 - 3% of all contracts awarded in 2009 - 20%)
constraints
•The high cost of LNG compared to coal and oil
•Attractiveness of the traditional gas (cheaper), (under construction onshore and subsea pipelines)
•Alternative fuels (GTL)
JAPAN
•The share of LNG - 97%
The main supplier - Indonesia, as well: Australia, Brunei, Malaysia, UAE and USA. 1996 - contract with Qatargas for 25 years (6 million tons of LNG per year)
There are 23 LNG receiving terminals with total capacity of 188.3 million tons (260 billion m3)

Dynamic of LNG COST of
PRODUCTION
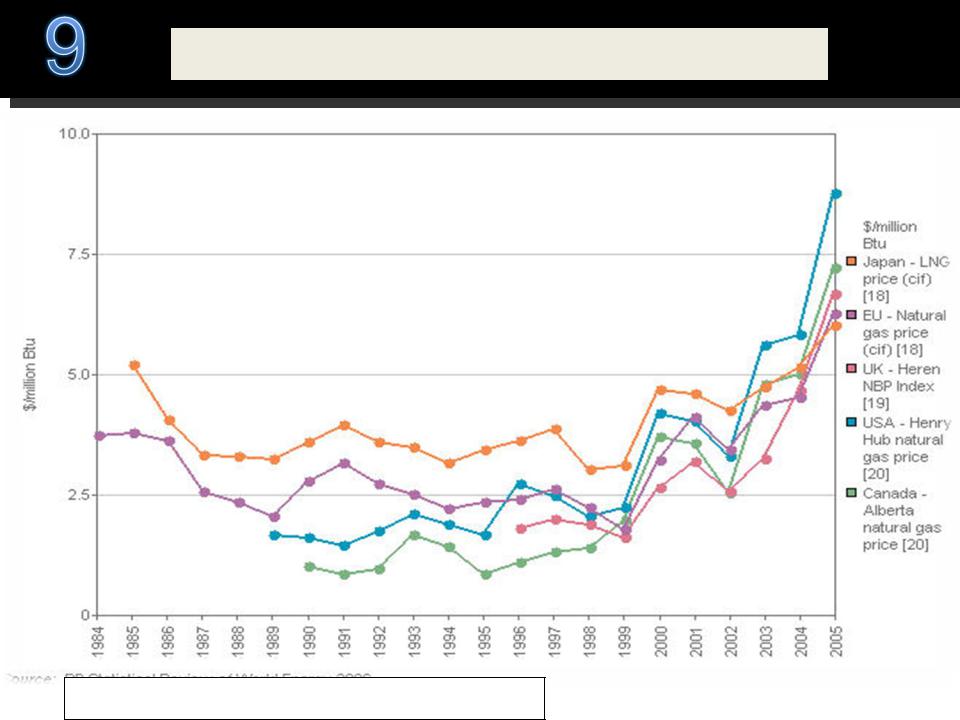
PRICES
Million. Btu - British thermal unit 0.252 kcal

PRICES
Dollars Btu
Btu - British thermal unit 0.252 kcal
1kcal=3.97Btu
49257899069014 Btu = 1Gt LNG
1Gm³= 0.72449999997491Gt LNG
1tn LNG=51.6ммBtu
