

Сборник трудов конференции СПбГАСУ 2012
.pdfЧисленные методы расчетов в практической геотехнике
Литература
1.Фадеев А.Б. Метод конечных элементов в геомеханике. М., 1987.
2.Бакенов Х.З., Фадеев А.Б. Расчет осадки ленточного фундамента на упругопластическом основании: В кн.: Механика грунтов, основания и фундаменты. Сб. трудов МИСИ.- М.,1985.
3.А.с. 1247464 СССР МКИ Е02 Д1/00/ Устройство для испытанмя грунтов в условиях трехосного сжатия/ Бронин В.Н., Ошурков Н.В., Голубец А.В. Опубл. 30.07.86. БИ. №28
4.НеизвестновЯ.В., КондратенкоА.В., Козлов С.А. идр. Инженерная геология рудной провинции Кларион-Клиппертон в Тихом океане./ Тр.ВНИИОкеангеологии М-ва природню ресурсов РФ и РАН; Т.197. – СПб.: Наука, 2004.-281 с.
УДК 517.95
Е.Л. Нуспеков, Б.Ж. Унайбаев, Б.Б. Унайбаев, В.А. Арсенин, Ж.А. Марденов
(ЕИТИ им. академика К.И. Сатпаева, г. Екибастуз)
АВТОКОЛЕБАНИЯВЕРТИКАЛЬНОГОРОТОРАВРАЩАЮЩЕГОСЯ НАПОДШИПНИКАХСКОЛЬЖЕНИЯСЖИДКОСТНОЙ СМАЗКОЙ, УСТАНОВЛЕННЫХ НАУПРУГОМФУНДАМЕНТЕ
Как известно из практики, подшипники скольжения с жидкостной смазкой имеют ряд существенных преимуществ перед подшипниками качения. Они могутвосприниматьзначительныенагрузки,устойчивыпридинамическихвозмущениях;могутработатьпри большихскоростяхвращения;имеютбольшой срок службы; не вызывают серьезных аварий в случае неисправности; имеют низкую себестоимость и простоту в обслуживании.
Однако,гидродинамическиесилы,действующиевсмазочномслоеподшипника, могут служить причиной автоколебаний. Помимо этого причиной возникновения автоколебаний также является вязкая стратифицированная жидкость, частично заполняющая полость ротора.
В работе исследовано следующая модель роторной системы.
Жесткий вал, по середине которого без перекоса установлен ротор массой m с цилиндрическойполостью, высотой h и радиусом R. Вал вращается с посто-
яннойугловой скоростью Ω0 на подшипниках скольжения, которые жестко свя-
заны с массивным корпусом (фундаментом), прикрепленным к упругим изотропным опорам с коэффициентами жесткостей с/2 и приведенным коэффициентомдемпфированияk1/2.Учтемсилывнешнеготрения,приложенногокцилиндру ротора с коэффициентом трения k2.
376
Е.Л. Нуспеков, Б.Ж. Унайбаев, Б.Б. Унайбаев,В.А. Арсенин, Ж.А. Марденов
Цилиндрроторачастичнозаполненвязкойдвухслойнойстратифицированной жидкостью с кинематическим коэффициентом вязкости ν j . Обозначим че-
рез r, ϕ – полярные координаты, а, uj и vj радиальную и тангенциальную составляющие скорости частицы жидкости. Обозначим массу фундамента и подшипников жестко связанных между собой через M.
Для вывода уравнений движения системы, введем неподвижную систему координат Oxy иподвижнуюсистему O2ξ η, жесткосвязанную сротором. Пусть
в неподвижной системе координат х, у – координаты точки.
O2 (центрашипа илицилиндра),x1, y1 – координатыцентра тяжестифундамента O1, θ – полярный угол линии центров O1O2.
Угловую скорость ротора Ω0 считаем достаточно большой, что жидкость
в полости принимает форму кольца с внутренним радиусом r0.
Пренебрегаем силой тяжести жидкости и гигроскопическойсилой, таккак они намного меньше центробежной силой (RΩ02 ≥ g).
Толщина слоя жидкости намного меньше чем его высоты. Тогда движение стратифицированной жидкости в полости ротора можно принять плоским.
С учетом вышеуказанных допущений и обозначений, а также введя комп-
лексныевектора z =x+iy, |
z1=x1+iy1, |
Fr =Fx+iFy, тоуравнениядвижениярассмат- |
||||||||||||||||||||||||||||||||||||
риваемой системы можно записать в следующем виде: |
|
|
|
|
||||||||||||||||||||||||||||||||||
а) уравнения движения ротора и фундамента |
|
|
|
|
|
|
|
|
||||||||||||||||||||||||||||||
|
|
|
mz +k |
2z +2(Pe −iPθ)e |
iθ |
= Fr |
|
|
|
|
|
|
|
|||||||||||||||||||||||||
|
|
|
|
|
|
|
|
|
|
|
|
|
|
|||||||||||||||||||||||||
|
|
|
|
|
|
|
|
|
|
|
|
|
|
|
|
|
|
|
|
|
|
|
|
|
|
|
|
|
|
|
|
|
|
|
|
|
|
|
|
|
|
Μz1+ |
сz1+ k1z1−2(Pe −iPθ)e |
iθ |
= |
|
(1) |
||||||||||||||||||||||||||||||
|
|
|
|
|
0 |
|
|
|||||||||||||||||||||||||||||||
|
|
|
|
|
|
|
|
|
|
|
|
|
|
|
|
|
|
|
|
|
|
|
|
|
|
|
|
|
|
|
|
|
|
|
|
|
||
в) уравнения движения вязких жидкостей |
|
−i |
Ω0t+ϕ |
|
|
|||||||||||||||||||||||||||||||||
|
∂ u j |
|
|
v j |
|
|
∂ fj |
|
|
1 ∂ p j |
|
|
|
|
|
|
||||||||||||||||||||||
|
∂ t −2Ω0v j − r |
|
|
|
∂ ϕ = −ρ ∂ r −ze |
|
|
|
|
|
|
|
|
|||||||||||||||||||||||||
|
|
|
|
|
|
|
|
|
|
|
|
|
|
|
|
|
|
|
|
|
|
|
|
|
|
|
|
|
|
|
|
|
|
|
|
|
|
|
|
|
|
|
|
|
|
|
|
|
|
|
|
|
|
|
|
j |
|
|
|
|
|
|
|
|
|
|
|
|
|
|
|
|
|
|
|||
|
|
|
|
|
|
|
|
|
|
|
|
|
|
|
|
|
|
|
|
|
|
|
|
|
|
|
|
|
|
|
|
|
|
|
|
|||
|
∂ v |
|
|
|
v |
|
|
|
∂ f |
|
|
|
|
|
|
|
|
|
|
|
|
∂ p |
|
|
|
|
|
|
|
|
|
Ω |
|
|
(2) |
|||
|
j |
|
|
j |
|
|
j |
1 |
|
|
|
|
j |
|
|
|
−i |
t+ϕ |
|
|||||||||||||||||||
|
|
|
|
|
|
|
|
|
|
|
|
|
|
|
+ize |
|
|
|
|
0 |
|
|
|
|||||||||||||||
|
|
|
+ 2Ω0u j |
+ |
|
|
|
|
|
|
= − |
|
|
|
|
|
|
|
|
|
|
|
|
|
|
|
|
|
||||||||||
|
∂ t |
|
|
|
|
∂ r |
rρ |
|
∂ϕ |
|
|
|
|
|
|
|
||||||||||||||||||||||
|
|
|
|
|
|
|
|
|
|
|
|
|
|
|
|
|
|
|
|
|
|
|
|
|
|
|
|
|
|
|
|
|
|
|
|
|
|
|
|
|
|
|
|
|
|
|
|
|
|
|
|
|
|
|
|
|
|
j |
|
|
|
|
|
|
|
|
|
|
|
|
|
|
|
|
|
|
|
Уравнение неразрывности при ρj |
= const |
|
имеет вид : |
|
|
|||||||||||||||||||||||||||||||||
|
|
|
|
|
|
|
|
|
|
|
|
|
∂ vj |
|
|
|
|
|
|
|
|
|
|
|
|
|
|
|
||||||||||
|
|
|
|
|
|
|
|
|
|
∂ ru j |
|
|
|
|
|
|
|
|
|
|
|
|
|
|
|
(3) |
||||||||||||
|
|
|
|
|
|
|
|
|
|
|
∂ r |
|
|
+ ∂ ϕ = 0 |
|
|
|
|
|
|
|
|||||||||||||||||
|
|
|
|
|
|
|
|
|
|
|
|
|
|
|
|
|
|
|
|
|
||||||||||||||||||
|
|
|
|
|
|
|
|
|
|
|
1∂ u j |
|
|
|
|
|
|
∂ vj |
|
|
v j |
|
|
|
|
|
|
|
|
|||||||||
Здесь |
|
|
|
|
|
fj = r |
|
|
|
− |
|
|
− |
|
|
|
|
|
|
|
|
(4) |
||||||||||||||||
|
|
|
|
|
|
∂ ϕ |
|
∂ r |
r |
|
|
|
|
|
|
|
||||||||||||||||||||||
fj – лапласиан функций тока.
377

Численные методы расчетов в практической геотехнике
Граничные условия гидродинамической задачи ставятся следующим образом:
а)Условияприлипаниячастицыжидкостикстенкеротора (r=rn=R,условия на стенке ротора):
un|r=R=0 |
(5) |
vn|r=R=0 |
(6) |
б) Равенство величин компонентов скорости частицы, касательного и нормального напряжения жидкостей на их границах раздела (r = rj), а также равенстваихсмещенияотравновесногоположения(условиянаграницахразделажидкостей):
|
|
|
uj=uj+1 |
|
|
|
(7) |
|
|
|
vj=vj+1 |
|
|
|
(8) |
|
|
|
∂ξj(ϕ,t)/∂t = uj = uj+1 |
|
|
(9) |
|
νjρj((∂uj/∂ϕ)/r+∂vj/∂r-vj/r)=νj+1ρj+1(1/r)(∂uj+1/∂ϕ)+∂vj+1/∂r-vj+1/r) |
(10) |
||||||
[-p |
+ ρΩ |
2(r2–r2)/2 + 2νρ∂u /∂r]| |
=[-p +ρ |
Ω |
2(r2- r2)/2 + |
|
|
j |
j 0 |
j |
j j j r=rj +ξj |
j+1 |
j+1 0 |
j |
|
|
|
|
+2νj+1ρj+1(∂uj+1/∂r]|r=rj+ξj+1 |
|
|
(11) |
|
Условия (7) – (9) являются кинематическими, а (10) и (11) – динамическимиусловиями гидродинамической задачи на границах раздела слоевжидкостей.
в) условия равенства нулю компонентов касательного и нормального напряжения реакции жидкости на ее свободной поверхности:
ν1ρ1(1/r(∂u1/∂ϕ)+ ∂v1/∂r – v1/r) = 0 |
(12) |
||||||||
[p |
-ρ Ω |
2(r2-r |
2)/2+2υ ρ ∂u /∂r]|r=r |
+ξ=0 |
(13) |
||||
1 |
1 |
0 |
0 |
1 |
1 |
1 |
0 |
|
|
А также кинематическое условие на свободной поверхности жидкости
∂ξ0(ϕ1t)/∂t=u1|r=r0 |
(14) |
где uj, vj, pj радиальное, тангенциальное составляющие скорости частицы и давление в j – жидкости соответственно.
ξ0(ϕ,t), ξj(ϕ,t) – смещениясвободнойповерхностииграницыразделаслоев жидкостей от равновесного состояния.
Fz =Fx+Fy –комплексное выражение гидродинамической силы, которое определяется формулой
378
Е.Л. Нуспеков, Б.Ж. Унайбаев, Б.Б. Унайбаев,В.А. Арсенин, Ж.А. Марденов
|
2π |
|
|
F =(Rh/m) ∫ |
σ | ei(Ω0t +ϕ)dϕ |
(15) |
|
z |
0 |
n r=R |
|
где
2π
Fx = Rh ∫ σn|r=R cos(Ω0t + ϕ)dϕ
0
(16)
2π
F = Rh ∫σn|r=R sin(Ω0t + ϕ)dϕ |
|
y |
0 |
|
|
Здесь σnr=R=(pn%r=R+ρnΩ02(r2–r02)- 2νn ρn ∂un/∂r) – нормальное напряжение самой тяжелой жидкости на стенку ротора, Fx.Fy – составляющие силы реакций
жидкости по осям координат, Pe,Pθ − составляющие сил реакций смазочного слоя подшипника. Выражения которых определяются формулами
|
|
6ηLR3 |
[(Ω0 |
|
|
|
(a)] |
|
|
|
|
1 |
|
|
|
||||
Pe = |
|
|
−2θ)F1(a)+ 2aF2 |
(17) |
|||||
δ2 |
|
||||||||
|
|
|
|
|
|
|
|
|
|
|
6ηLR3 |
|
|
|
|
|
|
|
|
|
|
1 |
|
|
|
|
|
|
|
Pθ = |
|
δ2 |
[(Ω0 −2θ)F3 |
(a)+ 2aF3 |
(a)] |
(18) |
|||
|
|
|
|
|
|
|
|
|
|
где η− коэффициент вязкости смазывающей жидкости; |
L,R − длина и радиус |
||||||||
втулкиподшипников; δ− зазор междушипом иподшипником; r1− радиусшипа;
δ = R1−r1.
Сначала решаем дифференциальные уравнения движения жидкости (2) с граничными условиями (5) – (14) методом УМФ.
Представив движение ротора и фундамента на комплексной плоскости в
виде:
|
z = δ Αeiωt |
(19) |
|
z |
i |
ωt+α |
(20) |
= δ Βe |
|
||
1 |
|
|
|
находим комплексноевыражение гидродинамической силы, для двухслойной несмешивающиейся вязкими жидкостями, на стенке ротора.
F |
= F |
+iF |
= m |
L2 |
δ |
φ+ Aω2 |
expiωt |
(21) |
r |
x |
y |
|
|
|
|
||
|
|
|
379 |
|
|
|
||

Численные методы расчетов в практической геотехнике
Исследуем устойчивость системы около ее равновесного состояния. Для этого разложим функции F1(a), F2(a), F3(a) и F4(a) по степеням a в окрестности a = 0 и далее удерживая только линейные члены, имеем:
|
|
|
|
|
′ |
|
|
|
|
Pe = χ0[(Ω0 −2θ)(F1(0)+aF1(0))+ 2aF2(0)] |
|
||||||||
P |
|
|
|
|
(0)+aF |
|
|
|
(22) |
= χ [(Ω −2θ)(F |
(0))+ 2aF (0)] |
|
|||||||
θ |
0 |
0 |
|
3 |
′ |
|
4 |
|
|
|
3 |
|
|
||||||
|
|
|
6ηLR3 |
|
где χ |
0 |
= |
1 |
|
δ2 |
||||
|
|
Для первой и третьей гипотезы Зоммерфельда F1(0), F1′(0), F3(0) и F4(0)
равны нулю. Следовательно, обобщенные линеаризованные выражения проекций гидродинамической силы смазочного слоя примет вид:
P |
= 2χ |
|
aF |
|
(0) |
|
|
||
e |
|
0 |
|
2 |
|
−2θ)F′ |
|
|
|
P |
= aχ |
0 |
(Ω |
0 |
(0) |
(23) |
|||
θ |
|
|
|
3 |
|
|
|||
Длядальнейшегоисследованияпереходимот z1 |
кновойпеременнойz2 т. е. |
||||||||
имеем z1=z−z2. Здесь z2 =exp(iθ) вектор отклонения центра шипа от равновес-
ного положения. θ = ω+ θ |
−частота колебаний ротора, ω – как прежде частота |
|||||||||||||
|
|
1 |
|
|
|
|
|
|
|
|
|
|
|
|
автоколебаний системы на границе устойчивости, θ |
|
− малые вариации частоты |
||||||||||||
|
|
|
|
|
|
|
|
|
1 |
|
|
|
|
|
на границе устойчивости так как e = aδ т. е. |
|
|
|
|
|
|
||||||||
|
|
|
|
z |
2 |
= aδeiθ |
|
|
|
|
|
(24) |
||
или |
|
|
|
|
|
|
|
|
|
|
|
|
|
|
|
|
|
|
|
|
|
|
|
|
|
|
|
|
|
|
|
|
|
aδ = z |
2 |
e−iθ |
|
|
|
|
|
(25) |
||
|
|
|
|
|
|
|
|
|
|
|
|
|
|
|
С учетом (4.15) из система (4.5) имеем: |
|
|
|
|
|
|
||||||||
mz + k2z + Μ(z |
− z2 )+ c(z − z |
2 )+ k1 |
(z − z2 )= Fr |
|
||||||||||
|
|
|
|
|
|
|
|
|
|
|
|
|
|
(26) |
|
− z2 ) |
+ C(z |
− z2 )+ k1(z − z2 )= 2(Pe −iPθ )e |
iθ |
||||||||||
Μ(z |
|
|
||||||||||||
|
|
|
|
|
|
|
|
|
|
|
|
|
|
|
|
|
|
|
|
|
380 |
|
|
|
|
|
|
|
|
Е.Л. Нуспеков, Б.Ж. Унайбаев, Б.Б. Унайбаев,В.А. Арсенин, Ж.А. Марденов
2 |
(Pe − iPθ )e |
iθ |
′ |
(0)− F2 |
|
′ |
(0)]z2 |
|
(0)} |
|
|
(27) |
|||
|
ω0m |
|
|
= χ{i[2[F3 |
(0)]θ − Ω0F3 |
+ 2z2F2 |
|
|
|||||||
|
|
|
|
|
|
|
|
|
|
|
|
|
|
|
|
гдеχ = 3k0; |
k0 = |
4ηL |
|
|
– характеристическая постоянная Тондла; ϕ1 = |
δ |
; |
Для |
|||||||
ϕ3mω |
|
|
|
||||||||||||
|
|
|
0 |
|
|
|
|
|
|
|
|
R1 |
|
||
|
|
|
1 |
|
|
|
|
|
|
|
|
|
|
|
|
первой гипотезы Зоммерфельда F2 (0)= F3′(0)= π.
Полагаем, что в окрестности устойчивого равновесного положения шипа. θ = ωt + α т. е. θ = ω , a = 0, где α − угол заключенный между векторами
z и z2 .
Теперь подставляя (22) в (24) с учетом (25) и (26), (27), получим систему однородных уравнений относительно a и Α.
[1− (1+ µ1 )τ2 − µ2φ0 + i(D1 + D2 )τ]Α + (µ1τ2 −1− iD1τ)eiαa = 0 |
|
(1− µ1τ2 + iD1τ)Α + [µ1τ2 −1− iτD1 − χF31(0)(i 2τ − s)]eiαa = 0 |
(28) |
гдеω0 = 
 mc − – собственная частота колебаний системы, µ2 = mmL2 −отношение массыжидкостикмассеротора; µ1 = Μm − отношениемассы фунда_ментакмас-
се ротора; s = |
Ω0 |
− безразмерная угловая скорость ротора; |
τ = |
ω |
− безразмер- |
|||||
|
||||||||||
|
ω0 |
|
|
|
|
|
|
ω0 |
||
ная частота автоколебаний системы; D1 = |
k1 |
; |
D2 = |
k2 |
|
− безразмерные ко- |
||||
|
|
|
mω0 |
|
mω0 |
|
|
|
||
эффициенты внешнего трения. Изусловия равенство нулю определителя систем (28), получим характеристические уравнения системы относительно τ.
[1−α1τ2 −µ2φ0 |
+iD12τ][µ1τ2 −1−iτD1 −χiF31(0)(2τ−s)]− |
(29) |
||||
(1−µ1τ2 |
+iD1τ)(µ1τ2 −iD1τ−1)= 0 |
|||||
где |
|
φ0 = |
φ |
+τ2 |
|
|
|
|
|
|
|||
|
ω2 |
|
||||
|
|
0 |
|
|
|
|
|
D12 = D1 + D2, |
α1 =1+µ1. |
(30) |
|||
|
|
381 |
|
|
||

Численные методы расчетов в практической геотехнике
В общем случае τ является комплексным числом, действительная часть которогоопределяетбезразмернуючастотуавтоколебаний, амнимаячасть–сте- пень неустойчивости системы.
Характеристическое уравнение является трансцендентно-нелинейным так как искомое число τ входит в аргументы функций Бесселя и Неймана.
Исследование коэффициентовуравнения при χ = 0 показывает, что в этом
случае фундамент и ротор с жидкостью движется как одно целое. Полученная система полностью эквивалентна жесткому ротору с полостью, частично заполненной двумя вязкими жидкостями установленного на упругих опорах.
В ней существует две зоны неустойчивостей, которые начинаются сразу после критической скорости пустого ротора, и занимают довольно широкий спектр угловой скорости ротора. Сростом степени заполнения q ширина зон неустойчивостей сначала расширяется, затем при еще более высоких q сужается, а когда ротор полностью заполнен жидкостью зоны неустойчивостей, исчезает. По мере роста плотностей жидкостей границы зон неустойчивостей смещаются вобластьвысокихскоростейротора. РосткоэффициентовдемпфированияD1 и D2 приводит к сужению зон неустойчивостей. Увеличение жесткости опор вызывает смещение границы зон неустойчивостей в сторону высоких скоростей ротора.
2. Случай пустого ротора (µ2 =0).. Из уравнения с учетом µ2=0, видим что,
коэффициенты характеристического уравнения зависят от шести параметров: характеристической постоянной χ, безразмерных коэффициентов демпфирования фундамента D1 и ротора D2 отношения масс фундамента к массе ротора µ1, безразмерной частоты колебания жидкости τ и угловой скорости ротора s.
Поэтомуисследования устойчивостисистемыдолжно состоять внахождении областей устойчивости в пространстве названных параметров.
Увеличение параметра D1 и D2 приводит расширению зоны неустойчивости системы. Более того, рост D1 и D2 может привести к потере устойчивости системы.
С ростом параметра χ расширяются зоны неустойчивости. Увеличение отношения массы фундамента к массе ротора µ1 приводит к расширению зоны неустойчивости системы.
В предельном случае, когда внешние силы трения отсутствуют (D1=D2=0), находим два значения τ :
τ1 = |
|
1/(µ1 +1) |
|
(31) |
||
τ2 = |
|
|
|
(32) |
||
1/µ1 |
||||||
которым соответствует два значения параметра s. |
|
|||||
s = |
|
|
(33) |
|||
2/(µ1 +1) |
|
|||||
|
382 |
|
|
|
||
Eun Chul Shin, Hoo Chul Park, Jeong Jun Park
s = 2 |
|
(34) |
1/µ1 |
Увеличение массы фундамента приводит к смещению как первой, так и второй границ неустойчивости в область меньших значений угловых скоростей ротора.
Поэтомуисследование устойчивостисистемыдолжна состоять в нахождении областей устойчивости в зависимости от названных параметров.
Таким образом, при всех значениях параметров, система имеет три зоны неустойчивости. Сначала исследуем влияние параметров подшипников на динамику системы. Для этого перейдем к количественному анализу областей устойчивости для различных гипотез о границах смазочного слоя.
Для первой гипотезы. Зоммерфельда F3'(0)=π, а для второй гипотезы Зоммерфельда F3'(0)=π/2.
Последовательно подставив эти значения функции F3'(0) в выражения коэффициентов иварируя значения χ вшироких пределах, находим границы и ширины зон неустойчивости системы.
Eun Chul Shin (Professor of Civil & Environ. Engrg.,
Univ. of Incheon, Republic of Korea),
Hoo Chul Park (Master Course of Civil & Environ.
Engrg., Univ. of Incheon, Republic of Korea),
Jeong Jun Park (Research Professor of Civil & Environ.,
Engrg., Univ. of Incheon, Republic of Korea)
ANALYSIS ONTHEBEHAVIOR OFLABORATORYMODELED ASPHALT PAVEMENTDUE TO FREEZINGAND THAWING
The frost heaving and thawing characteristics of asphalt paved road structure wasevaluatedinthelargescalefreezerwhichhasaspecificationoftemperaturerange -20 °С ~10 °С and 3.2m(L) × 3.2m(B) × 2.4m(H) in size. The insulated steel box with the size of 0.9m(L) × 0.9m(B) × 0.9m(H) was used to simulate actual pavement road structure. The variation of temperature, heaving pressure and displacement of the frostheavingweremeasuredthroughtheinstrumentofTDS-602datalogger.LWD(light weightdeflectometer) was used to determine the change of deflection due to the freezing and thawing. Furthermore, the influence of anti-freezing layer to the freezing of the subgrade soil was studied to verify the function and effectivenessof the anti-freez- ing layer.
383
Численные методы расчетов в практической геотехнике
1.INTRODUCTION
The pavement structures are subjected to freezing and weakening during the spring season. Consequently, the mechanical properties of pavement structures can be greatly affected by the seasonal changes in temperature and soil moisture. During the winter season, the stiffness ofunbound layers generallyincreases because of ice bonding of soil particles in the base and sub-base, and ice lens formation in the subgrade. The pavement structure during the spring season may become saturated from thawing ice, and the stiffness can be substantially reduced. Under such conditions, substantial settlements can occur if the structure is exposed to the loading of heavy freight vehicles.
The contribution of infiltrating melt water can further decrease the bearing capacityand extend the thawweakening period. During the freezing season, intermittent freeze-thaw cycles can also affect to the structural adequacy.The soil begins to be gradually frozen if the external temperature is maintained less than 0!. At this time, while the moisture of the underground which is not frozen by the capillaryphenomena moves to the freeze direction and the ice lense is generated, this ratio and size increases gradually, the ground protrudes. The ice shape which is not frozen in the temperature of the soil, then the floating moisture is formed. It can be the phenomenon that accordingly the ground inflates and it rises the in-phase. This phenomenon is called as the frost heaving.
Over the years, many researchers have studied the impactofseasonal frost conditions on pavement performance. However, the main effort has been concentrated on freezing phenomena, with considerably less focus on thaw weakening. Therefore, in this study, thelarge scalelaboratorytestwasperformed inside the largefreezerand the stiffness characteristics for the roadbed materials prior to freezing and thawing of the roadbed material were analyzed by conducting the light weight defletometer(LWD) test. The loading pressure and the variation of vertical deflection were measured during the process of freezing and thawing. The influence of crushed natural aggregate to the freezing of the subgrade soil wasstudied to verifythe function and effectivenessof the anti-freezing layer.
2.LABORATORYMODELTEST IN THE FREEZING CHAMBER
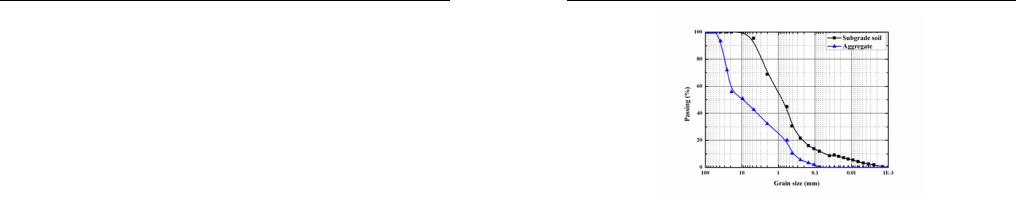
Laboratorytest onthesubgradesoil samplesconsistedofdeterminingthegrainsize distribution,specific gravity,Atterberglimits,andmodified compactiontests.The results of the sieve analysis and hydrometer test show that the soil had about 12.0 % finer than No.200 U.S sieve. The coefficient of uniformity (Cu) and gradation (Cg ) are 32.38 and 3.16, respectively. Figure 1 shows the grain size distribution curves of subgrade soil and aggregate. The specific gravity of subgrade soil was determined as 2.62 by following the ASTM test designation D-854. The plasticity index was determined and it is turned out to be non-plastic.
384
Eun Chul Shin, Hoo Chul Park, Jeong Jun Park
Figure 1. Grain size distribution curves of used soil samples
The laboratory model test condition was classified according to the freezing temperature and asphalt pavement as tabulated in Table 1. The laboratory model test was performed in order to measure the displacement and heaving pressure of the asphalt pavement with elapsed time due to freezing.As shown in Figure 2, the temperature of the freezing chamber can be varied from -20° to +10°. The size of freezing chamber is 3.2m(width) × 3.2m(length) × 2.4m(height).
Thelaboratorymodeltestswereconductedinasteelboxmeasuring0.9m(width) × 0.9m(length) ×0.9m(height).Themodeltestboxwas fabricatedbyusing steelpanel and braced with angle irons to avoid yielding during soil placement and light weight deflectometer(LWD)loadingonthesurfaceofpavement.Thesubgradesoilwasplaced in the model test box and compacted in 10cm thick layer using a flat bottomed vibra-
tory rammer to meet the required relative density, 95 % of rd(max) .
The light weight deflectometer shown in Figure 3, formerlyknowbythe proprietary name Prima 100, is a commercially available, portable dynamic plate test device designed for use on unbound materials, lightly bound materials and thinly surfaced pavements. It is suitable for use in confined spaces. The surface deflection values measured by the LWD test are used in order to evaluate the structural characteristic of paved road. D0 mean the deflection of the section center. D0 Ratio can calculate to using Eq.(1).
D0 |
D -D |
* |
(1) |
|
Ratio(%)= 100 × |
||||
|
0 |
0 |
|
|
|
|
D0 |
|
|
Where D0 is the deflection of the segment where there is not anti-freezing layer(Non-AFL); D0* is the deflection of the segment where there is anti-freezing layer(AFL).
SCI in Eq.(2) is the index which represents a surface curvature index for an upper layer and a sub-base layer. The greater value of SCI is the reflection of greater deflection of asphalt paved road structure.
385

Численные методы расчетов в практической геотехнике
SCI = D0 - D60 |
(2) |
Where D0 is the deflection from the center of the loading plate; D60 is the point where 60cm has reached standing deflection from the loading plate.
SCI |
SCI-SCI* |
ґRatio(%)= |
(3) 100 |
|
SCI |
|
|
Where SCI is the SCI of the segment which does not have an anti-freezing layer; SCI* is the SCI of the segment which does have an anti-freezing layer.
Table 1
Sequence of laboratory model test condition
Test no. |
AFL Case |
Non-AFL Case |
|
Test condition |
(Case 1) |
(Case 2) |
|
Temperature |
-10 |
-10 |
|
Asphalt pavement |
5cm |
5cm |
|
layer |
|||
|
|
Composition of |
Sub-base layer |
10cm |
10cm |
|
|
|
|
||
Asphalt pavement |
|
|
|
|
Anti-freezing layer |
16cm |
0 |
||
|
||||
|
|
|
|
|
|
Subgrade soil layer |
40cm |
56cm |
|
|
||||
|
|
|
|
|
Moisture content |
Subgrade soil layer |
10.0 |
10.0 |
|
|
|
|
||
(%) |
|
|
|
|
Aggregate layer |
4.8 |
4.8 |
||
|
||||
|
|
|
||
Asphalt paving mixture |
Ascon No. 7, 8(Maximum size : 13mm) |
|||
|
|
|
|
|
Figure 2. Physical dimension of model test box |
Figure 3. Photo of the LWD and the insulated |
deflectometer |
steel box |
Eun Chul Shin, Hoo Chul Park, Jeong Jun Park
3.LABORATORYMODELTEST RESULTS
The elapsed time to reach the temperature of 0 °С at the subgrade surface of with and without anti-freezing layer case is shown in Figure 4. With comparison between AFL Case and Non-AFL Case, the covering with an aggregate layer over the subgrade soil is greatly extended the time of reaching 0°С.
The variations of displacement and heaving pressure shown in Figure 5 are parallel to the direction of heat flow with the elapsed time for with and without antifreezing layer conditions. In with anti-freezing layers, because of the size of the particles,gravityforcesaremostlikelytopredominatebothinthemineralandliquidphases. Hence,the surfaceforcesare,bycomparisonwiththegravityforces,so smallthattheir effect may be neglected. In consequence, water in the soil voids will freeze as the ice front propagates into the void spaces resulting therefore in little movement of water. Where the freezingplane progresseslaterallyin avertical wall, the movement induced by ice lens formation is also in the lateral direction. If the heat flow pattern can be anticipated for a particular situation, the direction of heaving and the associated pressures can be reliably predicted (Penner, 1974).
Itisobserved fromthistestingthatthedeflectionsatthe centerofpavementstructure with anti-freezing layer are smaller than those of without anti-freezing layer. The deflectionreductionratesareapproximately77%intheboundary. Itwasalso foundthat the use of anti-freezinglayer enablestoreduce the surface curvature index(SCI) valuesare 2~45 %, as shown in Figure 6. This fact indicates that the anti-freezing layer should be considered as a structural layer on the asphalt pavement system.
The cyclic freezing and thawing introduces fatigue damage to the pavement structure. Capillary forces and lack of drainage through the pavement structure due to top-downthawingarefactorsthatcontributetofreeze-thawdamage.Intheevent thawing occurs in the pavement structure, as vehicle loading is not distributed and transferred as per the design, deformation of the pavement structure occurs. If the thaw progresses into the subgrade, significant strength reduction occurs resulting in the need of spring load restrictions to be enforced to mitigate damage.
Figure 4. The variation of temperature from the subgrade soil layer
386 |
387 |

Численные методы расчетов в практической геотехнике
(a) Heaving amount (b) Heaving pressure
Figure 5. The variation of heaving amount and heaving pressure with elapsed time for asphalt pavement conditions
(a) Before freezing (b) After thawing Figure 6. The variation of SCI values as with and without anti freezing layer
4.CONCLUSIONS
In this study, the laboratory model test which simulated the asphalt pavement structure was conducted in the freezing chamber. The variations of heaving amont, heaving pressure with elapsed time for presence conditions of anti-freezing layer were determinedthroughthelaboratorymodeltest.Theloadingdeflectionforthecomposited asphalt pavement prior to freezing and after thawing were determined by the application of LWD.
Based on the results of the laboratory asphalt paved road model test, a layer of anti-freezing aggregate gives the protection of subgrade soil from freezing and hence reduces the heaving amount and heaving pressure. In with anti-freezing layers, because of the size of the particles, gravity forces are most likely to predominate both in the mineral and liquid phases. Hence, the surface forces are, by comparison with the gravity forces, so small that their effect may be neglected.
The deflection and surface curvature index for the paved road structure prior to
388
A.Zh. Zhussupbekov, Hoe Ling, R.E.Lukpanov, S.B.Yenkebayev, A.Tulebekova ,G.A. Sultanov, M.V.Boiko
freezing are much higher than those of the asphalt paved road structure subjected to freezing and thawing cycles. So, a layer of anti-freezing aggregate gives structural integrity for asphalt paved road.
ACKNOWLEDGEMENTS
This research was supported by a grant (08 Technology Innovation C01Q81) fromConstructionTechnologyInnovationProgram(CTIP)fundedbyMinistryofLand, Transportation and Maritime Affairs (MLTM) of Korean government.
REFERENCES
1.Erik Simonsen and Ulf Isacsson(1999), Thaw weakening of pavement structures in cold regions, Cold Regions Science and Technology 29, pp. 135-151.
2.Kujala, K.(1997), Estimation of Frost Heave andThaw Weakening byStatisticalAnalysis and Physical Models, Proc. of International Symp. On Ground Freezing and Frost Action in Soils, Lulea, Sweden, pp.31-41.
3.Miller, R,D.(1972), Freezing and Heaving of Saturated and Unsaturated Soils, Highway Research Record 393, pp. 1-11.
4.Shin, E. C. and Park, J. J.(2011), Soil Freezing Characteristics ans Temperature Distribu- tioninIn-groundLNGStorageTank,International JournalofoffshoreandPolarEngineering,Vol.21, No.4, pp.1~10.
5.Takagi, S., Principles of Frost Heaving, US Army CRREL Research Report, 140, 1965,
pp24.
6.Yong, R. N. and Warkentin, B. P., Soil Properties and Behaviour, Elsevier Scientific Pub-
lishingCompany, 1975, pp.383-419.
A.Zh. Zhussupbekov, Hoe Ling (Columbia University, NewYork, USA),
R.E.Lukpanov, S.B.Yenkebayev, A.Tulebekova (Geotechnical Institute of L.N. Gumilyov Eurasian National University, Astana, Kazakhstan) G.A. Sultanov, M.V.Boiko (Ltd, BasisA,Almaty, Kazakhstan)
GEOTECHNICALISSUES OFPILING FOUNDATIONS ON PROBLEMATICALSOILGROUND OFKAZAKHSTAN
Pile foundations have become more essential in the implementation of megaprojects of the new capital of Kazakhstan – Astana. Many advanced pile technologies are emerging nowadays, but unfortunately Kazakhstan Standards have not accommodated for modern pile design, testing and quality control methods. In this paper, some aspects of modern pile design concepts of Kazakhstan construction are
presented, as well as contemporary approach to the testing and monitoring. Some features of modern pile technology design such as CFA and DDS are revealed in this
389
Численные методы расчетов в практической геотехнике
paper.It is shown the advantagesand disadvantages of existing loading test methods, giving recommendations leading to future amendment of Kazakhstan Standards regarding pile design. It is also necessary to incorporate modern geoengineering approachinthequalitycontrolofpilefoundation installation.Thepaperillustrated also the comparison of field piling tests results with numerical analysis obtained by FEM, following the procedures of Prof. Tadatsugu Tanaka.
1.INTRODUCTION
Nowadays many megaprojects are emerging in the new capital of Kazakhstan – Astana. The high rates of construction and appearance of high-rise buildings having modern architecture, and engineering megaprojects, led to a wide use of pile foundations.
Modern construction puts modern requirements in front of engineers and designers, and so instead of traditional decisions it came to the use of new economical and ecological efficient technologies such as CFA(continuous flight auger), DDS (drilling displacement system), steel “H” piles, and so on.
It is well known that pile foundation is one of the most widely used types of foundation at the construction sites of Kazakhstan. Application of pile foundation is explained by necessity of ensuring a high bearing capacity for high-rise buildings.
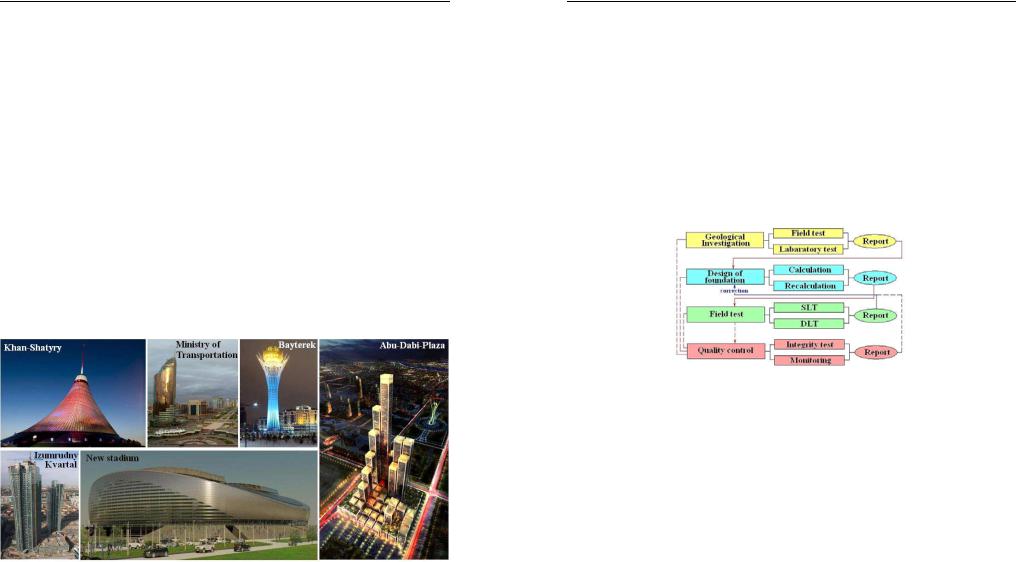
Figure 1. Megaprojects of New Capital of Kazakhstan –Astana
During the last 15 years, many high-rise buildings supported by pile foundation are rising up in Astana, the new capital of Kazakhstan. Following megaprojects are already completed: Ministry of Transportation and Communication, Housing estate – IzumrudnyKvartal(Emeraldsquare),CulturalandEntertainmentCenter–KhanShatyry and so on(Figure1). Manymegaprojectsare underconstructionorinplanning. Oneof
390
A.Zh. Zhussupbekov, Hoe Ling, R.E.Lukpanov, S.B.Yenkebayev, A.Tulebekova ,G.A. Sultanov, M.V.Boiko
the unique projects is the housing estate “Abu-Dabi Plaza” which started on 1 July 2011 inAstana. The project of housing estate was designed by famous architect Norman Foster. By preliminary evaluation, the cost of project exceeds 1.5 billion US dollars. This will be the highest building in CentralAsia and ranked 14th in the world. “Abu-Dabi Plaza” – a complex from several towers, united around the main building with a height 382 meters – 88 floors (Figure 1).
2. GENERALASPECTS OFKAZAKHSTAN PILE DESIGN CONCEPT
It has been mentioned previously that existing Kazakhstan standard documentation of pile design is out of date and does not meet the requirements of modern engineering. The standard needs to be revised. Nowadays, conception of pile foundation design is in the process of modernization, as presented in Figure 2.
Figure 2. Pile foundation design concept
Design ofpile foundation includes two critical stage of analyses: bearing capacity and settlement analysis. The preliminary design is performed based on the engineering and geological investigation ofconstruction site.Accuracy of pile design generallydependsontheaccuracyofdata presented in geologicalreport.Final piledesign project is corrected after approval by field tests.
The preliminary configuration (length and cross section) of pile depends on required bearing capacity of pile and may be determined by following equation, recommended by Kazakhstan Standard:
Fd = γc (γcR RA +u∑γcf fi hi ) |
(1) |
Where γc – safety factor; γcR andγcf – coefficients of soil work condition under the pile tip and surrounding of pile, respectively; R, fi – soil resistance under the pile tip
and shaft resistance respectively, kPa; A – cross section of pile, m2; hi – thickness of i-layer, m.
In this case, the results obtained by cone or standard penetration tests (CPT or SPT) and plate load test are more valuable, particularly to definition of shaft and tip resistance of soil.
391
Численные методы расчетов в практической геотехнике
Unfortunately, existing Standards do not take into account soil compaction under the high concrete pressure in case of CFAtechnology and soil displacement without excavation in case of DDS technology that lead to reduction of settlement and increase in bearing capacities of pile foundation (Sultanov at al, 2010). In connection with aforementioned, it is suggested to use following coefficients of soil working condition as presented in Table 1.
Table 1
Coefficient of soil work condition
Type of pile |
YcR |
Ycf |
Driving Pile |
1,0 |
1,0 |
Boring Pile |
0,7-1,0 |
0,7 |
DDS (FDP) Pile |
1,3 |
1,0 |
CFA Pile |
1,0 |
1,0 |
To accurately analyze the bearing capacity of CFApile, it is necessary to take into account volumechange of(“r)of borehole, by appearance in borehole additional pressure; with classical solution of Lambe based on theory of elasticity in linear formulation, as defined as (Ashkey, 2008):
r = |
(1+ µ) r σhconcrete |
(2) |
|
Eh |
|||
|
|
where, µ – Poisson ratio of concrete (µ=0.20); r – normal pile radius;σhconcrete – lateral
stress of concrete to soil; Eh – Young modules considering soil layer for horizontal
deformation, kPa.
Predictablesettlementisperformedby«methodoflayer-wisesummation»(word- for-word). The general principle of this method is definition of settlement in limited compaction zone by following equation, recommended by Kazakhstan Standard:
, |
(3) |
where σzp – stress in soil due to loading, kPa; β – coefficient depending on radial expansion of soil; hi – height of i- layer of soil, m; Ei – Young modulus of i- layer of soil, kPa.
Compaction zone is conditionally equal – when stress from weight of soil quintuple more than stress from pile load. In this case accuracy of Young modulus is very important. Young modulus may be determined by laboratory or field test. It is suggested to use Young modulus with allowance of depth of load application as defined after SLT. The principle of this method is assuming pile as plate (Yenkebayev, 2008). Young modulus may be defined by following equation:
(4)
392
A.Zh. Zhussupbekov, Hoe Ling, R.E.Lukpanov, S.B.Yenkebayev, A.Tulebekova ,G.A. Sultanov, M.V.Boiko
where |
– bearing capacity of pile obtained by SLT of pile, кN; – cross section of |
pile, m2;  – settlement of single pile by SLT;
  – parameter depends on relative thicknessofcompaction layer(
 ) and relationship semi-length offoundationto
the semi-width ( ).
).  – same parameter in case of unlimited thickness of
compaction layer.
Generally this method is used for predicting settlement of pile-raft foundation by SLT of single pile. Settlement of piled-raft foundation defined by aforementioned «method of layer-wise summation».
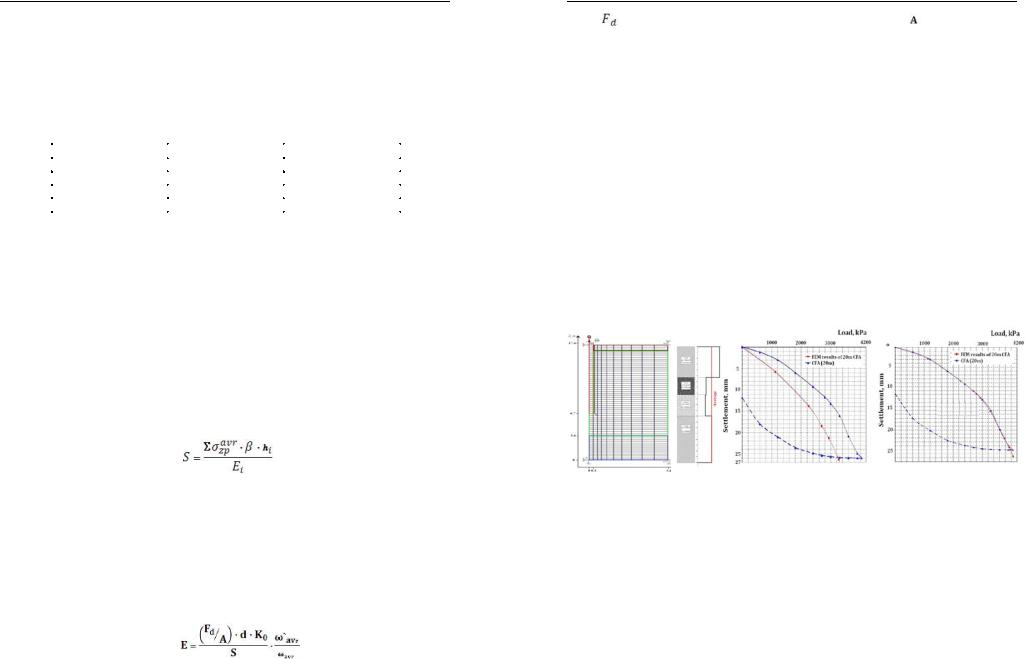
Recently forecast by FEM analysis has become more acceptable. FEM allows relativelyreliableanalysisofpilesettlementandbearingcapacityinashorttime.However, application of FEM analysis is confined by absence of requirements in existing Kazakhstan Standards. Results of FEM analysis depend on calculation model. In case of correct approach FEM analysis gives very satisfied convergence. Example of comparisonresultsofFEM and SLTof CFApileis presented inFigure 3,usingthenumerical approach proposed by Prof. Tadatsugu Tanaka. The first diagram shows result of incorrect FEM analysis, second shows FEM analysis taking into account expansion of pile due to ofhigh pressure of concrete. The FEM mesh and average expansion of pile body depending on soil strength is also presented in Figure 3.
Figure 3. FEM analysis of CFApile
3. FIELD TESTOFPILE FOUNDATION
Dynamic load test (DLT)
DLT is a fast bearing capacity analysis field test and give more or less reliable value of pile bearing capacity. For definition of the bearing capacities of piles, it is required to use average refusal which are obtained during redriving of the piles after their “rest”. The rest time depend on soil condition of site: for clayey soil 6–10 days, for sandy and gravel soils up to 3 days.
Bearing capacity of the piles is defined by following empirical equation:
393
Численные методы расчетов в практической геотехнике
|
ηAM |
|
|
|
|
|
|
|
|
|
|
|||
F = |
|
|
4E |
d |
m + ε2 |
(m |
2 |
+ m ) |
|
|||||
|
|
1+ |
|
|
1 |
|
3 |
|
−1 |
(5) |
||||
2 |
|
|
m1 + m2 + m3 |
|||||||||||
u |
|
|
|
ηASa |
|
|||||||||
|
|
|
|
|
|
|
|
|
|
|
|
|
|
|
where η=factor, dependent on concrete strength of the piles; А=cross section of tested pile; М=1 – factor, dependent on pile driving hammers impact; Еd =effective energy of blows of the hammer, kNm.
According to KazakhstanStandard at least 6 piles must be tested byDLT on each construction site.
Static Load Test (SLT)
SLT one of the more reliable field tests in analyzing pile bearing capacity. SLT should be carried out for driving pilesafter the “rest”and for bored pilesafter achievements of the concrete strength, by more than 80%.
According to requirements of Kazakhstan Standard – SNiP RK 5.01-03-2002 –
ultimate valueofsettlementofthetestedpileisdeterminedas and depending oncategoryofconstructionisequalto16or 24mm.Thelastargumentshowsconditional character of SLT method.
According to Kazakhstan Standard 1 % of constructed piles on construction site must be tested by SLT, but at least 2 SLTs in a site must be done.
Comparison of SLT and DLT
SLT and DLT both are practised in Kazakhstan construction.According to experience on construction sites of Astana, some difference exists between SLT and DLT results. Moreover, results of bearing capacityof pile depend on type of hammer. Thus, DLTresultsobtainedbyusinghydro-hammerare moreapproximateto theSLT results, namelymorereliablethanresultsobtainedbyusingdiesel-hammer(Seidmarova,2008). The safety factor as defined by comparative analysis of many DLT and SLT data is presented in Figure 4.
Figure 4. Comparison results of DLT and SLT
Alternative Load Test Method
From aforementioned it follows that SLT and DLT both have disadvantages. SLT requiredalotoftime,worksand cost. Prescribed byStandard quantityofrequiredSLT
394
A.Zh. Zhussupbekov, Hoe Ling, R.E.Lukpanov, S.B.Yenkebayev, A.Tulebekova ,G.A. Sultanov, M.V.Boiko
is not enough to adequately realize soil condition of construction site (2 SLT for 200 piles only). DLT is much faster but is not so reliable and is applicable to driving piles only.
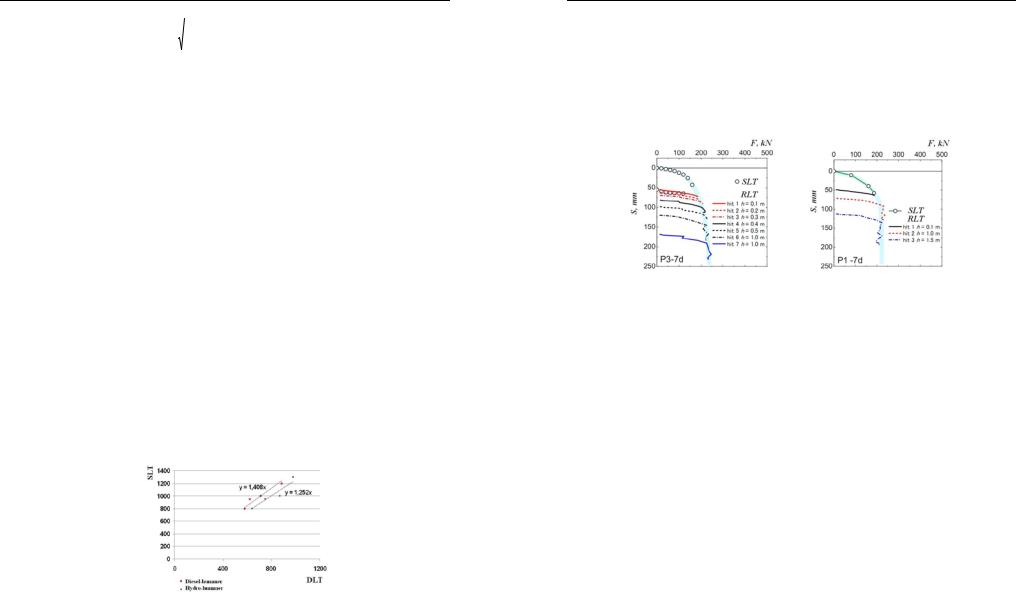
Today, in process of adaption into Kazakhstan practice is an alternative load test methodwhichprecludeddisadvantagesofbothSLTandDLT–RapidLoadTest(RLT). RLT allow performing up to 10 piles per day and much cost effective than SLT (Zhussupbekov and Matsumoto, 2011). The comparison of SLT and RLT as obtained by Matsumoto are presented in Figure 5 that shows reliability of RLT.
Figure 5. Results SLT and RLT
4. QUALITYCONTROLOFPILE FOUNDATION
Pile Integrity Test (PIT)
Pile integrity test is one of the non-destructive methods of pile quality control. This method allows analyzing integrity control for all existing types of piles (boring, injection, drivingand so on).PIT isbaseonwave propagation theoryinrigid bodyand is concerned with one of the modern quality control methods used world-wide. PIT allows detecting pile defects: approximate pile length, expansion and narrowing of pile cross section, modification of soil layers, heterogeneity of pile material, cracks in cross section of pile, extrinsic material in pile body.
AdvantagesofPITareasfollows:portabledeviceiseasytocarry.Oneoperatorwill be able to test over 100 piles per day, depends on site condition, pile head preparation and approach to the pile; minimum influence to the construction work on the site; significant defects may be detected in the beginning of the construction. PIT has some limitations: reflection of the bottom of pile sometimes has errors depending on soil condition; little deflection (less than 5 %) of pile cross section cannot be identified.
According to Kazakhstan Standard requirements it is necessary to test 60 % of boring piles and 50% of driving piles.
Geomonitoring
Geomonitoring for foundation settlement is one of the quality control methods that canbe carried out duringand after constructioninexploitationperiod. Monitoring is indirect control of pile installation evaluation.
395