

www.ti.com
Real-Time Debugging
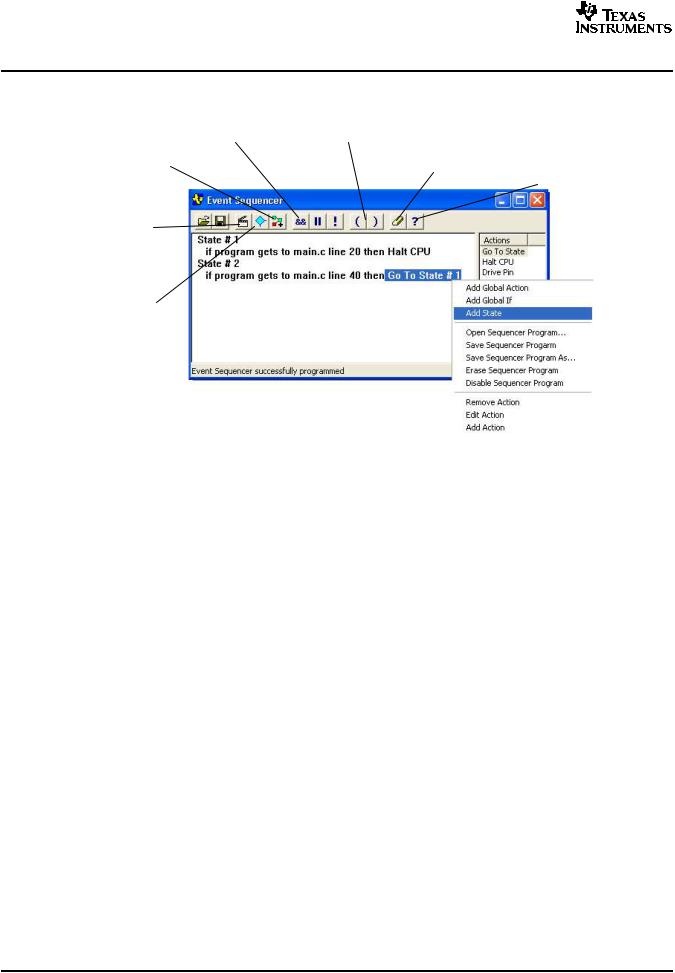
Figure 5-24. Event Sequencer
Add a boolean |
Add open and close |
|
“and” operator |
parenthesis |
|
Add a state |
Erase the Sequencer |
|
program |
||
|
||
|
Launch online help |
|
Add a Global |
|
|
Action |
|
|
Add a Global |
|
|
If statement |
|
2.Right-click in the Event Sequencer window or use the Event Sequencer toolbar buttons to create a sequencer program.
5.4Real-Time Debugging
Traditional debugging approaches (stop mode) require that programmers completely halt their system, which stops all threads and prevents interrupts from being handled. Stop mode can be exclusively used for debug as long as the system/application does not have any real-time constraints. However, for a better gauge of your application’s real-world system behavior, Code Composer Studio IDE offers several options, including Real-Time Mode ( Section 5.4.1), Rude Real-Time Mode ( Section 5.4.2), and RTDX (
Section 5.4.3).
5.4.1Real-Time Mode
Real-time mode allows time-critical interrupts in the foreground code to be taken while the target is halted in background code. A time-critical interrupt is an interrupt that must be serviced even when background code is halted. For example, a time-critical interrupt might service a motor controller or a high-speed timer. You can suspend program execution in multiple locations, which allows you to break within one time-critical interrupt while still servicing others.
To enable real-time mode debug:
1.You may need to configure interrupts and set breakpoints to get ready for real-time mode, see the online tutorial on Real-Time Emulation for more information. Select Debug→Real-time Mode. The status bar at the bottom of the control window now indicates POLITE REALTIME.
2.Configure the real-time refresh options by selecting View→Real-Time Refresh Options. The first option will specify how often the Watch Window is updated. Checking the Global Continuous Refresh check box will continuously refresh all windows that display target data, including memory, graph, and watch windows. To continuously update only a certain window, uncheck this box and select Continuous Refresh from the window’s context menu.
3.Click OK to close the dialog box.
4.Select View→Registers→Core Registers to open the Core Register window. The debug interrupt enable register (DIER) should be visible in the list. DIER designates a single interrupt, a specific subset of interrupts, or all interrupts that you selected via the interrupt enable registers (IER) as real-time (time-critical) interrupts. DIER mirrors the architecturally specified IER.
70 |
Debug |
SPRU509F –May 2005 |
www.ti.com
Real-Time Debugging
5.Right-click on a register and select Edit Register.
6.Enter the new register value to specify which interrupts to designate as real-time interrupts.
7.Click Done to close the Edit Registers dialog box.
8.Code Composer Studio IDE has been configured for Real-Time Mode debug.
5.4.2Rude Real-Time Mode
High priority interrupts, or other sections of code can be extremely time-critical, and the number of cycles taken to execute them must be kept at a minimum or to an exact number. This means debug actions (both execution control and register/memory accesses) may need to be prohibited in some code areas or targeted at a specific machine state. In default real-time mode, the processor runs in polite mode by absence of privileges, i.e., debug actions will respect the appropriate action delaying and not intrude in the debug sensitive windows.
However, debug commands (both execution control and register/memory access) can fail if they are not able to find a window that is not marked debug action-sensitive. In order to have the debugger gain control, you must change real-time debug from polite to rude mode. In rude real-time mode, the possession of privileges allows a debug action to override any protection that may prevent debug access and be executed successfully without delay. Also, you can not debug critical code regions until they are switched into rude realtime mode.
To enable rude real-time mode, perform one of the following:
∙Select Perform a Rude Retry from the display window when a debug command fails.
∙Select Enable Rude Real-time Mode from Debug menu when Real-Time is enabled.
When rude real-time is enabled, the status bar at the bottom of the main program window displays RUDE REALTIME. To disable rude real-time, deselect the Enable Rude Real-time Mode item in the Debug menu. The status bar now reads POLITE REALTIME.
If rude real-time is enabled and you halt the CPU, there is a good chance that the CPU will halt even when debug accesses are blocked, which might be within a time-critical ISR. This prevents the CPU from completing that ISR in the appropriate amount of time, as the CPU cannot proceed until you respond to the breakpoint. To prevent this problem, you must switch back to polite real-time mode by deselecting Enable Rude Real-time Mode.
See the online help section Debugging→Real Time Debugging for more detailed information on real-time mode.
5.4.3Real-Time Data Exchange (RTDX)
The DSP/BIOS Real-Time Analysis (RTA) facilities utilize the Real-Time Data Exchange (RTDX) link to obtain and monitor target data in real-time. You can utilize the RTDX link to create your own customized interfaces to the DSP target by using the RTDX API Library.
Real-time data exchange (RTDX) transfers data between a host computer and target devices without interfering with the target application. This bi-directional communication path provides for data collection by the host as well as host interaction with the running target application. The data collected from the target may be analyzed and visualized on the host. Application parameters may be adjusted using host tools, without stopping the application. RTDX also enables host systems to provide data stimulation to the target application and algorithms.
RTDX consists of both target and host components. A small RTDX software library runs on the target application. The target application makes function calls to this library’s API in order to pass data to or from it. This library uses a scan-based emulator to move data to or from the host platform via a JTAG interface. Data transfer to the host occurs in real-time while the target application is running.
On the host platform, an RTDX host library operates in conjunction with Code Composer Studio IDE. Data visualization and analysis tools communicate with RTDX through COM APIs to obtain the target data and/or to send data to the DSP application.
SPRU509F –May 2005 |
Debug |
71 |
www.ti.com
Real-Time Debugging
The host library supports two modes of receiving data from a target application: continuous and non-continuous. In continuous mode, the data is simply buffered by the RTDX Host Library and is not written to a log file. Continuous mode should be used when the developer wants to continuously obtain and display the data from a target application, and does not need to store the data in a log file. In non-continuous mode, data is written to a log file on the host. This mode should be used when developers want to capture a finite amount of data and record it in a log file.
For details on using RTDX, see the online help or tutorial.
5.4.3.1RTDX Data Flow
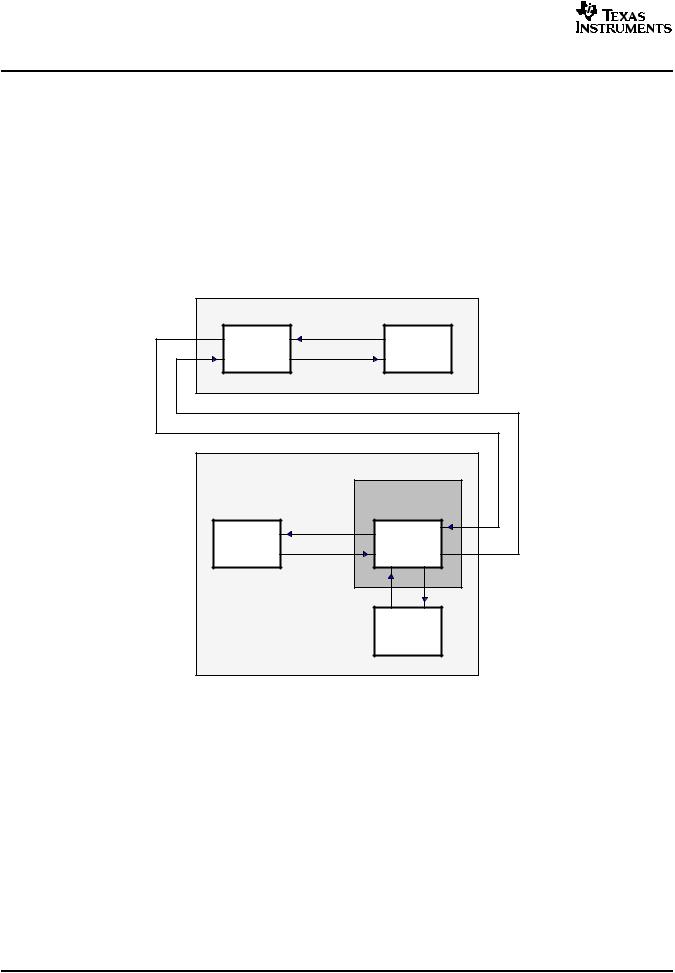
RTDX forms a two-way data pipe between a target application and a host client. This data pipe consists of a combination of hardware and software components as shown below.
Figure 5-25. RTDX Data Flow
Target |
User |
|
|
||
RTDX |
interface |
|
Target |
||
target |
||
application |
||
library |
||
|
JTAG interface
Host |
|
|
|
Code |
|
|
composer |
|
|
COM |
|
|
interface |
|
Host |
RTDX |
|
host |
||
client |
||
library |
||
|
||
|
Optional |
|
|
log file |
5.4.3.2Configuring RTDX Graphically
The RTDX tools allow you to configure RTDX graphically, set up RTDX channels, and run diagnostics on RTDX. These tools allow you to enhance RTDX functionality when transmitting data.
RTDX has three menu options: Diagnostics Control, Configuration Control, and Channel Viewer Control.
Diagnostics Control. RTDX provides the RTDX Diagnostics Control to verify that RTDX is working correctly on your system. The diagnostics test the basic functionality of target-to-host transmission and host-to-target transmission. To open the RTDX Diagnostics Control, select Tools→RTDX→Diagnostics Control. This tests are only available if RTDX is enabled.
72 |
Debug |
SPRU509F –May 2005 |
www.ti.com
Real-Time Debugging
Figure 5-26. RTDX Diagnostics Window
Configuration Control. This is the main RTDX window. It allows you to:
∙View the current RTDX configuration settings
∙Enable or disable RTDX
∙Access the RTDX Configuration Control Properties page to reconfigure RTDX and select port configuration settings
To open the RTDX Configuration Control, select Tools→RTDX→Configuration Control.
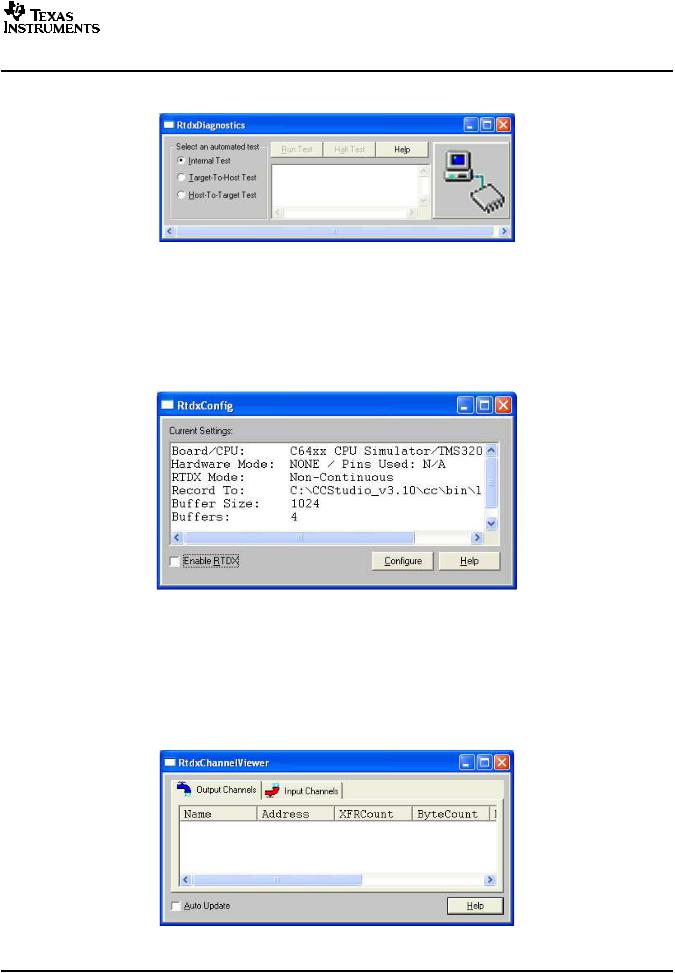
Figure 5-27. RTDX Configuration Window
Channel View Control. The RTDX Channel Viewer Control is an Active X control that automatically detects target-declared channels and adds them to the viewable list. The RTDX Channel Viewer Control also allows you to:
∙Remove or add a target-declared channel from the viewable list
∙Enable or disable a channel that is on the list
To open the RTDX Channel Viewer Control in Code Composer Studio IDE, select Tools→RTDX→Channel Viewer Control. The Channel Viewer Control window displays.
Figure 5-28. RTDX Channel Viewer Window
SPRU509F –May 2005 |
Debug |
73 |

www.ti.com
Real-Time Debugging
Click on the Input and Output Channels tabs to display a list of those channels. Both the Output and Input Channels windows allow you to view, delete, and re-add channels.
Checking the Auto-Update feature enables you to automatically update information for all channels without refreshing the display. If you are not using the Auto-Update feature, right-click on a tab and select Refresh from the context menu to update information for all channels.
Note:
For the RTDX Channel View Control to receive extended channel information for a specific channel, an RTDX client must have that channel open.
5.4.3.3Sending a Single Integer to the Host
The basic function of RTDX is to send a single integer to the host. The following steps provide an overview of the process of sending data from the target to the host and from the host to the target. For specific commands and details on transmitting different types of data, see the online RTDX help or tutorial.
To send data from your target application to the host:
1.Prepare your target application to capture real-time data by inserting specific RTDX syntax into your application code to allow real-time data transfer from the target to the host. Although the process for preparing a target application is the same for all data types, different data types require different function calls for data transfer. Therefore, sending an integer to the host requires you to add a function call that is specific to only transmitting a single integer, instead of sending an array of integers to the host.
2.Prepare your host client to process the data by instantiating one RTDX object for each desired channel, opening a channel for the objects specified, and calling any other desired functions.
3.Start Code Composer Studio IDE.
4.Load your target application onto the TI processor.
5.Check the Enable RTDX box under Tools→RTDX→Configuration Control.
6.Run your target application to capture real-time data and send it to the RTDX Host Library.
7.Run your host client to process the data.
For details on using RTDX, see the online RTDX help or tutorial.
5.4.3.4Receiving Data from the Host
A client application can send data to the target application by writing data to the target. Data sent from the client application to the target is first buffered in the RTDX Host Library. The data remains in the RTDX Host Library until a request for data arrives from the target. Once the RTDX Host Library has enough data to satisfy the request, it writes the data to the target without interfering with the target application.
The state of the buffer is returned into the variable buffer state. A positive value indicates the number of bytes the RTDX Host Library has buffered which the target has not yet requested. A negative value indicates the number of bytes that the target has requested which the RTDX Host Library has not yet satisfied.
To send data from a host client to your target application:
1.Prepare your target application to receive data by writing a simple RTDX target application that reads data from the host client.
2.Prepare your host client to send data by instantiating one RTDX object for each desired channel, opening a channel for the objects specified, and calling any other desired functions.
3.Start Code Composer Studio IDE.
4.Load your target application onto the TI processor.
5.Check the Enable RTDX box under Tools→RTDX→Configuration Control.
6.Run your target application.
7.Run your host client.
For details on using RTDX, see the online RTDX help or tutorial.
74 |
Debug |
SPRU509F –May 2005 |