

Principles of Enzyme Thermistor Systems
.pdf42 |
F. Lammers · Th. Scheper |
Fig. 3. Principle of a sandwich TELISA
ing of conjugates.But basic research on TELISA systems has been of tremendous importance for future immunosensors including fluorescence assays.
3.3
Determination of Enzyme Activities
In bioprocess monitoring, medicine and downstream processing, the analysis of enzyme activities is of tremendous importance. In mammalian cell cultures, lactate dehydrogenase activity informs us about the state of the cell; enzyme activities in blood, inform physicians about the patient’s health; and in downstream processing, several biochromatographic procedures are monitored via enzyme activity analysis. After a simple modification, the ET can be adapted for these applications. Here, sample aliquots are mixed directly in front of the thermistor with a buffer containing substrate .Again,the resulting heat provides information about the concentration (i.e. enzyme activity). The technique can be used for enzyme activities up to 0.01 units/ml (Danielsson and Larsson, 1990). Danielsson et al. (1981b) demonstrated this procedure by monitoring chromatographic purifications of enzymes. Here, enzyme activity is measured at the efflux of a chromatographic column. Experiments were carried out with ionic-, gel-, and affinity chromatography to separate lactate dehydrogenase, glucose-6-phosphate dehydrogenase and hexokinase (see Table 4).
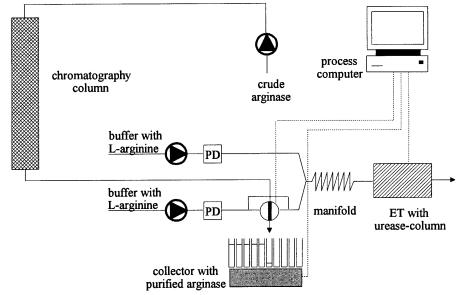
In another procedure, substrate or product concentration is analyzed after an enzymatic conversion has taken place. The method extends the possibilities of analysing enzyme activities. For instance, arginase cleaves buffer-containing arginine to urea and ornithine.Therefore, the ET determines arginases activity
Thermal Biosensors in Biotechnology |
|
|
43 |
||
Table 3. TELISA systems |
|
|
|
||
|
|
|
|
||
Analyte |
Immobilized |
Concentration range |
Reference |
||
|
compound |
[mg/ml] |
|
||
|
|
|
|
||
albumin |
immobilized antibody |
> 10–10 mmol/l |
Mattiasson et al. 1977 |
||
gentamicin |
and enzyme-labeled |
> 0.1 |
Danielsson et al. 1981a |
||
insulin |
antigen |
0.1–50 |
Birnbaum et al. 1986; |
||
|
|
|
|
|
Mecklenburg et al. 1993 |
human IgG |
protein A |
50 |
–500 |
Lammers 1996 |
|
(polyclonal) |
protein G |
50 |
–600 |
Lammers 1996 |
|
rabbit IgG |
protein A |
10 |
–150 |
Lammers 1996 |
|
(polyclonal) |
protein G |
20 |
–1000 |
Lammers 1996 |
|
|
anti-rabbit-IgG |
10 |
–200 |
Grau 1993 |
|
mouse IgG |
protein A |
100–2000 |
Brandes 1992 |
||
(monoclonal) |
anti-mouse-IgG |
5 |
–200 |
Lammers 1996 |
|
rt-PA |
anti-rt-PA-IgG |
5 |
–50 |
Lammers 1996 |
|
|
|
||||
Table 4. Enzyme activities determined with an ET |
|
||||
|
|
|
|
|
|
Enzyme |
|
Mixed with |
|
Concentration |
Reference |
|
|
|
|
range [units/ml] |
|
|
|
|
|
|
|
acetylcholine esterase |
no mixing; |
|
0.2–4 |
Lammers 1996 |
|
|
|
immobilized choline |
|
|
|
|
|
oxidase + catalase |
|
|
|
arginase |
|
no mixing; |
|
0.39–100 |
Lammers 1996 |
|
|
immobilized urease |
|
|
|
catalase |
|
H2O2 |
|
20–60 |
Sauerbrei 1988 |
b-galactosidase |
|
lactose |
|
0.5–4 |
Hundeck 1988 |
glucose oxidase |
|
no mixing; |
|
0.29–80 |
Lammers 1996 |
|
|
immobilized catalase |
|
|
|
glucose-6-phosphate |
glucose-6-phosphate |
|
0.2–3.0 |
Danielsson et al. 1981b |
|
hydrogenase |
|
+ NAD+ |
|
|
|
hexokinase |
|
glucose + ATP |
|
0.1–2.5 |
Danielsson et al. 1981b |
lactate dehydrogenase |
pyruvate + NADH |
|
0–20 |
Flygare et al. 1990 |
|
peroxidase |
|
H2O2 |
|
0.2–4 |
Hundeck 1988 |
urease |
|
urea |
|
0.1–100 |
Danielsson 1979 |
|
|
|
|
|
|
via urea release. Figure 4 shows schematically a set-up for arginase monitoring during its chromatographic FPLC purification. The computer-controlled system facilitates a fast fraction-wise allocation of arginase activities.
Flygare et al. (1990) demonstrated ET monitoring of an affinity-adsorption procedure. Lactate dehydrogenase (LDH) was recovered from a crude solution by affinity binding to a N6–(6-aminohexyl)-AMP-sepharose gel. The LDH activity signal from the ET was used in a PID controller to regulate the addition of
44 |
F. Lammers · Th. Scheper |
Fig. 4. Purification of arginase via FPLC and ET analysis
AMP-sepharose suspension to the LDH solution. Both examples, arginase and lactate dehydrogenase monitoring, might be attractive in industrial scale purification of enzymes.
Due to their limited stability, the use of immobilized enzymes might be problematic for monitoring enzyme production (e.g., urease for arginase monitoring). Optical methods which do not need immobilized biocompounds should be more profitable in long-term procedures. Nevertheless, special dyes or substrates with varying optical characteristics after an enzymatic conversion must have at one’s disposal.
On-line-monitoring of enzyme production during industrial fermentation processes are problematic because sampling probes are still not adequate for long-term use. In particular, clogging falsifies the real enzyme activity. Moreover, a lot of enzymes are produced intracellularly and complicate a simple monitoring procedure. Therefore, this kind of monitoring is still under development.
3.4
Process Monitoring
The ET has been employed in several biotechnological processes. This section focuses on selected experiments shown in Table 5.
Mattiasson et al. (1983) used the ET for monitoring and control of a cultivation of immobilized Saccharomyces cerevisiae. Here, sucrose and ethanol were monitored on-line, and the data were used for computer-controlled sucrose feed.
Thermal Biosensors in Biotechnology |
|
|
45 |
|
Table 5. ET applications for process control |
|
|
|
|
|
|
|
|
|
Analyte |
Immobilized |
Concentration |
Reference |
|
|
compound |
[mmol/l] |
|
|
|
|
|
|
|
acetaldehyde |
aldehyde dehydrogenase |
not mentioned |
Rank et al. 1995 |
|
cellobiose |
b-glucosidase + glucose |
0.05–5 |
Danielsson et al. 1981a |
|
|
oxidase + catalase |
|
|
|
cephalosporin |
cephalosporinase |
0.005–10 |
Danielsson et al. 1981a |
|
ethanol |
alcohol oxidase + catalase |
0.002–1 |
Rank et al. 1995 |
|
galactose |
galactose oxidase |
0.01 |
–1 |
Mattiasson et al. 1982 |
L-glutamine |
glutaminase + glutamate |
0.5–50 |
Lammers 1996 |
|
|
decarboxylase |
|
|
|
glycerol |
glycerokinase |
not mentioned |
Rank et al. 1995 |
|
L -lactate |
lactate oxidase + catalase |
0.05 |
–2 |
Danielsson et al. 1994 |
lactose |
lactase + glucose |
0.05 |
–10 |
Mattiasson et al. 1982 |
|
oxidase + catalase |
|
|
|
maltose |
a-glucosidase + |
0.15 |
–6 |
Hundeck et al. 1992 |
|
glucose oxidase |
|
|
|
monoclonal |
anti-mouse-IgG |
5–200 mg/ml |
Lammers 1996 |
|
antibodies |
|
|
|
|
penicillin G |
b-lactamase |
0.05 |
–500 |
Mattiasson et al. 1981 |
penicillin V |
penicillin acylase |
0.5–150 |
Rank et al. 1993 |
|
proinsulin |
anti-proinsulin-IgG |
0.1–50 mg/ml |
Birnbaum et al. 1986 |
|
sucrose |
invertase |
0.1–100 |
Hundeck et al. 1992 |
|
|
|
|
|
|
Hundeck et al. (1992) employed a four channel ET for on-line-monitoring of glucose, maltose and sucrose during cultivation of Bacillus licheniformis. In this process, microorganisms produce subtilisin, a serine protease added to washing powders to improve washing efficiency. In fed-batch cultivations of Bacillus licheniformis, sucrose feed is a very important parameter because sucrose concentration correlates with subtilisin production. Optimal enzyme production is achieved only within a defined sucrose range. Therefore, ET sucrose data were used for maintaining a defined concentration range.
Figure 5 shows on-line-data of sucrose concentrations and the enzyme production rate obtained during a fed-batch cultivation. Obviously, sucrose concentration and enzyme activity correlate. Due to growth of the microorganisms, sucrose concentration decreases in the first five hours. After a lag, subtilisin is produced at an optimum rate. The enzyme activity decreases after that because the sucrose concentration is too low of a limited. Thus, sucrose is fed to the medium and subtilisin production increases again.
In addition, the response time of immobilized yeast to different sugars was used for monitoring and control of Bacillus licheniformis cultures (Hundeck et al. 1992). Specificity is not a characteristic of cell-based sensors; rather, they are characterized by their ability to react in an integrated way to various stimuli.

46 |
F. Lammers · Th. Scheper |
Fig. 5. Fed-batch cultivation of Bacillus licheniformis
Fig. 6. Bacillus licheniformis cultivation. The ET with immobilized Saccharomyces cerevisiae was used for monitoring metabolizable sugars
Thermal Biosensors in Biotechnology |
47 |
This property allows us to monitor some parameters such as metabolizable sugars. Obviously, the parameter closely correlates with the oxygen transfer rate (OTR; Fig. 6). Sugars are metabolized with consumption of oxygen. Thus, the OTR increases with decreasing sugar concentrations.
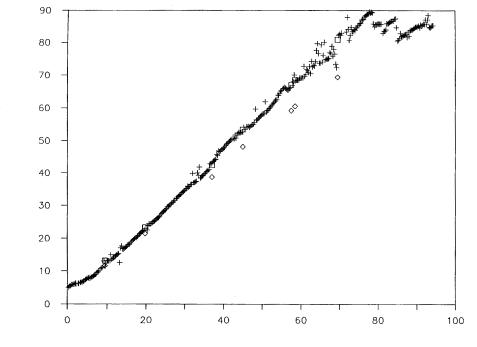
Rank et al. (1992) used an ET in several industrial fermentation processes at Novo Nordisk, Denmark. The production of penicillin V in a 160-m3 bioreactor was monitored on-line using an enzyme column with penicillin V acylase. In comparison to b-lactamase, the enzyme has a superior substrate specificity. Offline samples were analyzed via liquid chromatography and correlated very well with on-line ET data (Fig. 7).
Several 500 l fed batch cultivations with Saccharomyces cerevisiae were monitored in the pilot-plant at Novo Nordisk as well (Rank et al. 1995). Here, ethanol was monitored using coimmobilized alcohol oxidase and catalase, acetaldehyde by aldehyde dehydrogenase and glycerol by glycerokinase. Acetaldehyde and glycerol analysis had to be performed with the cosubstrates b-NAD and ATP, respectively. Therefore, the monitoring was comparatively expensive. Nevertheless, ET data gave an interesting insight into yeast behavior during an industrial cultivation process.
Industrial plants are characterized by high humidity, ambient temperatures up to 40 °C, large temperature variations, water and steam outlets, and continuous vibration. The complex composition of fermentation broth and high and variable concentrations of certain components are additional problems.
penicillin conc. in % of max yield
rel. time
Fig. 7. On-line monitoring of a penicillin V fermentation (Rank)
48 |
F. Lammers · Th. Scheper |
Therefore, Rank et al. (1995) constructed an automated ET for process monitoring. The equipment was installed inside a steel cabinet with cool, filtered air to keep the temperature sufficiently constant. The enzyme column had to be protected against microbial growth by adding sodium azide to the buffer solution. These facts show an obvious strong difference between biosensor employment in research laboratories and industrial plants.
TELISA systems for on-line-monitoring of proteins have not been applied so far. Nevertheless, several TELISAs have been applied for off-line analysis of cultivation samples.Birnbaum et al.(1986) used a competitive TELISA for human proinsulin analysis produced from recombinant Escherichia coli. Lammers (1996) describes a sandwich TELISA for monitoring monoclonal mouse antibodies. Here, real samples of a hybridoma cell cultivation (Dr. Karl Thomae, Germany) were analyzed and correlated well with conventional ELISA data. A whole measuring cycle including incubation,detection and reequilibration needs 18 minutes. Due to the long cultivation time (two weeks and more) for mammalian cells, it would be sufficient for on-line monitoring. But TELISAs have other decisive disadvantages.Enzyme-labeled antibodies or antigens are expensive and need a complicated monitoring performance. Thus, procedures working without conjugates like fluorescence immunoanalysis might be more attractive.
In conclusion, ET employment is possible for on-line monitoring of industrial fermentation processes under real conditions. Nevertheless, each process has its own characteristics and needs a special monitoring concept. In special cases, sensors other than the ET might be better for monitoring and control.
3.5
Environmental Analysis
Microorganisms are universal sensors for pollutant analysis. Toxins influence the microorganisms’ metabolism and are recognized via monitoring the state of the cells. In comparison to specific biosensors, the unspecific response of the microorganisms to different substances is a crucial advantage for toxicological studies. Nevertheless, simple operation with immobilized microorganisms is of tremendous importance for employing these kinds of toxiticy tests. Microbial sensors might be attractive for domestic and industrial waste-water monitoring.
Sudden changes in metabolism bring about a fast response in temperature. Thus, the ET has good prerequisites for use as a toxin guard system. Hundeck (1991) investigated the response behavior of immobilized Saccharomyces cerevisiae to different inhibitors (azide, Hg2+, cyanide, arsenate, 2,4-dinitrophenol). Here, inhibitors were mixed with glucose, and after substrate injection, the combined substrate-inhibitor-solution was used. Increasing inhibitor concentration caused decreasing temperature signals. The inhibitors azide, cyanide and arsenate allowed multiple determinations to be made whereas Hg2+ irreversibly damage the cells. The substance 2,4-dinitrophenol (2,4-DNP) increases the temperature signals by decoupling the respiration chain (i.e.oxidation of NADH and decoupling of ATP production).
Some different examples showing relevance to environmental monitoring are listed in Table 6. In addition to microbial systems,immobilized enzymes that are
Thermal Biosensors in Biotechnology |
|
49 |
|
Table 6. ET as toxing guard system |
|
|
|
|
|
|
|
Analyte |
Immobilized |
Concentration |
Reference |
|
compound |
[mmol/l] |
|
|
|
|
|
amines |
monoamine oxidase |
0.001–0.7 |
Svensson et al. 1979 |
azide |
Saccharomyces cerevisiae |
10–100 mg/l |
Hundeck 1991 |
Cu2+ |
urease |
0.1 |
Mattiasson et al. 1977b |
cyanide |
rhodanase + injectase |
0.02–1 |
Mattiasson et al. 1977a |
|
Saccharomyces cerevisiae |
10–100 mg/l |
Hundeck 1991 |
|
peroxidase |
20–100 ppm |
Fischer 1989 |
2,4-DNP |
Saccharomyces cerevisiae |
1–20 mg/l |
Hundeck 1991 |
Hg2+ |
urease |
0.01 |
Mattiasson et al. 1977b |
|
Saccharomyces cerevisiae |
10–100 mg/l |
Hundeck 1991 |
insecticides |
acetyl choline esterase |
< 0.0034 |
Mattiasson et al. 1979 |
organophosphate |
hydrolytic enzymes |
> 0.03 |
Mattiasson et al. 1979 |
sulfide |
peroxidase |
10–1000 ppm |
Fischer 1989 |
Zn2+ |
alkaline phospatase |
0.01–1 |
Satoh 1991a |
inhibited by special analytes are shown. Due to reversibility problems,inhibition of enzymes is a difficult procedure (Schmidt et al. 1995). Thus, microorganisms would be a better choice.
3.6
Enzymatic Amplification
Efficient working of ET depends on enzymatic reactions accompanied by high reaction enthalpies.A reaction with low enthalpy is often amplified by a sequential or cycling system. In a sequential system,a product of the first or subsequent reaction is converted by a coimmobilized enzyme with a high enthalpy effect. For instance, several oxidases produce hydrogen peroxide. Due to low reaction enthalpies of oxidases, coimmobilized catalase effects an amplification in a sequential step (DH = –100.7 kJ/mol). Another example is arginase analysis. Here, an enzyme column with coimmobilized arginase and urease is employed. Arginase cleaves arginine to ornithine and urea whereas urease converts the latter with a high enthalpy effect to ammonia and carbon dioxide. A column without urease gives much lower thermometric signals.
The enzymatic cycling systems are characterized by a combination of enzymes (mostly oxidases and dehydrogenases) that are capable of a multiple regeneration of a substrate. Here, a repeated regeneration of the substrate causes an accumulation of heat and amplifies the signals. Enzymatic cycling systems have an important requisite,namely the analyte concentration has to be well below its Michaelis-Menten-value KM . Otherwise, the reaction speed is not proportional to the analyte concentration (Bergmeyer, 1983).
The combination of cycling systems gives very high amplification factors. The latter describes the ratio of amplified and non-amplified signal in the linear
50 |
F. Lammers · Th. Scheper |
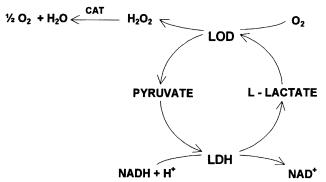
Fig. 8. Amplification system of lactate oxidase (LOD), lactate dehydrogenase (LDH) and catalase (CAT)
range. Kirstein et al. (1989) describe an ET analyzing ATP with a detection limit of 10 nmol/l. The enzymatic cycling system causes an amplifiction factor about 1700. Another amplification system uses a combination of lactate oxidase, lactate dehydrogenase and catalase (LOD/LDH/CAT-system; Fig. 8). Due to evolution of hydrogen peroxide from the cycling reaction, a coimmobilisation of catalase effects an additional amplification.
The cycle represents an oxidation of NADH with oxygen accompanied by a very high enthalpy (DH = –255 kJ/mol). The value agrees with the sum of enthalpies taking part in the cycle (Scheller et al.1985).Mecklenburg et al.(1993) used the LOD/LDH/CAT-system for an insulin-TELISA. Here, an amplification factor of about 10 was observed. Nevertheless, the cycling system is expensive, complicated and difficult to reproduce (Lammers, 1996). Especially for TELISA procedures, an optimized substrate for peroxidase labeled antibodies was developed. The substrate (2 mmol/l H2O2 and 2 mmol/l aminoantipyrine) causes a similar TELISA sensivity to that of the LOD/LDH/CAT cycle but is much easier to use, cheaper and very reproducible (Lammers, 1996).
4
New Fields for Enzyme Thermistors
4.1
Enantiomeric Analysis
In the pharmaceutical industry, the production of enantiomerically pure substances is of tremendous importance because the same compounds but of opposite chirality often have extremly different therapeutic effects. Thus, enantiomeric analysis is of special importance. Nowadays, enantioselective syntheses are monitored via time-consuming, expensive and complicated procedures (e.g., chiral GC and HPLC). Biosensors might be an interesting alternative or a supplement to existing techniques. Here,immobilized enzymes with different enan-

Thermal Biosensors in Biotechnology |
51 |
tiospecifities can be used to analyze the ratio of enantiomers. Figure 9 shows the principle of two different enantioselective biosensors. In the first method, one sensor specifically detects a D-enantiomer whereas the second one analyzes the concentration of a L-enantiomer. Method 2 shows a combination of an unspecific and a specific working sensor. Here,a comparison of both sensor signals allows a fast determination of the ratio of enantiomers.
Hundeck et al. (1993) showed the ET analyzing racemates of DL-phenylalanine- methyl ester. Here, unspecific pig liver esterase cleaves both antipodes whereas a-chymotrypsin converts only the L-enantiomer (Fig. 10). Both reactions release protons that are easily detected by tris/HCl-buffer (enthalpy of protonation: DH = –47 kJ/mol).
Lammers (1996) extended the esterase/a-chymotrypsin system with DL-tryp- tophan-, DL-tyrosine-, DL-methionine- and DL-phenylglycinemethyl ester. All substances give very good signals with immobilized esterase and tris/HClbuffer. Immobilized a-chymotrypsin converts L-tryptophan- and L-tyrosine- methylester with very good signals whereas L-methionine- and L-phenylglycine- methylester effect only a few or give no heat. In contrast, the L-phenylglycine- methylester seems to be too small for a-chymotrypsin, and L-methionine- methylester is too hydrophilic due to its side chain (Lammers, 1996).
4.2
Aminoacid Analysis
Aminoacid monitoring is of tremendous importance in biotechnology. In this section, three different ET for L-arginine, L-asparagine and L-glutamine are presented. The aminoacid L-arginine is required for an optimal growth and preservation of nitrogen equilibrium. Moreover, L-arginine is important in hormone producing processes (Alonso et al. 1995). Thus, media for mammalian cell cultivation such as Coon’s F12 containing the aminoacids in relatively high con-
Fig. 9. Principles of enantiomeric analysis