

Beginning Visual Basic 2005 (2006)
.pdfChapter 9
To add this button, you right-click any empty area of the toolbar and choose Customize from the context menu. In the Customize dialog, click the Commands tab, and then select Debug in the Categories list. In the Commands list, select Run To Cursor. After you select Run To Cursor, you drag its icon from the Commands list onto the debug toolbar, to form a group of icons as shown in Figure 9-13, and then click the Close button to close the Customize dialog box.
Figure 9-13
You are now ready to continue working through the Try It Out.
Try It Out |
Working with Breakpoints (cont.) |
1.You ended the last step of the Try It Out at the breakpoint. Before continuing, you want to examine the contents of the string variable, strData. Hover your mouse over the variable to view a Data Tip, as shown in Figure 9-14. Notice that the variable name is listed along with its contents, a magnifying glass, and a down arrow.
Clicking the contents of the variable in the Data Tip puts you in edit mode for the variable, and you can actually change the contents of that variable. Clicking the magnifying glass will cause the contents of the variable to be displayed automatically in the Text Visualizer dialog box, which is a useful tool for displaying the data for string variables that contain a significant amount of data. Clicking the down arrow provides you a drop-down list of options for viewing the contents of the variable and will contain an option for Text Visualizer, XML Visualizer, and HTML Visualizer.
Figure 9-14
2.Now you’ll want to test the debugging icons on the toolbar, starting with the Run To Cursor icon first. Place your cursor on the line of code that calls the ListCustomer procedure as shown in Figure 9-15.
Now click the Run To Cursor icon on the toolbar. The code between the breakpoint at the End If statement shown in Figure 9-14 and the line of code that calls the ListCustomer procedure, shown in Figure 9-15, will be executed. Your project will stop execution on the line of code on which you have your cursor.
Figure 9-15
296
Debugging and Error Handling
3.Click the Step Into icon next, and you should now be at the beginning of the ListCustomer procedure. Data Tips can be displayed for objects that contain multiple values as well as variables that contain only a single value.
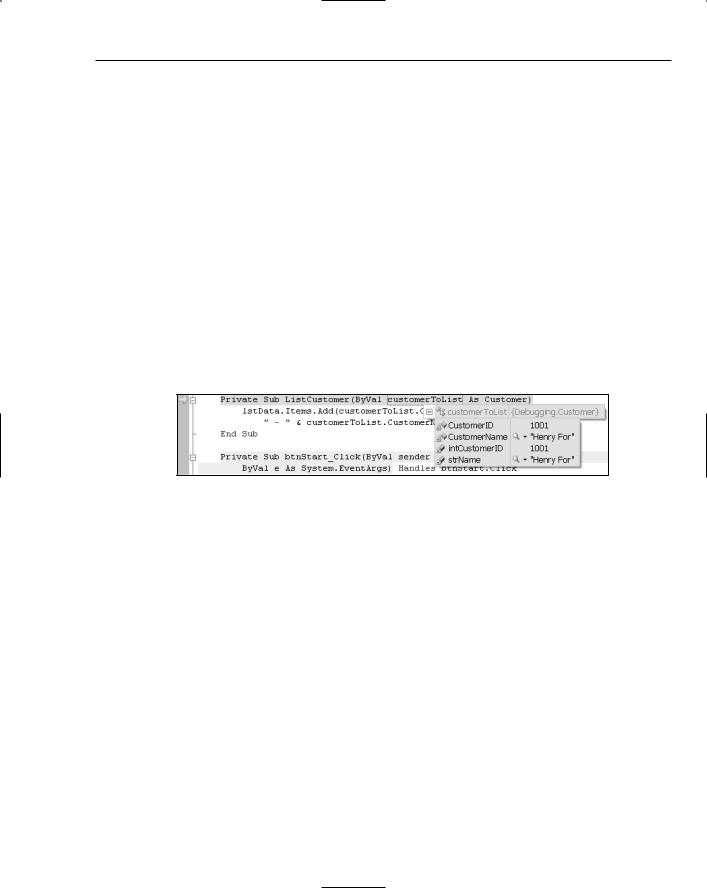
Hover your mouse over the customerToList parameter for this procedure to display the Data Tip for this object. You’ll see a plus sign next to the object name in the Data Tip. Click the plus sign, or simply hover your mouse over it, and the contents of the object will be displayed as shown in Figure 9-16.
Notice that this Data Tip not only displays the properties in the Customer class, the class that the customerToList object is derived from, but also the private variables in that class. You also have the same options for viewing the contents of string variables, which is indicated by the presence of the magnifying glass and down arrow icons.
Since the text, which is supposed to read “Henry Ford”, is misspelled, you’ll want to correct it in the Data Tip. This can be done by editing either the property CustomerName or the strName variable in the Data Tip. Click on the text “Henry For” in the Data Tip to be put into edit mode. Correct the text by adding the letter d at the end of the text and then click the name or variable name in the Data Tip. Notice that the text for both the property and variable has been updated with your corrections.
It should be noted that you can change the contents of Integer data types in the Data Tip as well.
Figure 9-16
4.Click the Step Into icon once more and you should be at the first line of code in the
ListCustomer procedure.
5.Since you do not want to see any of this code at this time, you are going to step out of this procedure. This places you back at the line of code that called this procedure. Click the Step Out icon. Notice that you are taken out of the ListCustomer procedure and back to where the call originated.
6.Now click the Step Into icon twice more so that you are back at the call to the ListCustomer procedure once again.
7.The final icon to be tested is the Step Over icon. Click this icon now and notice that you have totally stepped over the execution of the ListCustomer procedure. The procedure was actually executed. However, since you chose to step over it, the debugger does not show you that the procedure was executed.
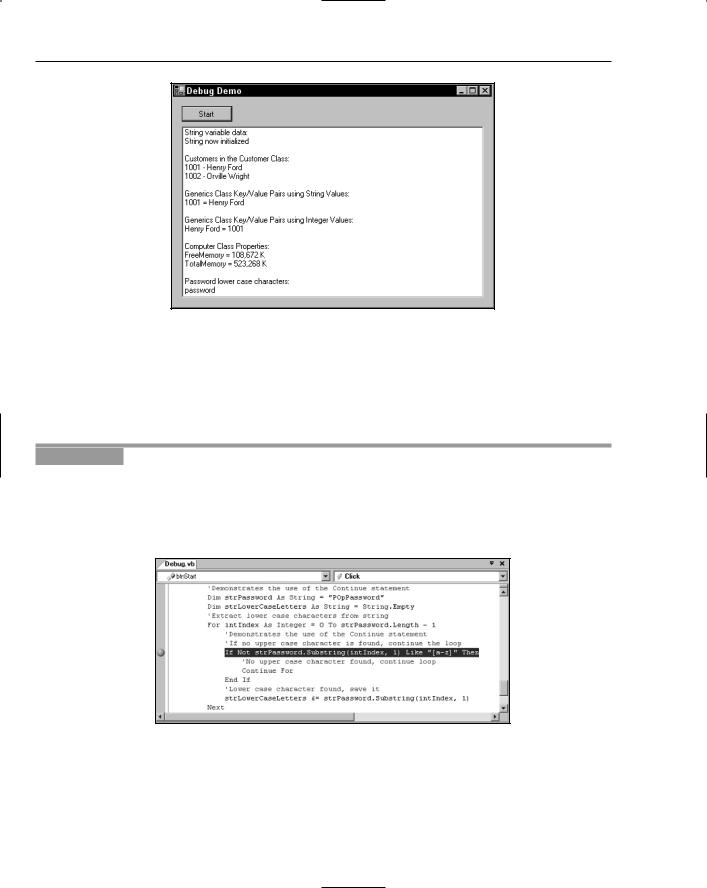
8.Now you want to continue processing as normal and have the rest of the code execute without interruption. If you hover your mouse over the Start icon on the toolbar, you will notice that the ToolTip has been changed from Start to Continue. Click this icon to let the rest of the code run. You should now see your completed form as shown in Figure 9-17.
297
Chapter 9
Figure 9-17
In the next Try It Out, you will be examining the Breakpoint Hit Count dialog box. The Breakpoint Hit Count dialog box allows you to define the number of executions of a loop should be performed before the IDE stops execution of your code and puts it into break mode. As we have already described, this is useful for processing loops, because you can specify how many iterations the loop should make before you encounter a breakpoint.
Try It Out |
Using the Breakpoint’s Hit Count |
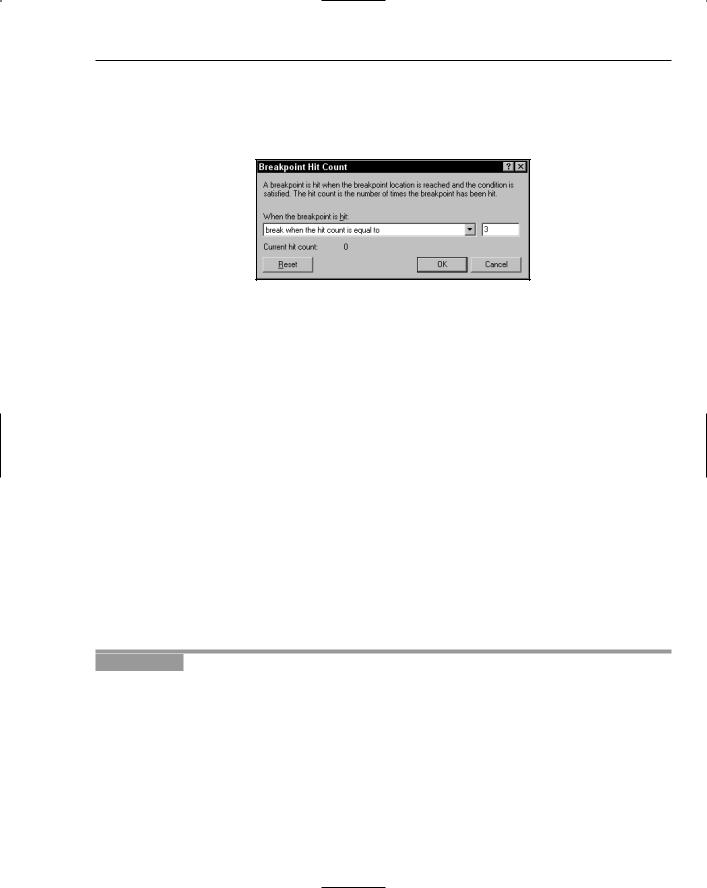
1.Stop your project and set a breakpoint in the For loop as shown in Figure 9-18. Remember that to set a breakpoint, you need to click in the gray margin on the line of code where the breakpoint should be.
Now start your project again by clicking the Start icon on the toolbar.
Figure 9-18
2.In the Breakpoints window, right-click the second breakpoint and choose Hit Count from the context menu to invoke the Breakpoint Hit Count dialog box.
298
Debugging and Error Handling
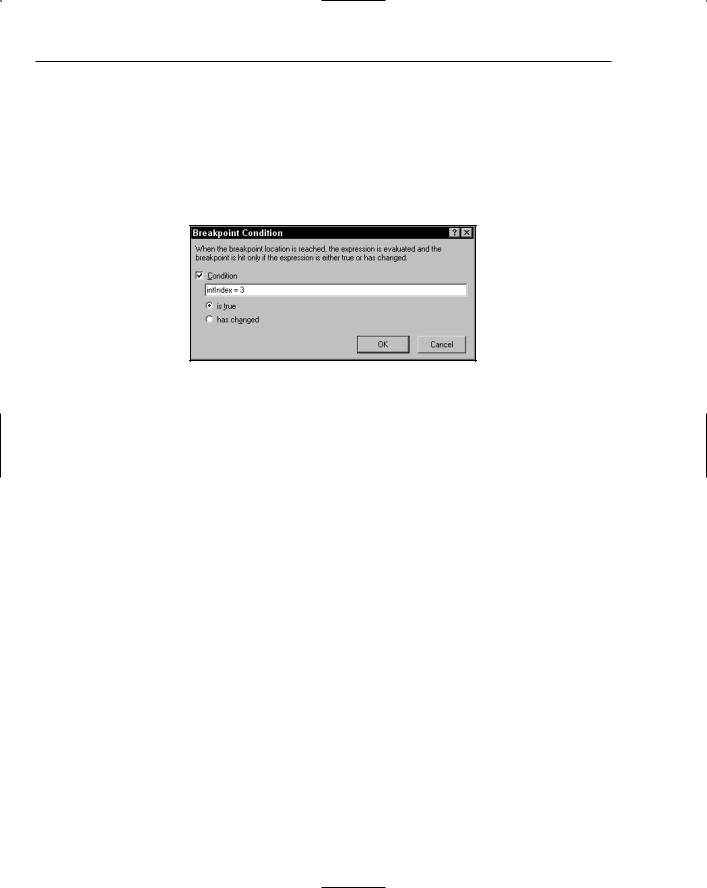
3.The breakpoint that you currently have set will halt execution every time it is encountered. Change it to break only when the loop enters its third execution. You do this by selecting “break when the hit count is equal to” in the drop-down list and then entering the number 3 in the text box displayed next to it, as shown in Figure 9-19.
Figure 9-19
Click the OK button to close this dialog box. Notice the Hit Count column in the Breakpoints window in the IDE. The second breakpoint now displays the Hit Count condition that you just defined.
4.At this point, click the Start button on the form. By clicking the Start button you are again stopped at your first breakpoint.
5.This breakpoint is highlighted in the Breakpoints window. You no longer need this breakpoint, so click it and then click the Delete icon in the Breakpoints window; the breakpoint will be deleted. Your code is still paused at this point, so click the Continue button on the Debug toolbar.
6.You are now stopped at your breakpoint in the For loop as it enters its third execution. Notice that the Breakpoints window shows the hit count criteria that you selected and also the current hit count.
As you can see, this is a handy way to have a loop execute a definite number of iterations before breaking at a defined breakpoint.
7.Now let your code continue executing by clicking the Continue button on the Debug toolbar.
8.Stop your project once the form has been displayed.
In this next Try It Out, you’ll modify the properties of the only breakpoint that you have left.
Try It Out |
Changing Breakpoint Properties |
1.In the last Try It Out, you modified the breakpoint while the project was running. This time you’ll modify the breakpoint while the project is stopped. To view the Breakpoints window, click the Debug menu, choose Windows, and then choose the Breakpoints sub menu item.
2.In the Breakpoints window right-click the breakpoint, and choose Hit Count from the context menu to display the Breakpoint Hit Count dialog box. Notice the Reset button. When you click this button, you reset the hit counter for the next execution, but this is not what you’ll do at this point.
299
Chapter 9
3.Here you’ll change the hit count back to its original setting. Select “break always” in the dropdown box and then click the OK button to close this dialog box.
4.To set a specific condition for this breakpoint, right-click the breakpoint and choose Condition from the context menu to invoke Breakpoint Condition dialog box. Enter the condition as shown in Figure 9-20. This will cause this breakpoint to break only when the variable intIndex is equal to 3. Notice that you could also specify that the breakpoint would be activated when the value of a variable changes. Click the OK button to close the dialog box and then start your project.
Figure 9-20
5.Now click the Start button on your form. Once the intIndex variable is equal to 3, the breakpoint will be activated, and the execution of the code will be paused at the line where the breakpoint is specified. Notice that this is actually your fourth time into the loop, as the For . . . Next loop specifies a starting index of 0 for the variable intIndex.
6.Finally, go ahead and let your code finish executing by clicking the Continue button on the Debug toolbar. Once your form is displayed, go ahead and stop your project.
Debugging Using the Watch Window
The Watch window provides a method for you to watch variables and expressions easily while the code is executing — this can be invaluable when you are trying to debug unwanted results in a variable. You can even change the values of variables in the Watch window. You can also add as many variables and expressions as needed to debug your program. This provides a mechanism that allows you to watch the values of your variables change without any intervention on your part.
You can add and delete a variable or expression to the QuickWatch dialog box only when your program is in break mode. Therefore, before you run your program, you need to set a breakpoint before the variable or expression that you want to watch. Once the breakpoint has been reached, you can add as many Watch variables or expressions as needed.
In the following Try It Out, you add the intIndex variable to the Watch window and also add an expression using the intIndex variable. This enables you to observe this variable and expression as you step through your code.
300
Debugging and Error Handling
Try It Out |
Using QuickWatch |
1.Start your program again. When your form displays, switch to the IDE and clear the current breakpoint by deleting it in the Breakpoints window or by clicking it in the gray margin where it is set. Then set a new breakpoint as shown in Figure 9-21.
Figure 9-21
2.You can only add a QuickWatch variable or expression while your program is paused. Click the Start button on the form so the breakpoint will be encountered and your program paused.
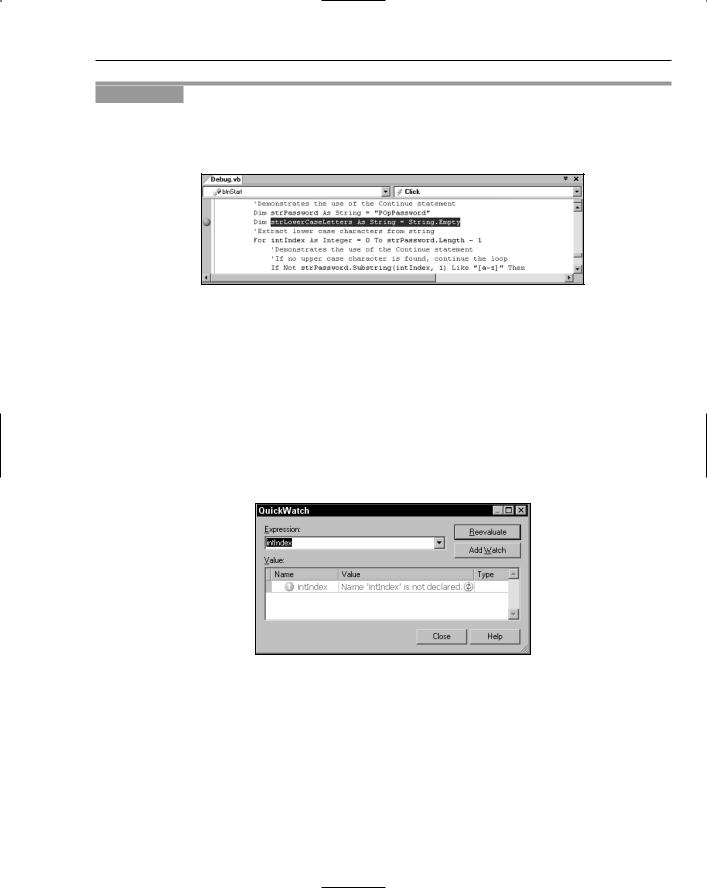
3.Once the breakpoint has been encountered, right-click the variable, intIndex, in the For . . .
Next loop and choose QuickWatch from the context menu to invoke the QuickWatch dialog box. Notice that this variable has not only been added to the Expression drop-down box but has also been placed in the Current value grid in the dialog, as shown in Figure 9-22. Click the Add Watch button to add this variable to the Watch window.
Since the variable is declared in the For . . . Next loop, you see an error here. You can safely ignore this error, because once the loop has started processing, the variable will be declared.
Figure 9-22
4.While you have the QuickWatch dialog box open, set an expression to be evaluated. Add the expression intIndex = 1 in the Expression drop-down box. Then click the Add Watch button to have this expression added to the Watch window. Now close the QuickWatch dialog box by clicking the Close button.
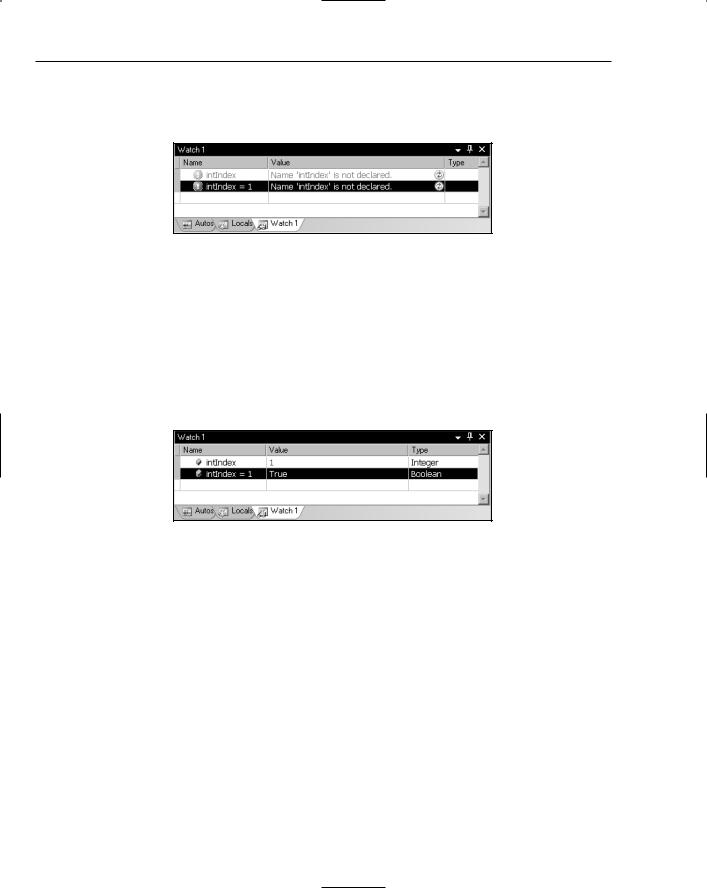
5.If you do not see the Watch window at the bottom of the IDE, select Debug Windows Watch Watch 1. You should now see a variable and an expression in the Watch window as shown in Figure 9-23.
301
Chapter 9
The second watch expression that you added here will return a value of True when the intIndex variable equals 1, so Visual Studio 2005 will set the type to Boolean once you enter the For . . . Next loop.
Figure 9-23
6.Step through your code line by line so that you can watch the value of the variable and expression change. Click the Step Into icon on the Debug toolbar to step to the next line of code. Keep clicking the Step Into icon to see the values of the variable and expression in the Watch window change.
As you step through the loop in your code, you will continue to see the value for the intIndex variable change in the Watch window. When the value of the variable in the Watch window turns color, as shown in Figure 9-24, the value has just been changed. You can manually change the value anytime by entering a new value in the Value column in the Watch window.
Figure 9-24
7.When you are done, click the Continue icon on the Debug toolbar to let your code finish executing. Then stop your project once the form has been displayed.
Debugging with the Locals Window
The Locals window is similar to the Watch window, except that it shows all variables and objects for the current function or procedure. The Locals window also lets you change the value of a variable or object, and the same rules that apply to the Watch window apply here (that is, the program must be paused before a value can be changed). The text for a value that has just changed also turns red, making it easy to spot the variable or object that has just changed.
The Locals window is great if you want a quick glance at everything that is going on in a function or procedure, but it is not very useful for watching the values of one or two variables or expressions. The reason for this is that the Locals window contains all variables and objects in a procedure or function. Therefore, if you have a lot of variables and objects, you will have to scroll through the window constantly to view the various variables and objects. This is where the Watch window comes in handy; it lets
302

Debugging and Error Handling
you watch just the variables that you need. In this Try It Out, you examine the contents of the Locals window in two different procedures. This will demonstrate how the contents of the Locals window change from one procedure to the next.
Try It Out |
Using the Locals Window |
1.To prepare for this exercise, you need to have the current breakpoint set and set a new breakpoint in the ListCustomer procedure. Locate the ListCustomer procedure and set a breakpoint on the one line of code in that procedure:
lstData.Items.Add(customerToList.CustomerID & _
“- “ & customerToList.CustomerName)
2.Now start your program.
3.If you do not see the Locals window at the bottom of the IDE, select Debug Windows Locals. Notice that at this point the Locals window contains no variables or objects. This is because you have not entered a procedure or function. Click the Start button on the form, and your breakpoint in the ListCustomer procedure will be encountered first and execution will be paused.
4.Notice the various objects and their types listed in the Locals window. The first item in the list is Me, which is the form itself. If you expand this item, you will see all the objects and controls associated with your form. If you expand the customerToList object, you’ll see the properties and variables defined in the Customer class from which this object is derived as shown in Figure 9-25.
Figure 9-25
5.Now click the Continue icon on the Debug toolbar until you encounter your second breakpoint.
6.Now take a look at the Locals window, and you will see a different set of objects and variables. The one constant item in both procedures is Me, which is associated with the form.
7.If you step through a couple of lines of code in the loop where the breakpoint has paused your program, you will see the values in the Locals window change, and when a value changes it turns red. This is the same behavior that you saw in the Watch window. You can continue to step through your code, or you can click the Continue icon on the Debug toolbar to let your program run to completion.
After you change your build configuration from Debug to Release, debugging is no longer available; even if you have breakpoints set in your code, they will not be encountered.
303

Chapter 9
8.To clear all breakpoints in your code, you can delete each breakpoint in the Breakpoints window, or you can click the Debug menu and choose Delete All Breakpoints. Once you are done, stop your project.
Error Handling
Error handling is an essential part of any good code. In Visual Basic 2005 the error mechanism is based on the concept of exceptions that can be thrown to raise an error and caught when the error is handled. If you do not provide any type of error handling and an error occurs, your user will receive a message about an unhandled exception, which is provided by the CLR, and then the program may terminate, depending on the type of error encountered. This is not a user-friendly message and does not inform the user about the true nature of the error or how to resolve it. The unhandled error could also cause users to lose the data that they were working with or leave the user and the data in an unknown state.
Visual Studio 2005 provides structured error-handling statements that are common across all languages. Structured error handling is a way to organize blocks of code in a structure that will handle errors. In this section you examine structured error handling and how it can be incorporated into your programs with very little effort.
Structured error handling in Visual Studio 2005 is incorporated with the Try . . . Catch . . . Finally block. You execute the code that might throw an exception in the Try block, and you handle anticipated errors in the Catch block. The Finally block, which is optional, is always executed, if present, and allows you to place any cleanup code there regardless of whether an error has occurred. If an error occurs that was not handled in the Catch block, the CLR will display its standard error message and terminate your program. Therefore, it is important to try to anticipate all possible errors for the code that is contained in the Try block.
Take a look at the syntax for the Try . . . Catch . . . Finally statement:
Try
[try statements]
Catch exceptionvariable As exceptiontype
[catch statements] [Additional Catch blocks] Finally
[finallystatements] End Try
The try statements are the statements to be executed that may cause an error.
The exceptionvariable can be any variable name. It will be set to contain the value of the error that is thrown.
The exceptiontype specifies the exception class type type that the exception belongs to. If this type is not supplied, your Catch block will handle any exception defined in the System.Exception class. This argument allows you to specify the type of exception that you maybe looking for. An example of a specific exception is IOException, which is used when performing any type of IO (input/output) against a file.
304

Debugging and Error Handling
The catch statements are the statements that handle and process the error that has occurred.
The finally statements are the statements to be executed after all other processing has occurred.
You can have multiple Catch blocks, meaning that you can test for multiple errors with different exception types within the same Try block. When an error occurs among the try statements, control is passed to the appropriate Catch block for processing.
When you define a Catch block, you can specify a variable name for the exception and define the type of exception you want to catch, as shown in the following code fragment. This code defines an exception variable with a name of IOExceptionErr, and the type of exception is an IOException. This example traps any type of IO exception that may occur when processing files and stores the error information in an object named IOExceptionErr:
Catch IOExceptionErr As IOException
...
code to handle the exception goes here
...
When dealing with mathematical expressions, you can define and catch the various errors that you may encounter such as a divide-by-zero exception. You can also catch errors such as overflow errors, which may occur when multiplying two numbers and trying to place the result in a variable that is too small for the result. However, in cases such as these, it may be better to check for problems in advance — you should use exceptions only in exceptional circumstances.
Using Structured Error Handling
In the next Try It Out you add some structured error handling to the sample program with which you have been working. When you first ran the Debugging project you received the NullReferenceException that was shown in Figure 9-8, because you tried to access the properties of the strData string variable before it had been set. This code is a prime candidate for structured error handling. You temporarily bypassed the problem at that point by using an If . . . Then . . . Else statement to first see whether the variable had been initialized. A cleaner way to handle such a case is in a Try . . . Catch block.
Try It Out |
Structured Error Handling |
1.Modify the code for the strData variable in the btnStart_Click procedure as shown:
lstData.Items.Add(“String variable data:”) Try
If strData.Length > 0 Then lstData.Items.Add(strData)
End If
Catch NullReferenceExceptionErr As NullReferenceException strData = “String now initialized” lstData.Items.Add(strData)
End Try
305