

Mankiw Principles of Economics (3rd ed)
.pdf112 |
PART TWO SUPPLY AND DEMAND I: HOW MARKETS WORK |
never returned to the peak reached in 1981. The cartel now seems to understand that raising prices is easier in the short run than in the long run.
DOES DRUG INTERDICTION INCREASE
OR DECREASE DRUG-RELATED CRIME?
A persistent problem facing our society is the use of illegal drugs, such as heroin, cocaine, and crack. Drug use has several adverse effects. One is that drug dependency can ruin the lives of drug users and their families. Another is that drug addicts often turn to robbery and other violent crimes to obtain the money needed to support their habit. To discourage the use of illegal drugs, the U.S. government devotes billions of dollars each year to reduce the flow of drugs into the country. Let’s use the tools of supply and demand to examine this policy of drug interdiction.
Suppose the government increases the number of federal agents devoted to the war on drugs. What happens in the market for illegal drugs? As is usual, we answer this question in three steps. First, we consider whether the supply curve or demand curve shifts. Second, we consider the direction of the shift. Third, we see how the shift affects the equilibrium price and quantity.
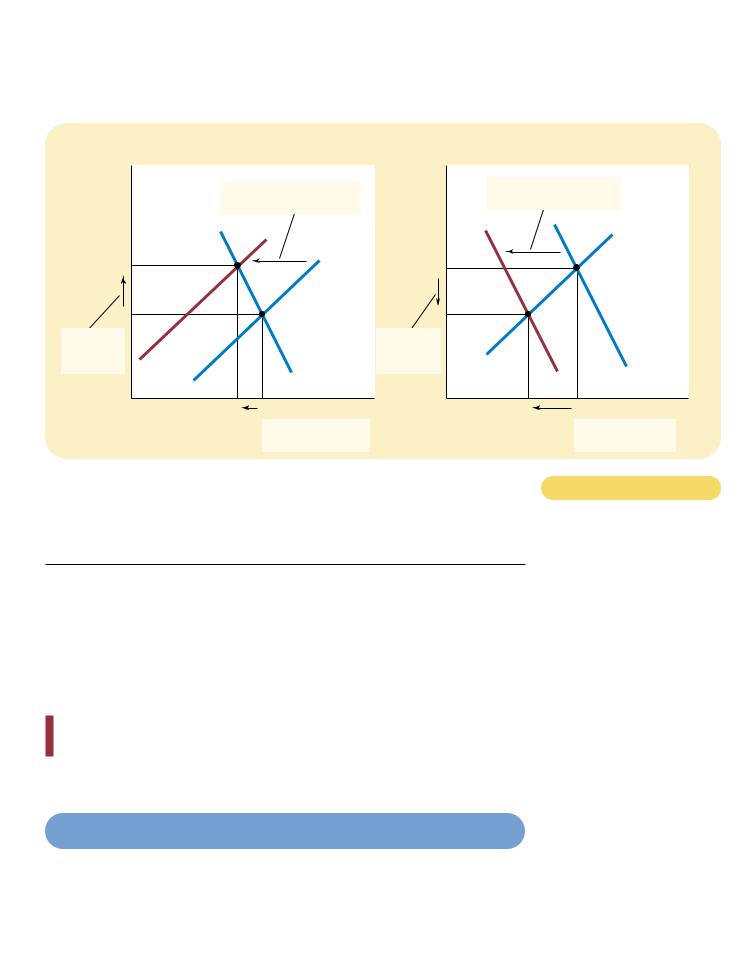
Although the purpose of drug interdiction is to reduce drug use, its direct impact is on the sellers of drugs rather than the buyers. When the government stops some drugs from entering the country and arrests more smugglers, it raises the cost of selling drugs and, therefore, reduces the quantity of drugs supplied at any given price. The demand for drugs—the amount buyers want at any given price— is not changed. As panel (a) of Figure 5-10 shows, interdiction shifts the supply curve to the left from S1 to S2 and leaves the demand curve the same. The equilibrium price of drugs rises from P1 to P2, and the equilibrium quantity falls from Q1 to Q2. The fall in the equilibrium quantity shows that drug interdiction does reduce drug use.
But what about the amount of drug-related crime? To answer this question, consider the total amount that drug users pay for the drugs they buy. Because few drug addicts are likely to break their destructive habits in response to a higher price, it is likely that the demand for drugs is inelastic, as it is drawn in the figure. If demand is inelastic, then an increase in price raises total revenue in the drug market. That is, because drug interdiction raises the price of drugs proportionately more than it reduces drug use, it raises the total amount of money that drug users pay for drugs. Addicts who already had to steal to support their habits would have an even greater need for quick cash. Thus, drug interdiction could increase drug-related crime.
Because of this adverse effect of drug interdiction, some analysts argue for alternative approaches to the drug problem. Rather than trying to reduce the supply of drugs, policymakers might try to reduce the demand by pursuing a policy of drug education. Successful drug education has the effects shown in panel (b) of Figure 5-10. The demand curve shifts to the left from D1 to D2. As a result, the equilibrium quantity falls from Q1 to Q2, and the equilibrium price falls from P1 to P2. Total revenue, which is price times quantity, also falls. Thus, in contrast to drug interdiction, drug education can reduce both drug use and drug-related crime.
Advocates of drug interdiction might argue that the effects of this policy are different in the long run than in the short run, because the elasticity of demand may depend on the time horizon. The demand for drugs is probably inelastic over
CHAPTER 5 |
ELASTICITY AND ITS APPLICATION |
113 |
(a) Drug Interdiction |
(b) Drug Education |
|
Price of |
|
|
|
Price of |
|
|
|
Drugs |
1. Drug interdiction reduces |
Drugs |
1. Drug education reduces |
||||
|
|
||||||
|
|
the demand for drugs . . . |
|||||
|
the supply of drugs . . . |
|
|||||
|
|
|
|
|
|||
|
|
S2 |
|
|
|
|
Supply |
P2 |
|
|
S1 |
|
|
|
|
|
|
|
P1 |
|
|
|
|
P1 |
|
|
|
P2 |
|
|
|
2. . . . which |
|
|
|
2. . . . which |
|
|
|
raises the |
|
|
|
reduces the |
|
|
|
price . . . |
|
|
Demand |
price . . . |
|
|
D1 |
|
|
|
|
|
D2 |
||
|
|
|
|
|
|
|
|
0 |
Q2 |
Q1 |
Quantity of Drugs |
0 |
Q2 |
Q1 |
Quantity of Drugs |
 3. . . . and reduces the quantity sold.
POLICIES TO REDUCE THE USE OF ILLEGAL DRUGS. Drug interdiction reduces the supply of drugs from S1 to S2, as in panel (a). If the demand for drugs is inelastic, then the total amount paid by drug users rises, even as the amount of drug use falls. By contrast, drug education reduces the demand for drugs from D1 to D2, as in panel (b). Because both price and quantity fall, the amount paid by drug users falls.
short periods of time because higher prices do not substantially affect drug use by established addicts. But demand may be more elastic over longer periods of time because higher prices would discourage experimentation with drugs among the young and, over time, lead to fewer drug addicts. In this case, drug interdiction would increase drug-related crime in the short run while decreasing it in the long run.
QUICK QUIZ: How might a drought that destroys half of all farm crops be good for farmers? If such a drought is good for farmers, why don’t farmers destroy their own crops in the absence of a drought?
 3. . . . and reduces the quantity sold.
Figur e 5-10
CONCLUSION
According to an old quip, even a parrot can become an economist simply by learning to say “supply and demand.” These last two chapters should have convinced you that there is much truth in this statement. The tools of supply and demand allow you to analyze many of the most important events and policies that shape

114 |
PART TWO SUPPLY AND DEMAND I: HOW MARKETS WORK |
the economy. You are now well on your way to becoming an economist (or, at least, a well-educated parrot).
The price elasticity of demand quantity demanded responds to Demand tends to be more elastic rather than a necessity, if close
if the market is narrowly defined, substantial time to react to a price
The price elasticity of demand is percentage change in quantity the percentage change in price. than 1, so that quantity demanded proportionately less than the inelastic. If the elasticity is greater quantity demanded moves
the price, demand is said to be
Total revenue, the total amount the price of the good times the inelastic demand curves, total rises. For elastic demand curves, price rises.
The income elasticity of demand the quantity demanded responds
Summar y
The cross-price elasticity of demand the quantity demanded of one price of another good.
of supply measures how much the responds to changes in the price. This on the time horizon under
most markets, supply is more elastic in the short run.
of supply is calculated as the
in quantity supplied divided by the in price. If the elasticity is less than 1,
supplied moves proportionately less is said to be inelastic. If the
than 1, so that quantity supplied more than the price, supply is
and demand can be applied in many markets. This chapter uses them to
for wheat, the market for oil, and the drugs.
Key Concepts
elasticity, p. 94 |
-price elasticity of demand, p. 104 |
price elasticity of demand, p. 94 |
elasticity of supply, p. 104 |
Questions for Review
1.Define the price elasticity of demand and the income elasticity of demand.
2.List and explain some of the determinants of the price elasticity of demand.
3.If the elasticity is greater than 1, is demand elastic or inelastic? If the elasticity equals 0, is demand perfectly elastic or perfectly inelastic?
4.On a supply-and-demand diagram, show equilibrium price, equilibrium quantity, and the total revenue received by producers.
5.If demand is elastic, how will an increase in price change total revenue? Explain.
6.What do we call a good whose income elasticity is less than 0?
7.How is the price elasticity of supply calculated? Explain what this measures.
8.What is the price elasticity of supply of Picasso paintings?
9.Is the price elasticity of supply usually larger in the short run or in the long run? Why?
10.In the 1970s, OPEC caused a dramatic increase in the price of oil. What prevented it from maintaining this high price through the 1980s?

CHAPTER 5 ELASTICITY AND ITS APPLICATION |
115 |
Problems and Applications
1.For each of the following pairs of goods, which good would you expect to have more elastic demand
and why?
a.required textbooks or mystery novels
b.Beethoven recordings or classical music recordings in general
c.heating oil during the next six months or heating oil during the next five years
d.root beer or water
2.Suppose that business travelers and vacationers have the following demand for airline tickets from New York to Boston:
|
QUANTITY DEMANDED |
QUANTITY DEMANDED |
PRICE |
(BUSINESS TRAVELERS) |
(VACATIONERS) |
|
|
|
$150 |
2,100 |
1,000 |
200 |
2,000 |
800 |
250 |
1,900 |
600 |
300 |
1,800 |
400 |
a.As the price of tickets rises from $200 to $250, what is the price elasticity of demand for (i) business travelers and (ii) vacationers? (Use the midpoint method in your calculations.)
b.Why might vacationers have a different elasticity than business travelers?
3.Suppose that your demand schedule for compact discs is as follows:
|
QUANTITY DEMANDED |
QUANTITY DEMANDED |
PRICE |
(INCOME $10,000) |
(INCOME $12,000) |
|
|
|
$ 8 |
40 |
50 |
10 |
32 |
45 |
12 |
24 |
30 |
14 |
16 |
20 |
16 |
8 |
12 |
a.Use the midpoint method to calculate your price elasticity of demand as the price of compact discs increases from $8 to $10 if (i) your income is $10,000, and (ii) your income is $12,000.
b.Calculate your income elasticity of demand as your income increases from $10,000 to $12,000 if (i) the price is $12, and (ii) the price is $16.
4.Emily has decided always to spend one-third of her income on clothing.
a.What is her income elasticity of clothing demand?
b.What is her price elasticity of clothing demand?
c.If Emily’s tastes change and she decides to spend only one-fourth of her income on clothing, how does her demand curve change? What are her income elasticity and price elasticity now?
5.The New York Times reported (Feb. 17, 1996, p. 25) that subway ridership declined after a fare increase: “There were nearly four million fewer riders in December 1995, the first full month after the price of a token increased 25 cents to $1.50, than in the previous December, a 4.3 percent decline.”
a.Use these data to estimate the price elasticity of demand for subway rides.
b.According to your estimate, what happens to the Transit Authority’s revenue when the fare rises?
c.Why might your estimate of the elasticity be unreliable?
6.Two drivers—Tom and Jerry—each drive up to a gas station. Before looking at the price, each places an order. Tom says, “I’d like 10 gallons of gas.” Jerry says, “I’d like $10 worth of gas.” What is each driver’s price elasticity of demand?
7.Economists have observed that spending on restaurant meals declines more during economic downturns than does spending on food to be eaten at home. How might the concept of elasticity help to explain this phenomenon?
8.Consider public policy aimed at smoking.
a.Studies indicate that the price elasticity of demand for cigarettes is about 0.4. If a pack of cigarettes currently costs $2 and the government wants to reduce smoking by 20 percent, by how much should it increase the price?
b.If the government permanently increases the price of cigarettes, will the policy have a larger effect on smoking one year from now or five years from now?
c.Studies also find that teenagers have a higher price elasticity than do adults. Why might this be true?
9.Would you expect the price elasticity of demand to be larger in the market for all ice cream or the market for vanilla ice cream? Would you expect the price elasticity of supply to be larger in the market for all ice cream or the market for vanilla ice cream? Be sure to explain your answers.
10.Pharmaceutical drugs have an inelastic demand, and computers have an elastic demand. Suppose that
116 |
PART TWO SUPPLY AND DEMAND I: HOW MARKETS WORK |
technological advance doubles the supply of both products (that is, the quantity supplied at each price is twice what it was).
a.What happens to the equilibrium price and quantity in each market?
b.Which product experiences a larger change in price?
c.Which product experiences a larger change in quantity?
d.What happens to total consumer spending on each product?
11.Beachfront resorts have an inelastic supply, and automobiles have an elastic supply. Suppose that a rise in population doubles the demand for both products (that is, the quantity demanded at each price is twice what it was).
a.What happens to the equilibrium price and quantity in each market?
b.Which product experiences a larger change in price?
c.Which product experiences a larger change in quantity?
d.What happens to total consumer spending on each product?
12.Several years ago, flooding along the Missouri and Mississippi rivers destroyed thousands of acres of wheat.
a.Farmers whose crops were destroyed by the floods were much worse off, but farmers whose crops were not destroyed benefited from the floods. Why?
b.What information would you need about the market for wheat in order to assess whether farmers as a group were hurt or helped by the floods?
13.Explain why the following might be true: A drought around the world raises the total revenue that farmers receive from the sale of grain, but a drought only in Kansas reduces the total revenue that Kansas farmers receive.
14.Because better weather makes farmland more productive, farmland in regions with good weather conditions is more expensive than farmland in regions with bad weather conditions. Over time, however, as advances in technology have made all farmland more productive, the price of farmland (adjusted for overall inflation) has fallen. Use the concept of elasticity to explain why productivity and farmland prices are positively related across space but negatively related over time.

S U P P L Y , D E M A N D , A N D
G O V E R N M E N T P O L I C I E S
Economists have two roles. As scientists, they develop and test theories to explain the world around them. As policy advisers, they use their theories to help change the world for the better. The focus of the preceding two chapters has been scientific. We have seen how supply and demand determine the price of a good and the quantity of the good sold. We have also seen how various events shift supply and demand and thereby change the equilibrium price and quantity.
This chapter offers our first look at policy. Here we analyze various types of government policy using only the tools of supply and demand. As you will see, the analysis yields some surprising insights. Policies often have effects that their architects did not intend or anticipate.
We begin by considering policies that directly control prices. For example, rentcontrol laws dictate a maximum rent that landlords may charge tenants. Minimumwage laws dictate the lowest wage that firms may pay workers. Price controls are
IN THIS CHAPTER YOU WILL . . .
Examine the ef fects of government policies that place a ceiling on prices
Examine the ef fects of government policies that put a floor under prices
Consider how a tax on a good af fects the price of the good and the quantity sold
Learn that taxes levied on buyers and taxes levied on sellers ar e equivalent
See how the bur den of a tax is split between buyers and sellers
117

118 |
PART TWO SUPPLY AND DEMAND I: HOW MARKETS WORK |
price ceiling
a legal maximum on the price at which a good can be sold
price floor
a legal minimum on the price at which a good can be sold
usually enacted when policymakers believe that the market price of a good or service is unfair to buyers or sellers. Yet, as we will see, these policies can generate inequities of their own.
After our discussion of price controls, we next consider the impact of taxes. Policymakers use taxes both to influence market outcomes and to raise revenue for public purposes. Although the prevalence of taxes in our economy is obvious, their effects are not. For example, when the government levies a tax on the amount that firms pay their workers, do the firms or the workers bear the burden of the tax? The answer is not at all clear—until we apply the powerful tools of supply and demand.
CONTROLS ON PRICES
To see how price controls affect market outcomes, let’s look once again at the market for ice cream. As we saw in Chapter 4, if ice cream is sold in a competitive market free of government regulation, the price of ice cream adjusts to balance supply and demand: At the equilibrium price, the quantity of ice cream that buyers want to buy exactly equals the quantity that sellers want to sell. To be concrete, suppose the equilibrium price is $3 per cone.
Not everyone may be happy with the outcome of this free-market process. Let’s say the American Association of Ice Cream Eaters complains that the $3 price is too high for everyone to enjoy a cone a day (their recommended diet). Meanwhile, the National Organization of Ice Cream Makers complains that the $3 price—the result of “cutthroat competition”—is depressing the incomes of its members. Each of these groups lobbies the government to pass laws that alter the market outcome by directly controlling prices.
Of course, because buyers of any good always want a lower price while sellers want a higher price, the interests of the two groups conflict. If the Ice Cream Eaters are successful in their lobbying, the government imposes a legal maximum on the price at which ice cream can be sold. Because the price is not allowed to rise above this level, the legislated maximum is called a price ceiling. By contrast, if the Ice Cream Makers are successful, the government imposes a legal minimum on the price. Because the price cannot fall below this level, the legislated minimum is called a price floor. Let us consider the effects of these policies in turn.
HOW PRICE CEILINGS AFFECT MARKET OUTCOMES
When the government, moved by the complaints of the Ice Cream Eaters, imposes a price ceiling on the market for ice cream, two outcomes are possible. In panel (a) of Figure 6-1, the government imposes a price ceiling of $4 per cone. In this case, because the price that balances supply and demand ($3) is below the ceiling, the price ceiling is not binding. Market forces naturally move the economy to the equilibrium, and the price ceiling has no effect.
Panel (b) of Figure 6-1 shows the other, more interesting, possibility. In this case, the government imposes a price ceiling of $2 per cone. Because the equilibrium price of $3 is above the price ceiling, the ceiling is a binding constraint on the market.

CHAPTER 6 |
SUPPLY, DEMAND, AND GOVERNMENT POLICIES |
119 |
(a) A Price Ceiling That Is Not Binding |
(b) A Price Ceiling That Is Binding |
|
Price of |
|
|
Ice-Cream |
|
|
Cone |
|
Supply |
|
|
|
$4 |
|
Price |
|
|
ceiling |
3 |
|
|
Equilibrium |
|
|
price |
|
|
|
|
Demand |
0 |
100 |
Quantity of |
|
Equilibrium |
Ice-Cream |
|
quantity |
Cones |
Price of |
|
|
|
Ice-Cream |
|
|
|
Cone |
|
Supply |
|
|
|
|
|
Equilibrium |
|
|
|
price |
|
|
|
$3 |
|
|
|
2 |
|
|
Price |
|
Shortage |
ceiling |
|
|
|
|
Demand |
0 |
75 |
125 |
Quantity of |
|
Quantity |
Quantity |
Ice-Cream |
|
supplied |
demanded |
Cones |
|
|
|
A MARKET WITH A PRICE CEILING. In panel (a), the government imposes a price ceiling |
Figur e 6-1 |
|
of $4. Because the price ceiling is above the equilibrium price of $3, the price ceiling has no |
|
|
|
|
|
effect, and the market can reach the equilibrium of supply and demand. In this |
|
|
equilibrium, quantity supplied and quantity demanded both equal 100 cones. In panel (b), |
|
|
the government imposes a price ceiling of $2. Because the price ceiling is below the |
|
|
equilibrium price of $3, the market price equals $2. At this price, 125 cones are demanded |
|
|
and only 75 are supplied, so there is a shortage of 50 cones. |
|
|
|
|
|
|
|
|
The forces of supply and demand tend to move the price toward the equilibrium price, but when the market price hits the ceiling, it can rise no further. Thus, the market price equals the price ceiling. At this price, the quantity of ice cream demanded (125 cones in the figure) exceeds the quantity supplied (75 cones). There is a shortage of ice cream, so some people who want to buy ice cream at the going price are unable to.
When a shortage of ice cream develops because of this price ceiling, some mechanism for rationing ice cream will naturally develop. The mechanism could be long lines: Buyers who are willing to arrive early and wait in line get a cone, while those unwilling to wait do not. Alternatively, sellers could ration ice cream according to their own personal biases, selling it only to friends, relatives, or members of their own racial or ethnic group. Notice that even though the price ceiling was motivated by a desire to help buyers of ice cream, not all buyers benefit from the policy. Some buyers do get to pay a lower price, although they may have to wait in line to do so, but other buyers cannot get any ice cream at all.
This example in the market for ice cream shows a general result: When the government imposes a binding price ceiling on a competitive market, a shortage of the good arises, and sellers must ration the scarce goods among the large number of potential buyers.
The rationing mechanisms that develop under price ceilings are rarely desirable. Long lines are inefficient, because they waste buyers’ time. Discrimination according to seller bias is both inefficient (because the good does not go to the buyer who values it most highly) and potentially unfair. By contrast, the rationing mechanism

120 |
PART TWO SUPPLY AND DEMAND I: HOW MARKETS WORK |
WHO IS RESPONSIBLE FOR THIS—OPEC
OR U.S. LAWMAKERS?
in a free, competitive market is both efficient and impersonal. When the market for ice cream reaches its equilibrium, anyone who wants to pay the market price can get a cone. Free markets ration goods with prices.
CASE STUDY LINES AT THE GAS PUMP
As we discussed in the preceding chapter, in 1973 the Organization of Petroleum Exporting Countries (OPEC) raised the price of crude oil in world oil markets. Because crude oil is the major input used to make gasoline, the higher oil prices reduced the supply of gasoline. Long lines at gas stations became commonplace, and motorists often had to wait for hours to buy only a few gallons of gas.
What was responsible for the long gas lines? Most people blame OPEC. Surely, if OPEC had not raised the price of crude oil, the shortage of gasoline would not have occurred. Yet economists blame government regulations that limited the price oil companies could charge for gasoline.
Figure 6-2 shows what happened. As shown in panel (a), before OPEC raised the price of crude oil, the equilibrium price of gasoline P1 was below the price ceiling. The price regulation, therefore, had no effect. When the price of crude oil rose, however, the situation changed. The increase in the price of crude
(a) The Price Ceiling on Gasoline Is Not Binding |
(b) The Price Ceiling on Gasoline Is Binding |
Price of |
|
|
Price of |
|
|
|
S2 |
Gasoline |
|
|
Gasoline |
|
|
|
|
|
|
|
|
|
2. . . . but when |
||
|
|
|
|
|
|
|
|
|
|
|
|
|
|
|
supply falls . . . |
|
|
Supply, S1 |
|
|
|
|
S1 |
1. Initially, |
|
|
P2 |
|
|
|
|
the price |
|
|
|
|
|
|
|
|
|
|
|
|
|
|
|
ceiling |
|
|
|
|
|
|
|
is not |
|
Price ceiling |
|
|
|
|
Price ceiling |
binding . . . |
|
|
|
|
|
||
|
|
|
|
|
|
|
|
P1 |
|
|
P1 |
|
|
|
3. . . . the price |
|
|
|
4. . . . |
|
|
|
ceiling becomes |
|
|
|
|
|
|
binding . . . |
|
|
|
|
resulting |
|
|
|
|
|
|
|
|
|
|
|
|
|
|
|
in a |
|
|
|
|
|
|
Demand |
shortage. |
|
|
|
Demand |
0 |
Q1 |
Quantity of |
0 |
QS |
QD |
Q1 |
Quantity of |
|
|
Gasoline |
|
|
|
|
Gasoline |
Figur e 6-2
THE MARKET FOR GASOLINE WITH A PRICE CEILING. Panel (a) shows the gasoline
market when the price ceiling is not binding because the equilibrium price, P1, is below the ceiling. Panel (b) shows the gasoline market after an increase in the price of crude oil (an input into making gasoline) shifts the supply curve to the left from S1 to S2. In an unregulated market, the price would have risen from P1 to P2. The price ceiling, however, prevents this from happening. At the binding price ceiling, consumers are willing to buy QD, but producers of gasoline are willing to sell only QS. The difference between quantity demanded and quantity supplied, QD QS, measures the gasoline shortage.

CHAPTER 6 SUPPLY, DEMAND, AND GOVERNMENT POLICIES |
121 |
|
|
|
|
IN THE NEWS
Does a Drought Need to Cause a Water Shortage?
main cause of the shortages. . . .
consumption. This has prompted some police departments to collect lists of residents suspected of wasting water.
There’s a better answer than sending out the cops. Market forces could ensure plentiful water availability even in drought years. Contrary to popular belief, the supply of water is no more fixed than the supply of oil. Like all resources, water supplies change in response to economic growth and to the price. In developing countries, despite population growth, the percentage of people with access to safe drinking water has increased to 74 percent in 1994 from 44 percent in 1980. Rising incomes have given those countries the wherewithal to supply potable water.
Supplies also increase when current users have an incentive to conserve their surplus in the marketplace. California’s drought-emergency water bank illustrates this. The bank allows farmers to lease water from other users during dry spells. In 1991, the first year the bank was tried, when the price was $125 per acre-foot (326,000 gallons), supply exceeded demand by two to one. That is,
more people wanted to sell their than wanted to buy.
Data from every corner of the world that when cities raise the price of by 10 percent, water use goes by as much as 12 percent. When price of agricultural water goes up percent, usage goes down by 20
. . . .
Unfortunately, Eastern water users do not pay realistic prices for water. According to the American Water Works Association, only 2 percent of municipal water suppliers adjust prices seasonally. . . .
Even more egregious, Eastern water laws bar people from buying and selling water. Just as tradable pollution permits established under the Clean Air Act have encouraged polluters to find efficient ways to reduce emissions, tradable water rights can encourage conservation and increase supplies. It is mainly a matter of following the lead of Western water courts that have quantified water rights and Western legislatures that have allowed trades.
By making water a commodity and unleashing market forces, policymakers can ensure plentiful water supplies for all. New policies won’t make droughts disappear, but they will ease the pain they impose by priming the invisible pump of water markets.
SOURCE: The Wall Street Journal, August 23, 1999, p. A14.
oil raised the cost of producing gasoline, and this reduced the supply of gasoline. As panel (b) shows, the supply curve shifted to the left from S1 to S2. In an unregulated market, this shift in supply would have raised the equilibrium price of gasoline from P1 to P2, and no shortage would have resulted. Instead, the price ceiling prevented the price from rising to the equilibrium level. At the