

Nafziger Economic Development (4th ed)
.pdf606Part Four. The Macroeconomics and International Economics of Development
example, labor abundant Taiwan) from expanded trade, arguing for protecting urban skilled and educated workers from less-skilled workers. Moreover, in low-income countries, ruling elites, subject to urban pressures (see Chapter 7 on urban bias), may use minimum wage laws and price policies to protect the incomes of urban workers, usually with more education and skill, relative to farm workers.
Berman, Bound, and Machin (1998) have shown a worldwide enskilling of labor, affected by skill-biased technological change, even in middle-income countries, although eluding the poorest countries (ibid.; Berman and Machin 2000). Arbache, Dickerson, and Green (2004:F73–F96) find that LDCs, such as Brazil, that import DC technology after trade liberalization increase the skill premium.
What about arguments, used by opponents to trade expansion in the United States, for protection against goods embodying cheap labor? Surely law, culture, and relative resource prices and proportions are at the heart of differences that contribute to comparative advantage and disadvantage. Of course, under restrictive assumptions, free trade lowers the wage of the scarce factor, which in DCs is labor (Stolper and Samuelson 1941:58–73). However, free trade increases national income. A rich country can use taxes and subsidies, unemployment compensation, and training programs to see that neither dislocated workers nor the rest of the population loses from external competition. (For a symposium on DC income inequality and trade, see Freeman 1995:15–32; Richardson 1995:33–55; Wood 1995:57–80).
Child labor. The International Labour Organization estimates that about 210 million of the world’s children between 5 and 14 years were working, with 170 million in hazardous work, in 2000. More than 100 million children, that is, about 10 percent of the world’s children, were working full time. One of every five of the world’s primary-school-aged children is not enrolled in school. Child labor, mostly in rural areas, largely reflects the poverty of the children’s households (Udry 2003). Indeed “child labor exists because it is the best response people can find in intolerable circumstances” (ibid., p. 1). Anne Krueger (World Bank Development News, October 29, 2002) argues that child labor occurs not because parents are cruel but “because the alternative to child labor is starvation or forced early marriages [for girls] or prostitution or life on the streets as a beggar.” Poverty increases the incidence of child trafficking from poor countries, especially to areas experiencing a recent boom.
Those skeptical about globalization argue that increased trade openness and FDI encourage LDCs to keep labor costs low by letting children work. However, Eric Neumayer and Indra de Soysa (2003) show that countries that are more open toward trade, globalization, and FDI have a lower incidence of child labor. The link to child labor is not multinational corporations but the country’s comparative advantage in unskilled-labor-intensive goods (Busse and Braun 2003). Moreover, Eric Edmonds and Nina Pavcnik (2002) find that a liberalized trade policy in Vietnam increased rice prices and reduced child labor, especially for girls. In a related study, Edmonds (2003) shows that from 1993 to 1997, when GDP per capita in Vietnam grew by 6 to 7 percent yearly, child labor declined by 28 percent. In efforts to generalize crossnationally, Edmonds and Pavcnik’s (2004) analysis demonstrates that trade does not
17. International Trade |
607 |
play a role “in perpetuating the high levels of child labor that pervade low income countries.”
Moshe Hazan and Binyamin Berdugo (2002) argue that child labor reduces the net cost of child rearing, enabling high fertility rates. However, once technological change increases the wage differentials between parental and child labor, child labor is less essential, leading parents to invest more in their children’s education and reduce fertility (see also Chapter 8). In Egypt, according to Jackline Wahba (2000), the use of child labor falls when the wages of illiterate males increase.
Kathleen Beegle, Rajeev Dehejia, and Roberta Gatti (2003), who use panel data in Tanzania, find that transitory income shocks (reductions) and credit limitations (that is, illiquidity) play an important role in explaining why children work. Dehejia and Gatti (2002), in a cross-country study, find that child labor is more likely when credit markets are inaccessible and when households face periods of income variability. Removing imperfections in informal credit markets can mitigate child labor problems (Chaudhuri 2002).
School fees can be an important contributor to child labor. In Togo, young boys told Human Rights Watch (2003) that they could not afford to pay school fees and so did arduous agricultural work in Nigeria. In a nonpoor economy, legal compulsory school attendance can increase educational attainment (Lleras-Muney 2001). However, low-income countries should resolve the problem, according to Matthias Busse and Sebastian Braun (2003), not by banning child labor, which only pushes poorer households into greater poverty. A better option is economic incentives to pull children out of the labor force, with subsidies, including school meals.
For Udry (2003), targeted subsidies for school attendance are effective in reducing child labor because they successfully address both the problems of parental poverty and imperfect financial markets. An example is Mexico’s innovative Progressa poverty program, introduced in 1998, in which mothers of enrolled students receive grants that have a value slightly less than the child would earn by working full time. The program increased school attendance and reduced child labor appreciably. Rural Bangladesh had a program, Food-for-Education, in which children received food worth 15–25 percent of the average monthly earnings of working children (ibid., pp. 16–17).
Should DCs use trade sanctions against LDCs that use child labor? No. Sarbajit Chaudhuri (2003) thinks that these sanctions will produce perverse effects; a liberalized trade policy, which results in positive-sum gains, is more effective in bringing down the evil of child labor.
Trade and the environment. What about the argument for protection against goods using polluting processes that American law prohibits? Do LDC pollution havens distort comparative advantage? Hufbauer and Schott (1993:94) say “no”: the international trading rules “are designed to prevent environmental measures from becoming a new handmaiden of protection.” Moreover, according to U.S. Census Bureau data, pollution control expenditures as a percentage of value added in manufacturing in 1991 were only 1.72 percent. Furthermore, the U.S. Department of Labor found
608Part Four. The Macroeconomics and International Economics of Development
that less than 0.2 of 1 percent of layoffs in 1987–90 resulted from environmental and safety regulations (Field and Field 2002:13).
What about cross-national empirical evidence on trade and the environment? Antweiler, Copeland, and Taylor (2001:877–908), using data from 108 cities in 43 DCs and LDCs from 1971 to 1996, find that free trade is generally good for the environment; that is, if trade openness raises world incomes by 1 percent, pollution concentrations fall by roughly 1 percent. For specific countries, the effect of pollution depends on the underlying sources of growth. If capital is the major source of growth, then pollution rises. Indeed the authors indicate that DCs have a comparative advantage in dirty capital-intensive products. Yet environmental regulations, usually offset by other factors, have little overall effect on trade flows. Antweiler et al. (2001) find no evidence that pollution havens distort comparative advantage.
Shifts in the Terms of Trade
One sign of the peripheralness of many low-income primary-product exporting countries is their international trade vulnerability, which is exacerbated by a high export primary commodity concentration ratio (the three leading primary products as a percentage of total merchandise exports, as discussed in Chapter 4). The high commodity concentration of nonoil primary product exporters is associated with volatile export prices and earnings. Some LDCs are vulnerable to relative international price instability not only because of their dependence on volatile primary product exports but also because exports are highly concentrated in a few commodities and directed to a few countries. The resulting wide swings in export prices have had a disastrous effect on government budgets and external balances.
A measure of relative export prices, the commodity terms of trade, equals the price index of exports divided by the price index of imports. If export prices increase 10 percent and import prices 21 percent, the commodity terms of trade drop 9 percent, that is, 1.10/1.21 = 0.91.
Soon after World War II, Raul Prebisch, then Director General of the Economic Commission for Latin America, and Hans Singer, with the U.N. Department of Economic and Social Affairs, argued that the commodity terms of trade of countries (mainly LDCs) producing primary goods (food, raw materials, minerals, and organic oils and fats) decline in the long run. The trend, taken from a League of Nations statistical series, is inferred from the inverse of the rising terms of trade, 1876–80 to 1938, of Britain, a manufactures exporter and primary product importer.
The Prebisch–Singer thesis states that the terms of trade deteriorated historically because of differences in the growth of demand for, and the market structure in, primary and manufacturing production (U.N. 1949; Singer 1950:473–485; Prebisch 1962:1–22; also Nurkse 1961). Engel’s law indicates that as income increases, the proportion of income spent on manufactured goods rises and the proportion spent on primary products falls. If resources do not shift from primary to manufacturing output, there will be an excess supply of, and declining relative price in, primary products and an excess demand for, and increasing relative price in, manufactured goods. Moreover, the predominantly nonoil primary products that LDCs export and
17. International Trade |
609 |
2.5 |
|
|
|
|
|
|
|
|
|
|
|
|
|
2.0 |
|
|
|
|
|
|
|
|
|
|
|
|
|
1.5 |
|
|
|
|
|
|
|
|
|
|
|
|
|
1.0 |
|
|
|
|
|
|
|
|
|
|
|
|
|
0.5 |
|
|
|
|
|
|
|
|
|
|
|
|
|
1948 |
1952 |
1956 |
1960 |
1964 |
1968 |
1972 |
1976 |
1980 |
1984 |
1988 |
1992 |
1996 |
2000 |
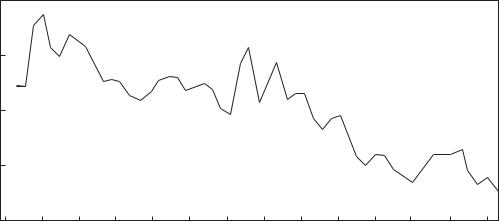
FIGURE 17-1. Nonoil Commodity Prices Relative to Unit Value of Manufactures Exports, 1948–2001.a
a Index of 33 nonoil commodity prices deflated by the unit value of manufactures index 1987 = 1.0. Source: World Bank 1993i:58; World Bank 2002e:18.
the manufactured products exports by DCs and a few newly industrializing countries are not priced the same way. Although global marketing for most primary products is oligopolistic, the LDC farmer is a price taker, with no influence on market price; however, widespread commodity productivity gains can result in lower prices. By contrast, most industrial production and marketing are relatively monopolistic, with productivity gains leading to higher prices.
Is the Prebisch–Singer thesis adequate? Can we arrive at a historical law based on Britain’s relatively declining primary product prices for a seven-decade period? If we exclude the depressed prices of the 1930s, the price fall from the 1870s is not really so great. Furthermore, the increase in the British commodity terms of trade shown by the League of Nations data may be partly an artifact of the inadequate measure. The data do not adequately account for qualitative improvements taking place predominantly in manufactured goods. Although there was little difference between a bushel of grain in 1880 and 1938, new and improved manufactured goods were developed during the period. Additionally, international shipping costs fell with the opening of the Suez and Panama canals and the development of refrigeration and steamships. Because international transport rates enter only import prices (measured with the cost of insurance and freight, c.i.f.), but not exports, falling rates would reduce import prices more than export prices. The two factors result in an upward bias in the British terms of trade (Lewis 1952:105–138; Yotopoulos and Nugent 1976:342–345). Yet John Spraos’s (1983) careful statistical study for the United Nations shows that, when we adjust for the problems mentioned, the League of Nations data would still indicate a deterioration of primary producers’ terms of trade, although by a smaller magnitude than Prebisch and Singer thought.
Figure 17-1 shows a declining trend for the price of nonoil commodities relative to exports of manufactures from 1948 to 2001. This has adversely affected the
610Part Four. The Macroeconomics and International Economics of Development
growth of a number of nonoil primary product exporters, such as Ethiopia, Zambia, Uganda, Togo, Papua New Guinea, Myanmar, Honduras, Panama, Coteˆ d’Ivoire, Bolivia, Nicaragua, Kenya, Madagacar, and Central African Republic (see Chapter 4). Indeed, the U.N. Conference on Trade and Development (2004:82–83, 132) sees a broad association between (nonoil) commodity dependence and extreme poverty among least-developed countries. African countries have especially suffered from this dependence (Collier 2002). (See also sub-Saharan Africa’s decline in terms of trade, 1972–1992, in Nafziger, 2006b.)
However, Spraos’s figures for Britain’s relative primary prices rose between 1939 and 1973, just after the League’s figures. Thus, Spraos concludes that although Prebisch and Singer got the direction of changes in the terms of trade from 1876– 80 to 1938 right, if we extend the data to 1973, the falling commodity terms of trade for primary products are open to doubt. Pier Giorgio Ardeni and Brian Wright (1992:803–812), however, using a statistical approach that does not assume stationarity of the underlying data, reinforce the validity of the Prebisch-Singer finding both through 1938 and for data extended through 1988.
Are other more complex measures more useful than the commodity terms of trade? As illustrated earlier, if export prices increase 10 percent and import prices 21 percent for a decade, the commodity terms of trade, 1.10/1.21, drop to 0.91. However, if the quantity of exports expands by 10 percent for the decade, the income terms of trade (the value index of exports divided by the price index of imports) are (1.10 × 1.10)/1.21 = 1.00. This figure means the country has the same export purchasing power as it did a decade ago. Although oil-importing, middle-income countries had a decline in commodity terms of trade, from 1970 to 1980, a rapid expansion in export volume enabled them to increase export purchasing power (World Bank 1981i:21). Income terms of trade are also an appropriate measure when the country’s export commodities have a large share of the world market (Brazil’s coffee and Saudi Arabia’s oil), so that export prices depend on export quantum.
The country might be interested in whether it increases the quantity of imports available per factors employed in export production. Assume that output per combined factor inputs increases by 10 percent over the decade. The commodity terms of trade, 0.91, multiplied by 1.10 yields 1.00, the single factoral terms of trade. This figure implies that the output of a given amount of the country’s productive resources can purchase as many imports as it did a decade ago.
Thus, a country’s commodity terms of trade may decline at the same time that export purchasing power and single factoral terms of trade increase.
Although the degree of monopoly may differ between DCs and LDCs, the argument for deteriorating terms of trade depends on the change in, not the extent of, monopoly power in primary and secondary production. There is no evidence that industrial monopoly power increases more rapidly than agricultural monopoly power.
The view that LDCs export primary products whose terms of trade are declining and DCs export manufacturers with increasing terms of trade is oversimplified in many ways.

17. International Trade |
|
|
|
611 |
|||
|
|
|
|||||
|
TABLE 17-2. Terms of Trade,a 1979, 1989, 1994, 2004 (1970 = 100) |
|
|||||
|
|
1979 |
1989 |
1994 |
2004 |
|
|
|
|
|
|
|
|
|
|
|
Developing |
150 |
123 |
117 |
128 |
|
|
|
countriesb |
|
|
|
|
|
|
|
Africa |
126 |
99 |
84 |
97 |
|
|
|
Asia |
98 |
90 |
92 |
97 |
|
|
|
Latin America |
140 |
113 |
100 |
107 |
|
|
|
Middle East |
305 |
233 |
179 |
302 |
|
|
|
Oil-importing |
94 |
82 |
81 |
80 |
|
|
|
developing |
|
|
|
|
|
|
|
countries |
|
|
|
|
|
|
|
Oil-exporting |
357 |
256 |
216 |
227 |
|
|
|
developing |
|
|
|
|
|
|
|
countries |
|
|
|
|
|
|
|
Developed |
93 |
100 |
123 |
123 |
|
|
|
countries |
|
|
|
|
|
|
aCommodity terms of trade. A value in excess of 100 in 1979 and an increasing value from 1979 to 1989 or from 1989 to 1994 indicate increases in the terms of trade, while a value below 100 in 1979 and a declining value from 1979 to 1989 or from 1989 to 1994 indicate decreases.
b Excludes China 1970–79 but includes China 1979–2004.
Source: Calculated from IMF 1988d:133, 140; IMF 1994d: 145–148; IMF 2003d:201–204; IMF 2004d:214–216.
Charles Kindleberger’s evidence (1956) does not support deteriorating long-run terms of trade for primary product exporters. He does, however, find that the LDCs are especially vulnerable to declining terms of trade because they cannot easily shift resources to accord with shifting patterns of comparative advantage. Primaryproduct export concentration, the dependence of LDC primary exports on foreign multinational corporations for processing, marketing, and financing, and limitations on the expansion of processing indicate the LDCs’ inability to shift resources with changing demand and technologies. Sub-Saharan Africa, whose terms of trade, 1972– 1992, are shown in a figure in Nafziger (2006b), has been plagued by such problems; note that the sub-Sahara’s export purchasing power fell even faster than the commodity terms of trade.
Table 17-2 indicates that major exporters of one primary good, crude petroleum, made extraordinary improvements in their terms of trade in the 1970s. In fact, a country’s international trade position in oil overwhelmed other factors in determining its direction in the commodity terms of trade. The 1979 terms of trade of petroleum exporters, with the oil price shock of 1973–1974 and the late 1970s’ price spike (Chapter 13), were three to four times 1970 levels and those of petroleum-importing countries decreased over the same period (although slightly less than those of DCs). However, the terms of trade for both oil-exporting and oil-importing developing
612Part Four. The Macroeconomics and International Economics of Development
countries fell in the 1980s and early 1990s, whereas the terms of trade for DCs rose during the same periods.
A single country, such as 19th-century Japan, exporting agricultural and light manufacturing goods, would often be a price taker with substantial scope in expanding export receipts alongside a long-run elastic supply curve. Could not a single primaryproducing country today assume that it could expand export volume without adversely affecting price? The World Bank admonishes Third World governments to “get prices right,” allowing prices to reach a market-clearing rate, rejecting past policies of setting minimum prices for industrial goods, fixing price ceilings on food, and setting low prices for foreign currency, which discourage primary product exports. However, today this single-country analysis suffers from a fallacy of composition: What is true of the individual case is not necessarily true of all cases combined. Thus, although policies promoting domestic-currency prices favorable to primary-product exporters might help a given country (whose global market share is probably too small to affect world price adversely), the adoption of these policies by a number of LDCs under pressure to improve external balances results in a market glut from increased export volume, which reduces total export receipts when the price elasticity of demand (the absolute value of the percentage change in quantity demanded divided by the percentage change in price) is less than one (inelastic). Inelastic demand can be illustrated by the doubling of cocoa exports (in tons), thereby reducing their prices per ton 75 percent so that total export receipts fall by 50 percent.
Import Substitution and Export Expansion in Industry
Given the slow growth of exports, many LDC governments try to industrialize and improve their international balance of payments by import substitution (replacing imports by domestic industry) and export expansion.
The simplest base for early industrial expansion is producing consumer goods for a market previously created by imports. It becomes more difficult, however, to undertake successive import substitution, which usually involves intermediate and capital goods that require more capital-intensive investments with larger import contents.
Import substitution can be justified on many grounds – increasing returns to scale, external economies, technological borrowing, internal stability, and other tariff arguments already presented – but is subject to the same rejoinders. Studies indicate that most LDCs have carried import substitution to the point where gains to local industrialists are less than losses to consumers, merchants, inputs buyers, and taxpayers. Indeed, India, which emphasized import substitution, generated self-reliant but socially wasteful technology that would have been written off in a more competitive environment (Lall 1985:18).
Research done by the National Bureau of Economic Research (NBER) of 15 LDCs (Krueger 1978; Krueger, Lary, Monson, and Akrasanee 1981) indicate that export promotion is generally more effective than highly protected import substitution in expanding output and employment. NBER empirical data confirm the Heckscher– Ohlin theorem, in which LDCs in early stages of growth are most likely to have
17. International Trade |
613 |
a comparative advantage in exporting labor-intensive goods and importing capitalor skilled-labor-intensive commodities. A strategy that substitutes domestic output for imports, then, emphasizes the production of goods more likely to use considerably more capital per unit of labor. Export promotion includes the following advantages: (1) international competition, which encourages quality control, new products and techniques, and good management, (2) cost economies from increased market size, (3) information provided by DC users can improve export technology and product quality, (4) cost to society is more visible than protection, and (5) efficient firms are not limited by domestic demand growth. Export promotion relies on pricing incentives, such as market exchange rates, export subsidies, and concessional credit, which provide a uniform bias among export activities (Fransman 1986: 75–93).
As an example, during most of the 1980s, Mexico provided incentives for import substitutes and implicitly discouraged export development. South Korea, by contrast, provided virtually no incentives for import substitution while heavily encouraging export activity through capital subsidies, depreciation allowances, and import duty exemptions. From 1980 to 1992, Mexico’s real annual growth rates were 1.6 percent in industry and −0.2 percent overall, compared with Korea’s 11.6 and 8.5 percents – spurred by scale economies, international competition, price flexibility, and no agricultural and foreign exchange shortages associated with export promotion (Krueger 1978; Krueger, Lary, Monson, and Akrasanee 1981; World Bank 1994i:162–65). Deepak Lal’s and Sarath Rajapatirana’s later study (1987:189–217) comparing the four export-promoting NICs (Taiwan, South Korea, Hong Kong, and Singapore) to moderately import-substituting Southern-Cone countries (Argentina, Chile, and Uruguay) and Sri Lanka reinforce the NBER findings for the 1970s and 1980s, when the NICs not only grew more rapidly but also recovered more quickly from the shocks of oil price rises and world recession. Chow’s econometrics (1987:155–163) demonstrates that export growth promotes both industrial and overall economic growth in the NICs.
Even for a highly populated country like India, import substitution industrialization is limited, because of “narrow domestic markets, high costs and technological backwardness. . . . As witnessed in East Asia, . . . exports facilitated learning through economies of scale and increasing returns, while foreign markets became a source for knowledge acquisition” (D’Costa 2003b:3). After decades of lost opportunity for export expansion, India, which only stressed international competitiveness since the early 1990s, is still years behind most Asian nations.
The transition from import replacements to export expansion (and free trade) is difficult. It takes time to expand capacity, reallocate resources, acquire physical inputs, develop skills, upgrade procedures, and learn by doing before new competitive export industries based on comparative advantage can emerge. We can expect export expansion to be slow, as most potential exporters have to produce for a domestic market first (Linder 1961; Preusse 1988:883–897).
Inward-looking policies have been costly to LDCs, increasing their dependence on just a few exports and on the protection and monopoly power of foreign capital.

614 Part Four. The Macroeconomics and International Economics of Development
TABLE 17-3. Tariffs Hurt Exports – but Less so in the 1990s Than in the 1980s Cost Penalties on Exports Associated with Import Tariffs (percent)
|
Brazil |
|
China |
India |
|
Malawi |
|||||||
|
|
|
|
|
|
|
|
|
|
|
|
|
|
|
1986 |
1997 |
1986 |
1997 |
1986 |
1997 |
1986 |
1997 |
|||||
|
|
|
|
|
|
|
|
|
|
||||
Agriculture |
−43 |
−5 |
−28 |
−15 |
−14 |
−5 |
|
−9 |
−7 |
||||
Agricultural |
−83 |
−28 |
−72 |
−54 |
−64 |
−39 |
−20 |
−16 |
|||||
processing |
−45 |
−6 |
−14 |
−7 |
−9 |
−3 |
|
−6 |
−5 |
||||
Resources |
|
||||||||||||
Labor-intensive |
−72 |
−17 |
−54 |
−35 |
−45 |
−23 |
−18 |
−15 |
|||||
manufacturing |
−79 |
−22 |
−46 |
−28 |
−60 |
−35 |
−11 |
−9 |
|||||
Capital-intensive |
|||||||||||||
manufacturing |
−31 |
−3 |
−26 |
−14 |
−16 |
−6 |
|
−5 |
−4 |
||||
Services |
|
||||||||||||
Note: Effective rate of protection applying to exporters is the proportional change in returns to valueadding factors resulting from tariff protection.
Source: World Bank 2004f:77.
Moreover, protection reduces the domestic-currency price (peso or shilling) of foreign exchange, thus discouraging exporters. Import restrictions increase local demand for import-competing sectors’ production and use of domestic resources, increasing the price of domestic inputs and foreign-exchange (dollar) price of domestic currency, thus reducing exports.
Table 17-3 shows the gains to LDCs from reduced protection and lower cost penalties on exports, from the 1980s to the 1990s and early years of the 21st century. World Bank (2004f:77) data show how declining tariffs by Brazil, China, India, and Malawi in the 1990s reduced input prices for exports and also prevented the price of foreign exchange from staying too low, at an overvalued rate that discouraged exports.
DeRosa (1991:42–45) argues that this fall in exports matches the protectioninduced fall in imports in the sub-Sahara. In the 1980s, the mean tariff, customs surcharge, surtax, and stamp tax, other fiscal charges, and taxes on foreign-exchange transactions in sub-Saharan countries were 33 percent of value. Because nontariff barriers (quantitative restrictions, foreign-exchange restrictions, minimum price systems, and state trading monopolies) affect 81 percent of tariff line items, the total protective and exchange-rate distortions caused by the sub-Sahara’s import barriers were substantial. DeRosa estimates that sub-Saharan Africa loses 15–32 percent of its potential export revenue because of import protection. Emphases on export expansion activities have the following advantages: (1) competitive pressures tend to improve quality and reduce costs, (2) information provided by DC users can improve export technology and product quality, (3) cost economies develop from increased market size, and (4) increased imports of productive inputs result from the greater availability of foreign-exchange earnings (Fransman 1986:75–93).
17. International Trade |
615 |
The next section shows how much industrialization via global production sharing has increased in LDCs reducing their tariffs. However, LDCs at the periphera of this globalization, most in sub-Saharan Africa, are still in a rut, having made few policy changes to increase their competitiveness and their attractiveness for foreign direct investment.
Global Production Sharing and Borderless Economies
A continuing theme in the old development textbooks was that LDCs are exporters of primary goods and importers of manufactures. This view is outdated for most LDCs, but not for 20 poor export performers whose real exports fell from 1981 to 2001 (World Bank 2004f:69). The 20 were primarily from Africa and Central America, heavily dependent on one or two primary products, and with high export commodity concentration ratios (see Chapter 4).
For most LDCs, however, the situation has drastically changed since the 1980s, with low-income countries’ manufacturing exports as a percentage of total exports rising from about 20 percent in 1981 to almost 80 percent in 2001, and from 24 percent in 1981 to almost 70 percent for middle-income countries (Figure 17-2). Even without China and India, the rise in manufactures is substantial. The most dynamic export growth in all regions, including Africa, has been in labor-intensive manufacturers (World Bank 2004f:xiv).
A major explanation for the manufacturing export expansion is the reduction in protection, especially in industries a part of a global production network. Reduced LDC protection, especially on inputs and resources, has allowed a number of LDCs to move up the value-added ladder, with low-income countries expanding their exports of low technology exports and middle-income countries’ exports increasing in the level of their technology (World Bank 2004f:65–73).
In Chapter 15, we discussed the role of multinational corporations in an integrated global economy. Although Pakistan, Bangladesh, Burma, Laos, Cambodia, and most of sub-Saharan Africa (Figure 17-3) have received only minimal benefits from this integration, a number of East and Southeast Asian economies and, since the 1990s, India are integrated into MNC production shifts in the product cycle. The rapid growth in international trade and FDI has reflected the expansion of global production networks (GPNs), the major factor contributing to LDCs’ moving up the value-added ladder. A significant percentage of international trade and foreign investment has shifted from the production and exchange of final consumer goods to the production and exchange of parts and components, making it difficulty to identify the nationality of many products. Figure 17-4 indicates the proportion of countries’ value added in producing a U.S. automobile. Compared to 1921, when Henry Ford’s Model T was produced with one assembly line, and the 1950s, when virtually all components of a U.S. automobile were produced within the country, in 1998, the U.S. comprises only 37 percent of the car’s value added (World Bank 2003f:55; World Bank 2004f:66–69). Even during the early 1990s, a Pontiac Le Mans bought in the United States embodied routine labor and assembly operations in South Korea,