

7.Specifications
.pdf7
Specifications
7.1 Introduction
In this chapter we will discuss how the properties of a control system can be specified. This is important for control design because it gives the goals. It is also important for users of control so that they know how to specify, evaluate and test a system so that they know it will have the desired properties. Specifications on a control systems typically include: stability of the closed loop system, robustness to model uncertainty, attenuation of measurement noise, injection of measurement noise, and ability to follow reference signals. From the results of Chapter 5 it follows that these properties are captured by six transfer functions called the Gang of Six. The specifications can be expressed in terms of these transfer functions. Essential features of the transfer functions can be expressed in terms of their poles and zeros or features of time and frequency responses.
7.2 Stability and Robustness to Process Variations
Stability and robustness to process uncertainties can be expressed in terms of the loop transfer function L PC, the sensitivity function and the complementary sensitivity function
|
1 |
|
1 |
|
|
PC |
|
L |
|
S |
|
|
|
, |
T |
|
|
|
. |
1 PC |
1 L |
1 PC |
1 L |
||||||
Since both S and T are functions of the loop transfer function specifications on the sensitivities can also be expressed in terms of specifications on the loop transfer function L. Many of the criteria are based on Nyquist's
252

7.2Stability and Robustness to Process Variations
Figure 7.1 Nyquist curve of the loop transfer function L with indication of gain, phase and stability margins.
stability criterion, see Figure 7.1. Common criteria are the maximum values of the sensitivity functions, i.e.
s |
ω h |
D |
Eh |
t |
ω h |
D |
iω |
Eh |
M |
max |
S |
iω , |
M |
max |
T |
|
Recall that the number 1/Ms is the shortest distance of the Nyquist curve of the loop transfer function to the critical point, see Figure 7.1. Also recall that the closed loop system will remain stable for process perturbations
P provided that
h PDiω Eh |
|
1 |
, |
|
hPDiω Eh |
|
hTDiω Eh |
|
|
see Section 5.5. The largest value Mt of the complementary sensitivity function T is therefore a simple measure of robustness to process variations.
Typical values of the maximum sensitivities are in the range of 1 to 2. Values close to one are more conservative and values close to 2 correspond to more aggressive controllers.
Gain and Phase Margins
The gain margin nm and the phase margin ϕm are classical stability criteria. Although they can be replaced by the maximum sensitivities it is useful to know about them because they are still often used practically.
253

Chapter 7. Specifications
The gain margin tells how much the gain has to be increased before the closed loop system becomes unstable and the phase margin tells how much the phase lag has to be increased to make the closed loop system unstable.
The gain margin can be defined as follows. Let ω 180 be the lowest frequency where the phase lag of the loop transfer function LDsE is 180'. The gain margin is then
nm |
1 |
D7.1E |
hLDiω 180Eh |
The phase margin can be defined as follows. Let ω nc denote gain crossover frequency, i.e. the lowest frequency where the loop transfer function LDsE has unit magnitude. The phase margin is then given by
ϕm π arg LDiω ncE |
D7.2E |
The margins have simple geometric interpretations in the Nyquist diagram of the loop transfer function as is shown in Figure 7.1. Notice that an increase of controller gain simply expands the Nyquist curve radially. An increase of the phase of the controller twists the Nyquist curve clockwise, see Figure 7.1.
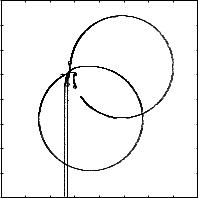
Reasonable values of the margins are phase margin ϕm 30' − 60', gain margin nm 2 − 5. Since it is necessary to specify both margins to have a guarantee of a reasonable robustness the margins nm and ϕm can be replaced by a single stability margin, defined as the shortest distance of the Nyquist curve to the critical point −1, this distance is the inverse of the maximum sensitivity Ms. It follows from Figure 7.1 that both the gain margin and the phase margin must be specified in order to ensure that the Nyquist curve is far from the critical point. It is possible to have a system with a good gain margin and a poor phase margin and vice versa. It is also possible to have a system with good gain and phase margins which has a poor stability margin. The Nyquist curve of the loop transfer function of such a system is shown in Figure 7.2. This system has infinite gain margin, a phase margin of 70' which looks very reassuring, but the maximum sensitivity is Ms 3.7 which is much too high. Since it is necessary to specify both the gain margin and the phase margin to endure robustness of a system it is advantageous to replace them by a single number. A simple analysis of the Nyquist curve shows that the following inequalities hold.
nm |
|
Ms |
|
|
|
|
Ms − 1 |
|
1 |
7.3 |
|
φm |
2 arcsin |
D E |
|||
2Ms |
|
||||
254

7.2Stability and Robustness to Process Variations
Figure 7.2 Nyquist curve of the loop transfer function for a system with good gain
and phase margins but with high sensitivity and poor robustness. The loop transfer
0.38Ds2 0.1s 0.55E function is LDsE sDs 1EDs2 0.06s 0.5 .
A controller with Ms 2 thus has a gain margin of at least 2 and a phase margin of at least 30'. With Ms 1.4 the margins are nm 3.5 and φm 45'.
Delay Margin
The gain and phase margins were originally developed for the case when the Nyquist curve only intersects the unit circle and the negative real axis once. For more complicated systems there may be many intersections and it is more complicated to find suitable concepts that capture the idea of a stability margin. One illustration if given in Figure 7.3. In this case the Nyquist curve has a large loop and the Nyquist curve intersects the circle hLh 1 in three points corresponding to the frequencies 0.21, 0.88 and 1.1. If there are variations in the time delay the Nyquist curve can easily enclose the critical point. In the figure it is shown what happens when the time delay is increased from 3 to 4.5 s. This increase corresponds to a phase lag of 0.3 rad at the crossover frequency 0.21 rad/s, the phase lag is however 1.6 rad at the frequency 1.1 rad/s which is marked A in the figures. Notice that the point A becomes very close to the critical point. A good measure of the stability margin in this case is the delay margin which is the smallest time delay required to make the system unstable. For loop transfer functions that decay quickly the delay margin is closely related to the phase margin but for systems where the amplitude ratio of
255
Chapter 7. Specifications
y
6
4
2
0
 A
A
−2
−4
−6
−8
−10 |
−4 |
−2 |
0 |
2 |
4 |
6 |
8 |
10 |
−6 |
x
Figure 7.3 Nyquist curve of the loop transfer function L |
D |
s |
E |
0.2 |
|
e−3s. |
|
sDs2 0.025s 1E |
|||||||
|
|
|
|||||
the loop transfer function has several peaks at high frequencies the delay margin is a much more relevant measure.
7.3 Disturbances
In the standard system, Figure 5.1, we have used in this book there are two types of disturbances, the load disturbances that drive the system away from its desired behavior and the measurement noise that corrupts the information about the process obtained by the sensors.
Response to Load Disturbances
The response of the process variable to a load disturbance is given by the transfer function
Gxd |
P |
PS |
T |
D7.4E |
1 PC |
C |
Since load disturbances typically have low frequencies it is natural that the specifications should emphasize the behavior of the transfer function at low frequencies. The loop transfer function L PC is typically large for small s and we have the approximation
Gxd |
T |
|
1 |
. |
D7.5E |
C |
C |
256
7.3 Disturbances
100 |
|
|
|
10−1 |
|
|
|
10−2 |
|
|
|
10−2 |
10−1 |
100 |
101 |
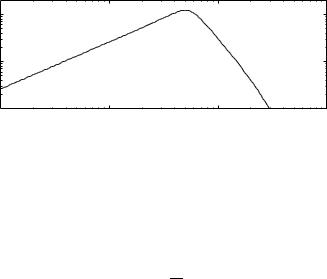
Figure 7.4 Typical gain curve for the transfer function Gxd from load disturbance to process output. The gain curve is shown in full lines and the transfer function ki/s in dotted lines and the process transfer function in full lines.
If PD0E 0 and the controller with integral action control we have the following approximation for small s
s
Gxd ki .
Since load disturbances typically have low frequencies this equation implies that integral gain ki is a good measure of load disturbance attenuation. Figure 7.4 shows the magnitude curve of the transfer function D7.4E for a PI control of the process P Ds 1E−4. The transfer function Gxd has typically the form shown in Figure 7.4. The curve can typically be characterized by the low frequency asymptote DkiE, the peak DMxdE, the frequency Dω xdEwhere the peak occurs and the high frequency rolloff. It follows from D7.4E that the high frequency behavior is essentially determined by the process and the maximum sensitivity.
Attenuation of load disturbances can also be characterized in the time domain by showing the time response due to a representative disturbance. This is illustrated in 7.5 which shows the response of the process output to a unit step disturbance at the process input. The figure shows maximum error emax, the steady state error ess, the error of the open loop system eol, the time to maximum tmax and the settling time ts.
Measurement Noise
An inevitable consequence of using feedback is that measurement noise is fed into the system. Measurement noise thus causes control actions which in turn generate variations in the process variable. It is important to keep these variations of the control signal at reasonable levels. A typical requirement is that the variations are only a fraction of the span of the control signal. The variations in the control variable are also detrimental
257

Chapter 7. |
Specifications |
Figure 7.5 Errors due to a unit step load disturbance at the process input and some features used to characterize attenuation of load disturbances. The curves show the open-loop error Ddashed linesE and the error Dfull linesE obtained using a controller without integral action DupperE and with integral action DlowerE.
by themselves because they cause wear of actuators. Since measurement noise typically has high frequencies the high high frequency gain of the controller is a relevant measure. Notice however that the low frequency gain of the controller is not essential since measurement noise is high frequency. Frequencies above the gain crossover frequency will be regarded as high.
To get a feel for the orders of magnitude consider an analog system where the signal levels are 10V. A measurement noise of 1 mV then saturates the input if the gain is 104. If it is only permitted that measurement noise gives control signals of 1V the high frequency gain of the controller must be less than 103.
As an other illustration we consider a digital control system with 12 bit ADand DA-converters. A change of the input of one bit saturates the DA-converter if the gain is 4096. Assume that we permit one bit to give a variation of 0.4% of the output range. The high frequency gain of the controller must then be less than 500. With converters having lower resolution the high frequency gain would be even lower.
High precision analog systems with signal ranges of 1 to 104 have been
258
7.4 Reference Signals
designed. For digital systems the signal ranges are limited by the sensors and the actuators. Special system architectures with sensors and actuators having multiple signal ranges are used in order to obtain systems with a very high signal resolution. In these cases it is possible to have signal ranges up to 1 to 106.
The effects of measurement noise can be evaluated by the transfer function from measurement noise to the control signal, i.e.,
|
C |
|
T |
|
|
Gun |
|
CS |
|
. |
D7.6E |
1 PC |
P |
||||
Recall that P and C and are the transfer functions of the process and the controller, and that S is the sensitivity function. Notice that when L PC is large we have approximately Gun 1/C. Since measurement noise typically has high frequencies and since the sensitivity function is one for high frequencies we find that the response to measurement noise is essentially determined by the high frequency behavior of the transfer function C. A simple measure is given by
c |
ω ω nc h |
G |
unD |
iω |
Eh |
s ω ω nc h |
D |
iω |
Eh |
M |
max |
|
|
M max |
C |
|
where Mc is called the maximum high frequency gain of the controller. When there is severe measurement noise it is advantageous to make sure that the transfer function C goes to zero for large frequencies. This is called high frequency roll-off.
7.4 Reference Signals
The response to set point changes is described by the transfer functions
Gyr |
FPC |
FT, |
Gur |
FC |
FCS |
1 PC |
1 PC |
Compare with D5.1E. A significant advantage with controller structure with two degrees of freedom is that the problem of set point response can be decoupled from the response to load disturbances and measurement noise. The design procedure can then be divided into two independent steps.
∙First design the feedback controller C that reduces the effects of load disturbances and the sensitivity to process variations without introducing too much measurement noise into the system
259

Chapter 7. |
Specifications |
|
|
|
|
|
|
|
1.2 |
|
|
|
|
|
|
|
|
1 |
|
|
|
|
|
|
|
|
0.8 |
|
|
|
|
|
|
|
|
0.6 |
|
|
|
|
|
|
|
|
0.4 |
|
|
|
|
|
|
|
|
0.2 |
|
|
|
|
|
|
|
|
0 |
2 |
4 |
6 |
8 |
10 |
12 |
14 |
16 |
0 |
||||||||
3 |
|
|
|
|
|
|
|
|
|
|
2.5 |
|
|
|
|
|
|
|
|
|
|
2 |
|
|
|
|
|
|
|
|
|
|
1.5 |
|
|
|
|
|
|
|
|
|
|
1 |
|
|
|
|
|
|
|
|
|
|
0.5 |
|
|
|
|
|
|
|
|
|
|
0 |
|
|
|
|
|
|
|
|
|
|
−0.5 |
2 |
4 |
6 |
8 |
10 |
12 |
14 |
16 |
18 |
20 |
0 |
Figure 7.6 Specifications on reference following based on the time response to a unit step in the reference.
∙Then design the feedforward F to give the desired response to set points.
Specifications on reference following are typically expressed in the time domain. They may include requirements on rise time, settling time, decay ratio, overshoot, and steady-state offset for step changes in reference. These quantities are defined as follows, see 7.6. These quantities are defined in different ways and there are also different standards.
∙The rise time tr is either defined as the inverse of the largest slope of the step response or the time it takes the step to pass from 10% to 90% of its steady state value.
∙The settling time ts is the time it takes before the step response remains within p percent of its steady state value. The value p 2 % is commonly used.
∙The delay time is the time required for the step response to reach 50 % of its steady state value for the first time.
∙The decay ratio d is the ratio between two consecutive maxima of the error for a step change in reference or load. The value d 1/4, which
260

7.4 Reference Signals
is called quarter amplitude damping, has been used traditionally. This value is, however, too high as will be shown later.
∙The overshoot o is the ratio between the difference between the first peak and the steady state value and the steady state value of the step response. In industrial control applications it is common to specify an overshoot of 8%–10%. In many situations it is desirable, however, to have an over-damped response with no overshoot.
∙The steady-state error ess is the value of control error e in steady state. With integral action in the controller, the steady-state error is always zero.
Classical specifications have been strongly focused on the behavior of the process output. It is however important to also consider the control signal. Analogous quantities can be defined for the control signal. The overshoot of the control signal is of particular importance, see Figure 7.4.
Step signals are often used as reference inputs In motion control systems it is often more relevant to consider responses to ramp signals or jerk signals. Specifications are often given in terms of the the value of the first non-vanishing error coefficient.
Tracking Slowly Varying Signals - Error Coefficients
Step signals is one prototype of reference signals. There are however situations when other signals are more appropriate. One example is when the reference signal has constant rate of change, i.e.
rDtE v0t
The corresponding Laplace transform is RDsE v0/s2.
For a system with error feedback the error e r − y has the Laplace
transform |
|
EDsE SDsEV DsE SDsEvs20 |
D7.7E |
The steady state error obtained depends on the properties of the sensitivity function at the origin. If SD0E e0 the steady state tracking error is asymptotically eDtE v0 e0t. To have a constant tracking error it must be required that SD0E 0. With SDsE e1s for small s we find that the steady state error is eDtE v0 e1 as t goes to infinity. To have zero steady state error for a ramp signal the function SDsE must go to zero faster than s for small s. If SDsE e2s2 for small s we find that the error is asymptotically
zero. Since
LDsE S1DsE − 1
261