

BenHajji F.3D graphical user interfaces.1999
.pdf3D Graphical User Interfaces
Farid BenHajji
Erik Dybner
Department of Computer and Systems Sciences
Stockholm University and
The Royal Institute of Technology
July 1999
ABSTRACT
Human-computer interaction currently faces the challenge of taking advantage of new technologies, which efficiently use the capabilities of the computing systems of today and more effectively match human capabilities and perception.
We investigate how 3D Graphical User Interfaces (GUI) can be useful in software applications of today and identify general areas where 3D technologies can be more useful than other technologies. This paper consists of a survey of 3D standards, GUIs and in particular 3D GUIs. A 3D GUI prototype based on applications of ABB Network Partner AB is described.
There are several possible advantages using 3D graphics. Interesting aspects are the possibilities of natural, intuitive navigation and interaction with computer systems. However, there are a couple of problems. The lack of commonly accepted standards for 3D interfaces e.g. widgets and graphic formats is one of them.1
Keywords
Human-Computer Interaction (HCI), Three-dimensional (3D), Graphical User Interface (GUI)
1 This thesis corresponds to 20 full-time working weeks per author.
|
|
Table of Contents |
1 INTRODUCTION ........................................................................................................................................ |
1 |
|
1.1 |
BACKGROUND ............................................................................................................................................ |
1 |
1.2 |
EMPLOYER ................................................................................................................................................. |
1 |
1.3 |
PURPOSE .................................................................................................................................................... |
1 |
1.4 |
METHODOLOGY.......................................................................................................................................... |
1 |
1.5 |
RESPONSIBILITIES ....................................................................................................................................... |
2 |
1.6 |
STRUCTURE OF THE THESIS ........................................................................................................................ |
2 |
1.7 |
ACKNOWLEDGEMENTS ............................................................................................................................... |
2 |
2 COGNITIVE ASPECTS ON USER INTERFACE DESIGN ................................................................... |
3 |
|
2.1 |
NAVIGATION............................................................................................................................................... |
3 |
2.1.1 |
Cognitive Maps ................................................................................................................................ |
3 |
2.1.2 |
Spatial Ability .................................................................................................................................. |
4 |
2.2 |
INTERACTION ............................................................................................................................................. |
4 |
2.2.1 |
Attention........................................................................................................................................... |
4 |
2.2.2 |
Affordances ...................................................................................................................................... |
4 |
2.2.3 |
Abstraction....................................................................................................................................... |
5 |
3 INTRODUCTION TO USER INTERFACES ........................................................................................... |
6 |
|
3.1 |
CHARACTER-BASED INTERFACES............................................................................................................... |
6 |
3.2 |
2D GRAPHICAL USER INTERFACES............................................................................................................. |
6 |
3.2.1 |
Desktop Metaphor............................................................................................................................ |
7 |
3.2.2 |
Interface Components ...................................................................................................................... |
7 |
4 3D GRAPHICAL USER INTERFACES.................................................................................................... |
8 |
|
4.1 |
PERCEPTION OF DEPTH ............................................................................................................................... |
8 |
4.1.1 |
Monocular Depth Cues ........................................................................................................ |
............ 8 |
4.1.2 |
Binocular Depth Cues........................................................................................................ |
.............. 9 |
4.2 |
INTERFACE COMPONENTS ......................................................................................................................... |
10 |
4.3 |
INPUT DEVICES......................................................................................................................................... |
12 |
4.4 |
OUTPUT DEVICES ..................................................................................................................................... |
13 |
4.5 |
VIRTUAL REALITY .................................................................................................................................... |
14 |
5 APPLICATION AREAS FOR 3D GRAPHICAL USER INTERFACES ............................................. |
16 |
|
5.1 |
INFORMATION VISUALISATION ................................................................................................................. |
16 |
5.2 |
SIMULATION ............................................................................................................................................. |
17 |
5.2.1 |
Virtual Wind Tunnel....................................................................................................................... |
17 |
5.2.2 |
Flight Simulator ............................................................................................................................. |
17 |
5.3 |
COMPUTER AIDED DESIGN ....................................................................................................................... |
18 |
5.4 |
COMPUTER SUPPORTED COOPERATIVE WORK ......................................................................................... |
19 |
5.5 |
ENTERTAINMENT...................................................................................................................................... |
20 |
5.6 |
MARKETING ............................................................................................................................................. |
20 |
6 OVERVIEW OF 3D GRAPHICS STANDARDS.................................................................................... |
21 |
|
6.1 |
OPENGL................................................................................................................................................... |
21 |
6.1.1 |
Introduction ................................................................................................................................... |
21 |
6.1.2 |
History ........................................................................................................................................... |
21 |
6.1.3 |
Design ............................................................................................................................................ |
22 |
6.1.4 |
Architecture.................................................................................................................................... |
23 |
6.1.5 |
Application Programming Interface Specification ........................................................................ |
23 |
6.1.6 |
Libraries on top of OpenGL........................................................................................................... |
23 |
6.1.7 |
Applications ................................................................................................................................... |
24 |
6.2 |
VIRTUAL REALITY MODELLING LANGUAGE ............................................................................................. |
24 |
6.2.1 |
Introduction ................................................................................................................................... |
24 |
6.2.2 |
History ........................................................................................................................................... |
25 |
6.2.3 |
Design ............................................................................................................................................ |
25 |
6.2.4 |
Presentation and Interaction ......................................................................................................... |
26 |
6.2.5 |
External Authoring Interface ......................................................................................................... |
26 |
6.2.6 |
Problems ........................................................................................................................................ |
27 |
I
|
|
|
Table of Contents |
|
6.2.7 |
Future............................................................................................................................................. |
28 |
6.3 |
CONCLUSION ............................................................................................................................................ |
28 |
|
7 COMPARISON OF 2D AND 3D GRAPHICAL USER INTERFACES ............................................... |
29 |
||
7.1 |
NAVIGATION............................................................................................................................................. |
29 |
|
|
7.1.1 |
Cognitive Maps .............................................................................................................................. |
29 |
|
7.1.2 |
Spatial Ability ................................................................................................................................ |
29 |
|
7.1.3 |
Motion Sickness ............................................................................................................................. |
29 |
7.2 |
INTERACTION ........................................................................................................................................... |
30 |
|
|
7.2.1 |
Attention......................................................................................................................................... |
30 |
|
7.2.2 |
Affordance...................................................................................................................................... |
30 |
|
7.2.3 |
Abstraction..................................................................................................................................... |
30 |
|
7.2.4 |
Input and Output............................................................................................................................ |
31 |
7.3 |
DISCUSSION.............................................................................................................................................. |
31 |
|
8 |
ANALYSIS.................................................................................................................................................. |
32 |
|
8.1 |
CURRENT SITUATION................................................................................................................................ |
32 |
|
8.2 |
DESIRED SITUATION ................................................................................................................................. |
32 |
|
|
8.2.1 |
Information Visualisation .............................................................................................................. |
33 |
|
8.2.2 |
Attractiveness ................................................................................................................................. |
33 |
8.3 |
NEW USER INTERFACE DESIGN ................................................................................................................ |
33 |
|
|
8.3.1 |
Navigation...................................................................................................................................... |
33 |
|
8.3.2 |
Interaction...................................................................................................................................... |
35 |
8.4 |
SYSTEM ARCHITECTURE .......................................................................................................................... |
36 |
|
9 |
SUMMARY ................................................................................................................................................ |
37 |
|
BIBLIOGRAPHY ................................................................................................................................................ |
38 |
||
APPENDIX A....................................................................................................................................................... |
41 |
||
APPENDIX B ....................................................................................................................................................... |
46 |
||
II
1 Introduction
This chapter gives the reader the background and purpose of the thesis and describes our methodology
1.1 Background
The rapid development of computer hardand software has caused significant changes in the way users interact with computers. We have seen a development from the early stages with character based interfaces to modern Graphical User Interfaces (GUI) of today.
The Windows, Icons, Menus, and Pointer (WIMP) interface paradigm dominates the computing systems of today, these interaction techniques were originally developed for machines that are now 10 or nearly 20 years old. Human-computer interaction (HCI) currently faces the challenge of evolving past the WIMP plateau and taking advantage of new technologies, which efficiently use the capabilities of the computing systems of today and more effectively match human capabilities and perception.
Until recently, Three Dimensional (3D) graphics were primarily used in specialised domains such as Computer Aided Design (CAD) and flight simulators. Due to the increasing performance of new computer hardware, in combination with state-of-the-art interactive 3D computer games, e.g., the category of “Doom”-like games [Lampton 1994], there has been a rapid growth in interest for real-time 3D graphics [Mullet et al 1995].
1.2 Employer
Asea Brown Boveri (ABB) is a Swedish/Swiss industrial enterprise and a market leader in producing power stations, power transmissions, and power transport. It is also active in other areas of industry. ABB Network Partner AB is a subsidiary that among other things produce information management systems and protection and control terminals for power stations.
ABB Network Partner AB is like many other companies, very interested in how 3D graphics technologies can be applied to improve their processes and products.
1.3 Purpose
The purpose of the thesis is twofold: to conduct a survey of 3D GUIs from a cognitive perspective and to investigate how to implement 3D GUIs.
We will therefore investigate what the term 3D GUI implies and identify current application areas. Further, we will discuss how 3D GUIs can be applied to improve company processes and products.
To accomplish our second goal we will study 3D graphics standards in order to investigate what it takes to implement 3D GUIs. Finally, we intend to implement a prototype to show how ABB Network Partner can take advantage of 3D GUIs in their applications, which will be our main contribution to the field.
1.4 Methodology
Our work consists of a survey of GUIs and in particular 3D GUIs. There are several papers in this area of research on which we have based our results. Many of these papers are only available on the Internet due to this being a newly developed research area. The parts of the
1
thesis covering 3D standards are based on studies of the reference literature of the standards and our own experience of using them. Finally we have studied the user interface of different ABB Network Partner AB applications, for which we have constructed a 3D GUI prototype, to show how their products can be improved by 3D.
1.5 Responsibilities
The contents of chapter 2, chapter 5, chapter 7 and chapter 8 are under the responsibility of Farid BenHajji, and the contents of chapter 3, chapter 4, chapter 6, and chapter 9 are under the responsibility of Erik Dybner. We have thoroughly discussed and jointly developed all parts of the thesis.
1.6 Structure of the Thesis
We start off in chapter 2 by describing the cognitive aspects on user interface design. In chapter 3 we will give a brief introduction to user interfaces and in chapter 4 an introduction to 3D graphical user interfaces. Chapter 5 is a survey of application areas for 3D Graphical User Interfaces followed by chapter 6 wich gives an overview of 3D graphics standards. Chapter 7 includes a comparison of 2D and 3D graphical user interfaces based on the cognitive aspects introduced in chapter 2. Chapter 8 describes the current and wanted situation for the user interfaces of the applications of ABB Network Partner which leads to a description of a new user interface. Finally chapter 9 sums up the thesis.
1.7 Acknowledgements
This thesis originated from a commission given by ABB Network Partner AB.
We would like to thank our supervisor at DSV and ABB Network Partner AB, Johan Kummeneje. We would also like to thank Jan Bystedt who was kind enough to help proof read this thesis.
2
2 Cognitive Aspects on User Interface Design
User interface design is an interdisciplinary activity in which research from the field of psychology can be of great use. An understanding of how humans perceive and interact with their environment can contribute to the design of more intuitive user interfaces. Therefore, this chapter is a short introduction to some cognitive aspects of navigation and interaction.
2.1 Navigation
Navigation is the process by which people control their movements using environmental cues and artificial aids such as maps so that they can reach their goals without getting lost. A major problem for users in all forms of navigation is how to maintain knowledge of their location and orientation while moving through space.
Important aspects when discussing navigation in computer systems are cognitive maps and spatial abilities. [Darken and Sibert 1993] have shown that people use physical world wayfinding strategies in large virtual worlds, i.e. cognitive maps for navigational aid. According to [Höök and Dahlbäck 1997] individual differences in spatial abilities affect users' ability to navigate in computer systems.
2.1.1Cognitive Maps
Birds has often proven to be superior navigators during migration and although research has not produced definitive answers, there exists evidence that indicates the use of advanced perceptual abilities to detect and encode environmental cues [Darken and Sibert 1993].
It is believed that birds use a landmarking technique in which a cognitive map is created [Darken and Sibert 1993]. Landmarks on this map may be visual, acoustic, or olfactory. Resources such as shelter and water is encoded along with information concerning the shortest and safest paths between points. Increased altitude enables spatial relationships to be refined since more landmarks can be seen simultaneously, but it also decreases the strength of the stimuli.
In similarity with birds humans are also thought to form cognitive maps of their environments for use in navigation, using a set of generic components such as paths, edges, landmarks, nodes, and districts. According to [Darken and Sibert 1993]they include:
∙Paths: linear separators, walkways and passages.
∙Edges: linear separators, walls or fences.
∙Landmarks: objects that are in sharp contrast to their immediate surroundings, such as a church spire.
∙Nodes: sections of the environment with similar characteristics. For example, a group of streets with the same type of light posts.
∙Districts: logically and physically distinct sections.
According to [Chen and Czerwinski 1998] simply adding cues like borders, boundaries, and gridlines in a user interface significantly improve navigation performance.
3
2.1.2Spatial Ability
It has been shown that users’ spatial ability is relevant to their ability to make use of computer systems. There exists enough knowledge of individual differences and navigation to say that these are important and significant [Höök and Dahlbäck 1997].
When discussing spatial ability three various dimensions are commonly addressed [Satalich 1995]. They are spatial orientation, spatial visualisation, and spatial relations. Spatial orientation involves the ability to mentally move or transform stimuli, while retaining their relationships. It also involves the mental manipulation of an object using oneself as a reference. Spatial visualisation goes further, in that the person can manipulate the relationships within an object. Finally, spatial relations, consists of the ability to imagine how an object will align from different perspectives.
In [Höök and Dahlbäck 1997] it is concluded that spatial ability affects user ability to navigate large file structures. Similar results are also found concerning navigation in hypermedia, i.e. a collection of non-linear text-based nodes that are linked together. The best user was almost 20 times faster than the slowest in using such a system to solve six problems.
2.2 Interaction
Interaction deals with how humans exchange information with the environment, typically why we choose to focus on certain elements (attention), how we know what we can do with these elements (affordances) and how we filter redundant information (abstraction).
2.2.1Attention
The attention of humans is among other things attracted to differences in visual appearance, e.g. colour, shape, texture, shading, size, location, and the ability to register movement [Wiss and Carr 1998].
The location of an object also determines the amount of attention we give to it. Objects located in the centre of the visualisation tend to get more attention than peripheral objects. Also, if our attention is focused on something particular, elements close to this will get more attention than elements further away. Another thing is our ability to register movement, which among other things makes blinking objects catch our eyes, making it difficult to concentrate on other things. This ability is inherited from our ancestors for whom it was very important to notice movement that could be either danger or potential food in their environment [Smith 1993].
2.2.2Affordances
Affordance refers to the perceived and actual properties of the things, primarily those fundamental properties that determine just how things can possibly be used [Norman 1988]. In other words, affordance is the cues that an object gives to explain what can be done with it. A button affords pushing, a knob affords turning, and a ball affords bouncing or throwing. What the object affords to a person relates to that person’s current mental model, cultural aspects, etc.
A psychology of causality is also at work as we interact with the environment, meaning that the perceived result of an action appears to be caused by a particular action. The failure and the action may very well be related only through a coincident. This kind of false causality may occur in user interfaces due to poor design [Norman 1988].
4
2.2.3Abstraction
The amount of data that flow through the human senses is so large that we are forced to filter much of it, in order to focus on elements that we consider being important. The problem is that filtering removes global context and may leave us disoriented. One solution to retain global context is to organise the data that we do retain in ways that promote understanding at the expense of detail. Abstraction implies a many-to-one transformation between the possible variants of a feature to a single invariant form. This can be illustrated by the gestalt law of perception [Smith 1993].
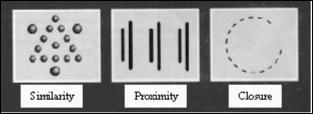
The gestalt law of perception is one way to describe how the human brain relates visual symbols, by grouping symbols that are close together and forms structure that is only suggested in the visualisation. Gestalt psychology is a school of psychology that emphasises patterns of organisation. “gestalt” is a German word, which translates to “form, shape, pattern, or organised whole”. The basic belief is that the whole is greater than the sum of its parts. The gestalt psychologists catalogued a number of laws of perceptual grouping which provide evidence for the nature of low-level visual processing, as well as a clue to the nature of the visual representation. They suggest that people group and interpret stimuli in accordance with four laws of perceptual organisation: proximity, similarity, closure and continuity [Smith 1993].
The principle of proximity suggests that elements closer together, tend to be grouped together as opposed to those further away. Objects that are grouped together based on similar properties apply to the principle of similarity. Another law of perceptual organisation is called closure, it includes the ability to see apparently disorganised or unrelated parts as a meaningful whole and to construct a total picture from incomplete or ambiguous material.
The last gestalt principle of organisation, continuity deals with objects that define smooth lines or curves. Good continuation is such a powerful organising principle that when the figure is restored to its initial state, you may “lose” the new organisation you just found as your original organisation takes over again. Similarity, Proximity, and closure are described in figure 2-1.
Figure 2-1 Three laws of perceptual organisation: proximity, similarity, and closure [Smith 1993].
5

3 Introduction to User Interfaces
The user interface is one of the most important parts of any program because it is the only connection between the system and the user. Up until now there has been basically two different ways to communicate with the interfaces; either by typing commands in a characterbased interfaces (CBI) or by pointing and clicking on objects in a GUI. CBIs are generally more difficult to learn but is often considered to be more flexible than GUIs [Preece et al. 1994].
We will give a brief introduction to user interfaces and present different types of user interfaces, starting with the CBI and the two dimensional (2D) GUIs. Next chapter introduces 3D GUIs.
3.1 Character-Based Interfaces
The display screen of a CBI is typically represented as an array of boxes, each of which can hold only one character. Since a CBI can only display characters, the users must interact with the system by typing commands on a keyboard (See figure 3-1).
The basic input device on most small computer systems is a keyboard. As characters are typed, they are stored in the memory and copied to a basic output device, a display screen.
CBIs can be concise and unambiguous, but are often difficult for a novice to learn and remember mainly because it is essential for the users to learn the syntax. Once it is learned a CBI can often be flexible and powerful for advanced users. However, error rates are typically high, training is necessary, retention may be poor and error messages can be difficult to understand [Preece et al. 1994].
Many character-based interfaces include some features of GUIs, such as menus. Other character based interfaces include shapes for drawing simple objects but are not capable of representing more complicated objects e.g. curves; these are sometimes called graphical character based user interfaces to separate them from true GUIs [Preece et al. 1994].
Microsoft<R> MS-DOS<R> Version 6.2
<C> Copyright Microsoft Corp 1981-1993.
C:\>copy g:\supervisor\final_thesis.doc a:\cheater\
C:\>
Figure 3-1 A Character Based Interface.
3.2 2D Graphical User Interfaces
Fundamental for the GUIs is that the screen is divided into a grid of picture elements (pixels), and by turning the pixels on or off pictures can be formed [Davis 1991].
Similar to Character Based Interfaces, GUIs also uses a keyboard as an input device and a display as an output device. With the introduction of the desktop metaphor (see section 3.2.1), a new input device that revolutionised the interaction was introduced. The mouse is a small
6
device that moves the cursor relative to its present position and makes it easy to interact with the computer system [Smith et al. 1982].
GUIs usually features windows, icons, menus, and pointers. The window makes it possible to divide the screen into different areas and to use each area for different tasks. Each window can contain icons, which are small pictures of system objects representing commands, files or windows. Menus are a collection of commands and objects from where a user can select and execute a choice. The pointer is a symbol that appears on the display screen, that you move to select and execute objects and commands.
A GUI often includes well-defined standard formats for representing text and graphics, thus making it possible for different programs using a common GUI to share data.
The use of GUIs helps reduce the mental effort required to interact with the programs. Instead of remembering sequences of complex command languages, users only need to learn how to interact with the simulated world of objects, e.g. icons and menus [Preece et al. 1994].
3.2.1Desktop Metaphor
One of the most famous of the first graphical user interfaces is called the Star user interface and was designed by Xerox Corporation’s Palo Alto Research Centre in the 1970s. Yet it was not until the early 1980s that the development of the Apple Lisa and the Macintosh made graphical user interfaces popular [Smith et al. 1982].
The Star interface is based on the physical office and thus designed to be more like the physical world that already is familiar to the users [Smith et al. 1982]. The idea of the interface metaphor was to create electronic counterparts to the physical objects in an office. This involved representing office objects, e.g. papers, folders, filing cabinets, and trashcans, on the screen. The overall organising metaphor presented on the screen was that of a desktop, resembling the top of an office desk.
Some of the principles that were developed with the Star computer included direct manipulation, What You See Is What You Get (WYSIWYG), and consistency of commands [Smith et al. 1982]. Direct manipulation is a communication style where objects are represented on the screen and can be manipulated by the user in ways analogues to how the user would work with the real objects. WYSIWYG is a way to represent the user’s conceptual model in a form that can be displayed. For example a document is displayed on the screen, as it would look in printed form [Preece et al. 1994].
3.2.2Interface Components
Interface components (sometimes known as widgets) are graphical objects with behaviour that are used to control the application and its objects [Conner et al. 1992]. The objects, such as buttons, menus, sliders, texts, labels, droplists, and lists are combined to make up the GUI. They all allow user interaction via a pointer device and/or a keyboard.
7