

8.6. CAUSE TREES |
297 |
this is easily done by running a command to look at all subdirectories of the current directory:
find . -mtime -1 -print -xdev
On other systems it is harder and requires special software. A GNU version of the Unix find utility is available for Windows.
A third reason why a filesystem can become full is corruption. In one instance a Unix disk continued to grow, despite verifying that no new files had been created and after removing all old log files. The Unix df disk utility eventually reported that the filesystem was 130% full (an impossibility) and it continued to grow. The eventual cause of this problem was identified as a fault in the filesystem structure, or inode corruption. This was brought about by the host concerned overheating and causing memory errors (system log errors confirmed memory write errors). The problem recurred twice before the host was moved to a cooler environment, after which time it righted itself (though the filesystem had to be repaired with fsck on each occasion).
There are many tips for tracing the activity of programs. For instance, to trace what files are read by a program, use strace or truss to watch for file descriptors
truss -t open,close program
This runs the program concerned in a monitor which prints out all the listed system calls. This can be a good way of finding out which libraries a program uses (or tries and fails to use) or which configuration files it opens.
Complete your own list of troubleshooting tips. This is a list you will be building for the rest of your life.
8.6 Cause trees
From the previous sections, we recognize that the causal relationships within a system can form complex networks. Unraveling such networks is difficult. In many cases we can simplify the causal structure by replacing part of the network with an effective tree that more clearly describes the causal relationships. The price for this simplification is that the events are non-deterministic; by hiding details, we lose complete information about the system, but achieve a higher level understanding. Cause trees were advocated before the topology of networks was fully appreciated.
Charting cause trees is a systematic method used in fault diagnosis. The idea is to begin by building lists of possible causes, then causes of those causes, and so on, until one has covered an appropriate level of detail. Once a cause tree has been constructed for a system, it becomes a road-map for fault finding for the future also. The use of cause trees is sometimes called Root Cause Analysis (RCA). A related method called Event Tree Analysis (ETA) maps out every single eventuality as a true/false binary tree, where every possibility is documented but only certain pathways actually occur. The latter is mainly a way of documenting the extent of a system; it has little analytical value.
298 |
CHAPTER 8. DIAGNOSTICS, FAULT AND CHANGE MANAGEMENT |
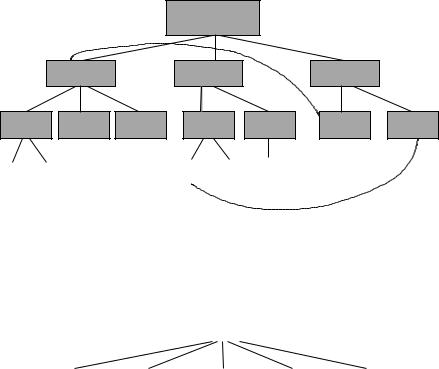
Many of the techniques described in this chapter were pioneered over the last half century by authorities working with nuclear power, where the risk of accidents takes on a whole different level of importance. The keyword in causal analyses is dependencies. All of the immediate causes of a phenomenon or event are called dependencies, i.e. the event depends on them for its existence. The cause tree for diagnostic example 6 is shown in figure 8.7. The structure is not completely hierarchical, but it is approximately so.
|
|
|
Net service down |
|
|
||
|
Service died |
|
No reply |
|
Timed-out |
|
|
Crashed |
Deleted |
Misconfig |
Cannot |
Will not |
DNS |
Routing |
|
respond |
respond |
failure |
prob. |
||||
|
|
|
|||||
Bug Upgraded |
|
No route Busy |
Access |
|
|
||
|
to host |
control |
|
|
|||
|
|
|
|
|
|||
Figure 8.7: Attempt at cause tree for a missing network service.
The cause tree for diagnostic example 7 is shown in figure 8.8. This is a particularly simple example; it simply becomes a flat list. Causal analysis can be
|
|
|
|
Disk full |
|
|
|
|
|
|
|
|
|
|
|
|
|
|
|
|
|
|
|
|
|
|
Filesystem |
|
Temporary |
|
Log files |
|
Legitimate |
|
Bad users |
corruption |
|
files |
|
|
usage |
|
||
|
|
|
|
|
|
|||
|
|
|
|
|
|
|
|
|
Figure 8.8: Attempt at cause tree for a full disk.
used at different levels. At the level of human management, it takes on a more heuristic role, e.g.
•Inadequate procedures
•Inadequate training
•Quality control
•Miscommunication
•Poor management
•Social/human engineering
8.7. PROBABILISTIC FAULT TREES |
299 |
•Supervision error
•Preventative maintenance lacking.
Information is collected about an incident or phenomenon and this is broken down into cause–effect relationships. Analysts must understand the systems they model thoroughly from the highest levels, down to the component level.
The construction of an event tree is just like the top-down analysis performed in programming. Breaking the event up into component causes is like breaking up a task into subroutines. The benefit is the same: a complex problem is reduced to a structured assembly of lesser problems.
8.7 Probabilistic fault trees
How can we go beyond the simple thinking aid of mapping of possible cause and effect to actually calculating the likely outcomes of the different pathways through a cause tree? To do that, we must acknowledge that not all of the possible pathways occur all of the time: some occur only infrequently, some are mutually exclusive, some are co-dependent and others are uncorrelated. To make serious headway in estimating likely cause, we thus need to add probabilities and combinatorics to the discussion. This is the contribution of fault tree analysis. The discussion here follows that of Apthorpe [17], based on ref. [227].
8.7.1Faults
For the purposes of modeling, fault tree analysis distinguishes between:
•Failures: abnormal occurrences that do not prevent the system from functioning.
•Faults: systemic breakdowns within the system.
An important subset of faults is formed by component faults.
Component faults fall into three categories:
•Primary faults: occur when a component is working within its design limits, e.g. a web server that is rated at 50 transactions per second fails when it reaches 30 transactions per second.
•Secondary faults: occur when a fault is operating outside its design specification, e.g. a web server that is rated at 50 transactions per second fails when it reaches 90 transactions per second.
•Command faults: are faults that occur when a system performs its specified function, but at the wrong time or place, e.g. a Web server that begins querying a database persistently when no request is being made by an external agent.
Faults occur in response to events. The events are also categorized, this time depending on their position within the tree structure:

300CHAPTER 8. DIAGNOSTICS, FAULT AND CHANGE MANAGEMENT
•Top: This is the top of the tree – the end phenomenon that we are trying to explain. It is analogous to the ‘main’ function in a computer program.
•Intermediary: This is a dependency within the tree, but not a root cause of the phenomenon. It is analogous to a subroutine of the main program, it has deeper dependencies that are subroutines of itself.
•Primary: This is an event that is either a root cause, or as deep an explanation as we can manage to determine. In a computer program analogy, it is like a basic library function, i.e. the lowest level of control available. Events that we cannot say much about are called undeveloped events because although we cannot dig any deeper, we know that there is more going on than we can say. Events that have no further explanation are called basic events. These are the primitive atoms of causality: the very root causes.
Events are drawn using the symbols in figure 8.9.
(a) |
(d) |
(b) |
(e) |
(c)
Figure 8.9: Basic symbols for fault trees.
8.7.2Conditions and set logic
When several smaller causes lead to an intermediate event or phenomenon, there arises a question about how many of the sub-events were needed to trigger the higher level event – all of them? any of them? a certain number? Events thus combine in ways that can be represented by simple combinatoric set notation – with ‘AND’ and ‘OR’ or other conditions. These are best known to computer scientists in the form of logic gates. Figure 8.10 shows the standard symbols for the gate types. Although there are many gate types, in practice AND and OR suffice for most cases.
The properties of the gates in combining the probabilities are noted below. Note that it makes a difference whether or not events are independent, in the probabilistic sense: i.e. the occurrence of one event does not alter the probability of occurrence of another.
• In OR gates, probabilities combine so as to get larger.
P (A OR B) = P (A) + P (B) − P (A AND B). |
(8.1) |

8.7. PROBABILISTIC FAULT TREES |
301 |
(a) |
(d) |
(g) |
(b) |
(e) |
m |
|
|
(c) |
(f) |
Figure 8.10: Basic gate types: (a) AND, (b) OR, (c) XOR, (d) transfer partial result to separate sub-tree, (e) voting gate (m of n), (f) inhibit conditional of ‘if’ gate, and (g) priority AND (inputs ordered from left to right) (see ref. [227]). Many simple cases can be modeled with just AND and OR.
In general,
n |
n−1 |
n |
|
|
|
|
|
P (A1 OR A2 OR . . . OR An) = P (Ai ) − |
n |
P (Ai )P (Aj ) + . . . |
(8.2) |
i=1 |
i=1 j =i+1 |
|
|
+(−1)n+1P (A1)P (A2) . . . P (An).
• In AND gates, probabilities combine so as to get smaller:
P (A AND B) = P (A)P (B|A), |
(8.3) |
or in general: |
|
n |
|
|
|
P (A1 AND A2 AND . . . AND An) = P (Ai ). |
(8.4) |
i=1 |
|
If A and B are independent, then |
|
P (A)P (B|A) = P (A)P (B), |
(8.5) |
which is smaller than P (A) or P (B); but if the events are not independent, the result can be much greater than this.
• XOR gates have no predictable effect on magnitudes. |
|
P (A OR B) = P (A) + P (B) − 2P (A AND B). |
(8.6) |
Thus if we see many OR pathways, we should be scared. If we see many AND pathways, we should be pleased – the latter means that things are tied down quite tightly with redundancy or protections.
302 |
CHAPTER 8. DIAGNOSTICS, FAULT AND CHANGE MANAGEMENT |
8.7.3Construction
Service down
Server failure
Router
P(BC)
P(A)
Bug |
Config |
P(B) |
P(C) |
|
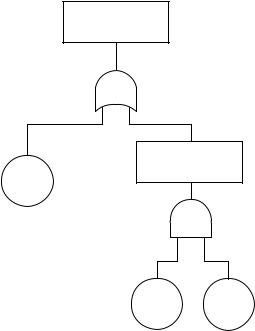
Figure 8.11: A simple fault tree for an unavailable service.
As a simple example, consider how to work out the probability of failure for a system attack, where an attacker tries the obvious pathways of failure: guessing the root password, or exploiting some known loopholes in services which have not been patched (see figure 8.11).
We split the tree into two main branches: first try the root password of the system, ‘OR’ try to attack any services which might contain bugs.
•The two main branches are ‘independent’ in the probabilistic sense, because guessing the root password does not change the sample space for attacking a service and vice versa (it’s not like picking a card from a deck).
•On the service arm, we split (for convenience) this probability into two parts and say that hosts are vulnerable if they have a service which could be exploited AND the hosts have not been patched or configured to make them invulnerable.
•Note that these two arms of the AND gate are time-dependent. After a service vulnerability becomes known, the administrator has to try to patch/reconfigure the system. Attackers therefore have a window of opportunity. This adds a time dimension to the fault analysis which we might or might not wish to address.

8.8. CHANGE MANAGEMENT REVISITED |
303 |
Since all the events are independent, we have:
P (breakin) = |
P (A OR (NOT A AND (B AND C))) |
(8.7) |
= |
P (A) + (1 − P (A)) × P (B)P (C) |
(8.8) |
Suppose we have, from experience,
•Chance of router problem P (A) = 5/1000 = 0.005.
•Chance of server problem P (B) = 50/1000 = 0.05.
•Chance that server is misconfigured P (C) = 10% = 0.1.
P (breakin) = 0.005 + 0.995 × 0.05 × 0.1
=0.005 + 0.0049
=0.01
= 1% |
(8.9) |
Notice how, even though the chance of guessing the root password is small, it becomes an equally likely avenue of attack, due to the chance that the host might have been upgraded. Thus we see that the chance of breakin is a competition between an attacker and a defender.
A cutset is a set of basic events that are essential for a top-level fault to occur. A minimal cutset is a cutset in which the removal of a single event no longer guarantees the occurrence of the top-level event. The aim of fault tree analysis is to identify these cutsets.
8.8 Change management revisited
Change management is about planning the timing and deployment of upgrades and overhauls to the system. One of the fears that makes system administrators reticent in changing anything is the maxim ‘if it ain’t broke, don’t fix it’. We want to know what the knock-on effects of change will be. Perhaps upgrading an operating system will have significant repercussions for users. What will be the consequences of such change?
Dependencies in a graph show us the consequences of our actions. How will a change propagate into the rest of the system, for better or for worse? A change is no different to a fault: a change of policy makes what was once a feature become a bug that needs to be fixed. Managing change is therefore analogous to the fixing of bugs, except that it begins with an extra step: a policy decision.
A checklist for change management can be specified as follows:
1.Decide on the change.
2.Map out the repercussion network (dependencies) of the change, as far as possible.1
1Some dependencies might be hidden or be beyond your control, e.g. operating system upgrade changes.