

Biblio5
.pdf240 CONCEPTS IN TRANSMISSION TRANSPORT
warding it to headquarters where the VSAT hub is located. Efficiency of bandwidth use is not a primary motivating factor in system design. Thus for the interactive VSAT data network environment, low delay, simplicity of implementation, and robust operation are generally of greater importance than the bandwidth efficiency achieved.
Message access on any shared system can be of three types: (1) fixed assigned, (2) contention (random access), or (3) reservation (controlled access). There are hybrid schemes between contention and reservation.
In the fixed assigned multiple access, VSAT protocols are SCPC/ FDMA, CDMA (a spread spectrum technique), and TDMA.17 All three are comparatively inefficient in the bursty environment with hundreds of thousands of potential users.
9.4 FIBER OPTIC COMMUNICATION LINKS
9.4.1 Applications
Fiber optics as a transmission medium has a comparatively unlimited bandwidth. It has excellent attenuation properties, as low as 0.25 dB/ km. A major advantage fiber has when compared with coaxial cable is that no equalization is necessary. Also, repeater separation is on the order of 10–100 times that of coaxial cable for equal transmission bandwidths. Other advantages are:
•Electromagnetic immunity;
•Ground loop elimination;
•Security;
•Small size and lightweight;
•Expansion capabilities requiring change out of electronics only, in most cases; and
•No licensing required.
Fiber has analog transmission application, particularly for video/ TV. However, for this discussion we will be considering only digital applications, principally as a PCM highway or “bearer.”
Fiber optics transmission is used for links under 1 ft in length all the way up to and including transoceanic undersea cable. In fact, all transoceanic cables currently being installed and planned for the future are based on fiber optics.
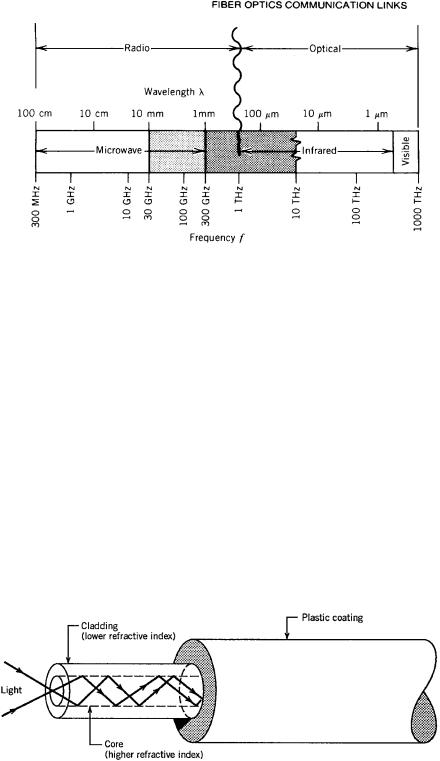
Fiber optics technology was developed by physicists and, following the convention of optics, wavelength rather than frequency is used to denote the position of light emission in the electromagnetic spectrum. The fiber optics of today uses three wavelength bands: (1) around 800 nm (nanometers), (2) 1300 nm, and (3) 1600 nm or near-visible infrared. This is illustrated in Figure 9.22.
This section includes an overview of how fiber optics links work, including the more common types of fiber employed, a discussion of light sources (transmitters), light detectors (receivers), optical amplifiers, and how lengths of fiber-optic cable are joined. There is also a brief discussion of wavelength-division multiplexing (WDM).
17SCPC stands for single channel per carrier.
9.4 FIBER OPTIC COMMUNICATION LINKS |
241 |
Figure 9.22 Frequency spectrum above 300 MHz. The usable wavelengths are just above and below 1 mm (1 × 10⁻⁶ meters).
9.4.2 Introduction to Optical Fiber as a Transmission Medium
Optical fiber consists of a core and a cladding, as illustrated in Figure 9.23. At present the most efficient core material is silica (SiO2). The cladding is a dielectric material that surrounds the core of an optical fiber.
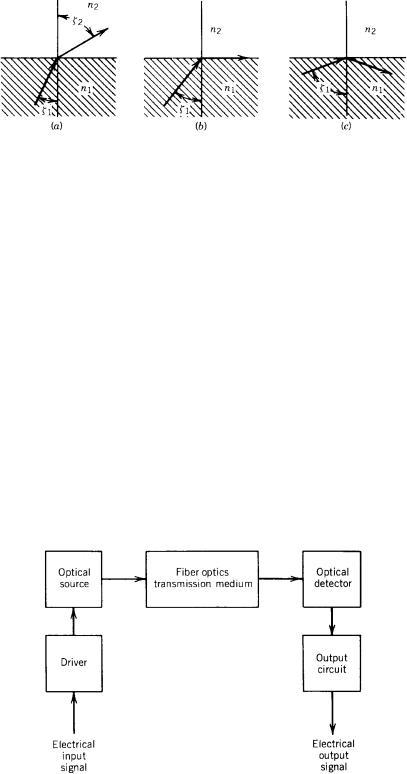
The practical propagation of light through an optical fiber may best be explained using ray theory and Snell’s law. Simply stated, we can say that when light passes from a medium of higher refractive index (n1) into a medium of lower refractive index (n2), the refractive ray is bent away from the normal. For instance, a ray traveling in water and passing into an air region is bent away from the normal to the interface between the two regions. As the angle of incidence becomes more oblique, the refracted ray is bent more until finally the refracted energy emerges at an angle of 908 with respect to the normal and just grazes the surface. Figure 9.24 shows various incident angles of light entering a fiber. Figure 9.24b illustrates what is called the critical angle, where the refracted ray just grazes the surface. Figure 9.24c is an example of total internal reflection. This occurs when the angle of incidence exceeds the critical angle. A glass fiber, for the effective transmission of light, requires total internal reflection.
Figure 9.23 Structure of optical fiber consisting of a central core and a peripheral transparent cladding surrounded by protective packaging.
242 CONCEPTS IN TRANSMISSION TRANSPORT
Figure 9.24 Ray paths for several angles of incidence (n1 > n2).
Figure 9.25 illustrates a model of a fiber optics link. Besides the supporting electrical circuitry, it shows the three basic elements in an optical fiber transmission system: (1) the optical source, (2) the fiber link, and (3) optical detector. Regarding the fiber-optic link itself, there are two basic impairments that limit the length of such a link without resorting to repeaters or that can limit the distance between repeaters. These impairments are loss (attenuation), usually expressed in decibels per kilometer, and dispersion, usually expressed as bandwidth per unit length, such as megahertz per kilometer. A particular
fiber-optic link may be power-limited or dispersion-limited.
Dispersion, manifesting itself in intersymbol interference at the receive end, can be brought about by several factors. There is material dispersion, modal dispersion, and chromatic dispersion. Material dispersion can manifest itself when the emission spectral line is very broad, such as with a light-emitting diode (LED) optical source. Certain frequencies inside the emission line travel faster than others, causing some transmitted energy from a pulse to arrive later than other energy. This causes intersymbol interference. Modal dispersion occurs when several different modes are launched. Some have more reflections inside the fiber than other modes, thus, again, causing some energy from the higher-order modes to be delayed, compared with lower-order modes.
Let us examine the effect of dispersion on a train of pulses arriving at a light detector. Essentially, the light is “on” for a binary 1 and “off” for a binary 0. As shown in Figure 9.26, the delayed energy from bit position 1 falls into bit position 2 (and possibly 3,
Figure 9.25 A model of a typical fiber optic communication link.

9.4 FIBER OPTIC COMMUNICATION LINKS |
243 |
Figure 9.26 A simplified sketch of delayed symbol (bit) energy of bit 1 spilling into bit position 2. Alternating 1s and 0s are shown. It should be noted that as the bit rate increases, the bit duration (period) decreases, exacerbating the situation.
4, etc.) confusing the decision circuit. Likewise, delayed energy from bit position 2 falls into bit position 3 (possibly 4, 5, etc.), and so on. This is aptly called intersymbol interference (ISI), which was previously introduced.
One way we can limit the number of modes propagated down a fiber is to make the fiber diameter very small. This is called monomode fiber, whereas the larger fibers are called multimode fibers. For higher bit rate (e.g., > 622 Mbps), long-distance fiber optic links, the use of monomode fiber is mandatory. This, coupled with the employment of the longer wavelengths (e.g., 1330 nm and 1550 nm), allows us to successfully transmit bit rates greater than 622 Mbps, and with certain care the new 10-Gbps rate can be accommodated.
9.4.3 Types of Optical Fiber
There are three categories of optical fiber, as distinguished by their modal and physical properties:
1. Step index (multimode);
2. Graded index (multimode); and
3. Single mode (also called monomode).
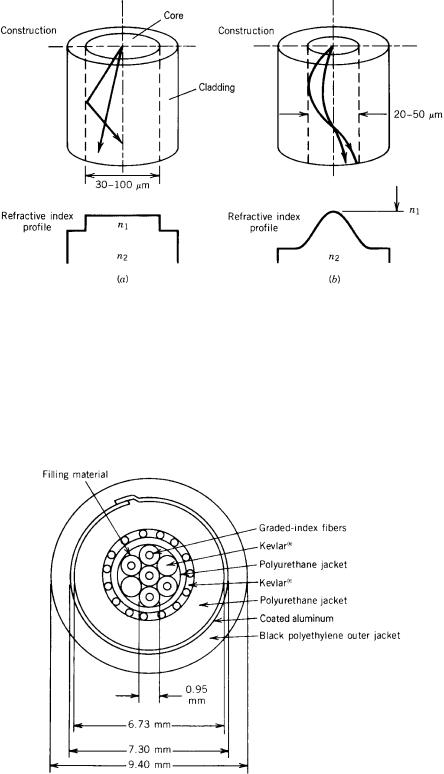
Step-index fiber is characterized by an abrupt change in refractive index, and graded index is characterized by a continuous and smooth change in refractive index (i.e., from n1 to n2). Figure 9.27 shows the fiber construction and refractive index profile for stepindex fiber (Fig. 9.27a) and graded-index fiber (Fig. 9.27b). Both step-index and gradedindex light transmission are characterized as multimode because more than one mode propagates. (Two modes are shown in the figure.) Graded-index fiber has a superior bandwidth-distance produce compared to that of step-index fiber. In other words, it can transport a higher bit rate further than step index. It is also more expensive. We can eliminate this cause of dispersion if we use single mode fiber. Figure 9.28 shows a typical five-fiber cable for direct burial.
244 CONCEPTS IN TRANSMISSION TRANSPORT
Figure 9.27 Construction and refractive index properties for (a) step-index fiber and (b) graded-index fiber.
9.4.4 Splices and Connectors
Optical fiber cable is commonly available in 1-km sections; it is also available in longer sections, in some types up to 10 km or more. In any case there must be some way of connecting the fiber to the source and to the detector as well as connecting the reels of cable together, whether in 1 km or more lengths, as required. There are two methods
Figure 9.28 Direct burial optical fiber cable.
9.4 FIBER OPTIC COMMUNICATION LINKS |
245 |
of connection, namely, splicing or using connectors. The objective in either case is to transfer as much light as possible through the coupling. A good splice couples more light than the best connectors. A good splice can have an insertion loss as low as 0.09 dB, whereas the best connector loss can be as low as 0.3 dB. An optical fiber splice requires highly accurate alignment and an excellent end finish to the fibers. There are three causes of loss at a splice:
1. Lateral displacement of fiber axes;
2. Fiber end separation; and
3. Angular misalignment.
There are two types of splice now available, the mechanical splice and the fusion splice. With a mechanical splice an optical matching substance is used to reduce splicing losses. The matching substance must have a refractive index close to the index of the fiber core. A cement with similar properties is also used, serving the dual purpose of refractive index matching and fiber bonding. The fusion splice, also called a hot splice, is where the fibers are fused together. The fibers to be spliced are butted together and heated with a flame or electric arc until softening and fusion occur.
Splices require special splicing equipment and trained technicians. Thus it can be seen that splices are generally hard to handle in a field environment such as a cable manhole. Connectors are much more amenable to field connecting. However, connectors are lossier and can be expensive. Repeated mating of a connector may also be a problem, particularly if dirt or dust deposits occur in the area where the fiber mating takes place.
However, it should be pointed out that splicing equipment is becoming more economic, more foolproof, and more user-friendly. Technician training is also becoming less of a burden.
Connectors are nearly universally used at the source and at the detector to connect the main fiber to these units. This makes easier change-out of the detector and source when they fail or have degraded operation.
9.4.5 Light Sources
A light source, perhaps more properly called a photon source, has the fundamental function in a fiber optic communication system to efficiently convert electrical energy (current) into optical energy (light) in a manner that permits the light output to be effectively launched into the optical fiber. The light signal so generated must also accurately track the input electrical signal so that noise and distortion are minimized.
The two most widely used light sources for fiber optic communication systems are the light-emitting diode (LED) and the semiconductor laser, sometimes called a laser diode (LD). LEDs and LDs are fabricated from the same basic semiconductor compounds and have similar heterojunction structures. They do differ in the way they emit light and in their performance characteristics.
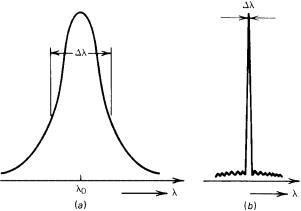
An LED is a forward-biased p–n junction that emits light through spontaneous emission, a phenomenon referred to as electroluminescence. LDs emit light through stimulated emission. LEDs are less efficient than LDs but are considerably more economical. They also have a longer operational life. The emitted light of an LED is incoherent with a relatively wide spectral line width (from 30 nm to 60 nm) and a relatively large angular spread, about 1008. On the other hand, a semiconductor laser emits a comparatively narrow line width (from <2 nm to 4 nm). Figure 9.29a shows the spectral line for an
246 CONCEPTS IN TRANSMISSION TRANSPORT
Figure 9.29 Spectral distribution (line width) of the emission from (a) an LED and (b) a semiconductor laser (LD), where l is the optical wavelength and Dl, where is the spectral or line width.
LED, and Figure 9.29b shows the spectral line for a semiconductor laser (i.e., a laser diode or LD).
What is a spectral line? Many of us imagine that if we were to view a radio carrier (without modulation) on an oscilloscope, it would be a vertical line that appeared to be of infinitely narrow width. This thinking tends to be carried into the world of light in a fiber-optic light-guide. In neither case is this exactly true. The emission line or light carrier has a finite width, as does a radio carrier. The IEEE (Ref. 6) defines spectral width, full-width half maximum as “The absolute difference between the wavelengths at which the spectral radiant intensity is 50% of the maximum.”
With present technology the LED is capable of launching about 100 mW (−10 dBm) or less of optical power into the core of a fiber with a numerical aperture of 0.2 or better. A semiconductor laser with the same input power can couple up to 7 mW (+8.5 dBm) into the same cable. The coupling efficiency of an LED is on the order of 2%, whereas the coupling efficiency of an LD (semiconductor laser) is better than 50%.
Methods of coupling a source into an optical fiber vary, as do coupling efficiencies. To avoid ambiguous specifications on source output powers, such powers should be stated at the pigtail. A pigtail is a short piece of optical fiber coupled to the source at the factory and, as such, is an integral part of the source. Of course, the pigtail should be the same type of fiber as that specified for the link.
LED lifetimes are in the order of 100,000 hr mean time between failures (MTBF) with up to a million hours reported in the literature. Many manufacturers guarantee a semiconductor laser for 20,000 hr or more. About 150,000 hours can be expected from semiconductor lasers after stressing and culling of unstable units. Such semiconductors are used in the latest TAT and PTAT series of undersea cables connecting North America and Europe.
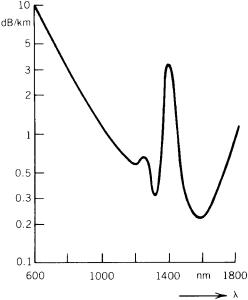
Current fiber optic communication systems operate in the nominal wavelength regions of 820 nm, 1330 nm, and 1550 nm. Figure 9.30 is a plot of attenuation per unit length versus wavelength. Based on this curve we can expect about 3 dB per kilometer at 820 nm, 0.50 dB per kilometer at 1330 nm, and at 1550 nm some 0.25 dB per kilometer of attenuation. Also take note that at about 1300 nm is a region of zero dispersion. For added expense, fiber is available with the dispersion minimum shifted to the 1550-nm band, where attenuation per unit length is minimum. There is mature technology at all three wavelengths.
9.4 FIBER OPTIC COMMUNICATION LINKS |
247 |
Figure 9.30 Attenuation per unit length versus wavelength of glass fiber (Ref. 7).
9.4.6 Light Detectors
The most commonly used detectors (receivers) for fiber optic communication systems are photodiodes, either PIN or APD. The terminology PIN derives from the semiconductor construction of the device where an intrinsic (I) material is used between the p–n junction of the diode.
Another type of detector is avalanche photodiode (APD), which is a gain device displaying gains on the order of 15 dB to 20 dB. The PIN diode is not a gain device. Table 9.7 summarizes various detector sensitivities with a “standard” BER of 1 × 10⁻⁹ for some common bit rates.18
Of the two types of photodiodes discussed here, the PIN detector is more economical and requires less complex circuitry that does its APD counterpart. The PIN diode has peak sensitivity from about 800 nm to 900 nm for silicon devices.
The overall response time for the PIN diode is good for about 90% of the transient but sluggish for the remaining 10%, which is a “tail.” The power response of the tail portion of a pulse may limit the net bit rate on digital systems.
The PIN detector does not display gain, whereas the APD does. The response time of the APD is far better than that of the PIN diode, but the APD displays certain temperature instabilities where responsivity can change significantly with temperature. Compensation for temperature is usually required in APD detectors and is often accomplished by a feedback control of bias voltage. It should be noted that bias voltages for APDs are much higher than for PIN diodes, and some APDs require bias voltages as high as 200 V. Both the temperature problem and the high-voltage bias supply complicate repeater design.
18Some entities such as SPRINT (US) specify 1 × 10 12.

248 CONCEPTS IN TRANSMISSION TRANSPORT
Table 9.7 Summary of Receiver Diode Sensitivities, Average Received Optical Power (in dBm, BER c 1 × 10 9)
|
|
|
|
InGaAs |
|
|
|
|
|
|
|
|
InGaAs |
|
SAM/ SAGMa |
|
|
|
|
|
InGaAs |
||
|
|
PIN |
|
|
APD |
|
Ge APD |
|
Photoconductor |
||
Bit |
|
|
|
|
|
|
|
|
|
|
|
Rate |
1.3 |
1.55 |
1.3 |
1.55 |
1.3 |
1.55 |
1.3 |
1.55 |
|||
(Mbps) |
mm |
mm |
|
mm |
m |
|
mm |
mm |
|
mm |
mm |
|
|
|
|
|
|
|
|
|
|
|
|
34 |
−52.5 |
|
|
|
|
|
−46 |
−55.8 |
|
|
|
45 |
−49.9 |
|
|
−51.7 |
|
|
−51.9 |
|
|
|
|
100 |
|
|
|
|
|
|
−40.5 |
|
|
|
|
140 |
−46 |
|
|
|
|
|
−45.2 |
−49.3 |
|
|
|
274 |
−43 |
|
|
−45 |
−38.7 |
|
|
−36 |
|
|
|
320 |
−43.5 |
|
|
|
|
|
|
|
|
|
|
420 |
|
|
|
−43 |
−41.5 |
|
|
|
|
|
|
450 |
|
|
|
−42.5 |
|
|
−39.5 |
−40.5 |
|
|
|
565 |
|
|
|
|
|
|
−33 |
|
|
|
|
650 |
−36 |
|
|
|
|
|
|
|
|
|
|
1000 |
|
|
|
−38 |
−37.5 |
|
−28 |
|
|
−34.4 |
|
1200 |
−33.2 |
−36.5 |
|
|
|
|
|
|
|
|
|
1800 |
|
|
|
−31.3 |
|
|
−30.1 |
|
|
|
|
2000 |
|
|
|
|
−36.6 |
|
|
−31 |
|
|
−28.8 |
4000 |
|
|
|
|
−32.6 |
|
|
|
|
|
|
aSAGM separated absorption, grating, and mulitplication regions. SAM separated absorption and multiplication regions.
Source: Ref. 8.
9.4.7 Optical Fiber Amplifiers
Optical amplifiers amplify incident light through stimulated emission, the same mechanism as used with lasers. These amplifiers are the same as lasers without feedback. Optical gain is achieved when the amplifier is pumped either electrically or optically to realize population inversion.
There are semiconductor laser amplifiers, Raman amplifiers, Brillouin amplifiers, and erbium-doped fiber amplifiers (EDFAs). Certainly the EDFAs show the widest acceptance. One reason is that they operate near the 1.55-mm wavelength region, where fiber loss is at a minimum. Reference 11 states that it is possible to achieve high amplifier gains in the range of 30 dB to 40 dB with only a few milliwatts of pump power when EDFAs are pumped by using 0.980-mm or 1.480-mm semiconductor lasers. Figure 9.31 is a block diagram of a low-noise EDFA.
In Figure 9.31, optical pumping is provided by fiber-pigtailed semiconductor lasers with typically 100 mW of power. Low-loss wavelength division multiplexers efficiently combine pump and signal powers and can also be used to provide a pump by-pass around the internal isolator. The EDFA has an input stage that is codirectionally pumped and an output stage that is counterdirectionally pumped. Such multistage EDFA designs have simultaneously achieved a low noise figure of 3.1 dB and a high gain of 54 dB (Refs. 10 and 11).
The loops of fiber should be noted in Figure 9.31. These are lengths of fiber with a dopant. The length of erbium-doped fiber required for a particular amplifier application depends on the available pump power, doping concentration, the design topology, and gain and noise requirements.

9.4 FIBER OPTIC COMMUNICATION LINKS |
249 |
Figure 9.31 An EDFA block diagram (From Ref. 9. Courtesy of Hewlett-Packard.)
EDFAs are often installed directly after a semiconductor laser source (transmitter) and/ or directly before the PIN or APD receiver at the distant end. Figure 9.32 illustrates this concept. With the implementation of EDFAs, the length of a fiber-optic link can be extended without repeaters and additional 100 km to 250 km, or it can extend the distance between repeaters a similar amount.
9.4.8 Wavelength Division Multiplexing
Wavelength division multiplexing (WDM) is just another name for frequency division multiplexing (FDM). In this section we will hold with the conventional term, WDM. The WDM concept is illustrated in Figure 9.33. WDM can multiply the transmission capacity of an optical fiber many-fold. For example, if we have a single fiber carrying 2.4 Gbps, and it is converted for WDM operation with 10 WDM channels, where each of these channels carry 2.4 Gbps, the aggregate capacity of this single fiber is now 2.4 × 10, or 24 Gbps.
The 1550-nm band is the most attractive for WDM applications because the aggregate wavelengths of a WDM signal can be amplified with its total assemblage together by a single EDFA. This is a great advantage. On the other hand, if we wish to regenerate the digital derivate of a WDM signal in a repeater, the aggregate must be broken down into its components, as shown in Figure 9.34.
The cogent question is: how many individual wavelength signals can we multiplex on a single fiber? It depends on the multiplexing/ demultiplexing approach employed, the number of EDFAs that are in tandem, the available bandwidth, channel separation (in nm), and the impairments peculiar to light systems and the WDM techniques used.
As mentioned, the number of WDM channels that can be accommodated depends on the bandwidth available and the channel spacing among other parameters and characteristics. For example, in the 1330-nm band with about 80 nm bandwidth avail-
Figure 9.32 Applications of EDFAs.