

Статистика пожаров / National Fire Protection Association / Fire loss in the United States during 2010
.pdfTable 1
Estimates of 2010 Fires, Civilian Deaths, Civilian Injuries
and Property Loss in the United States
|
|
Range1 |
Percent Change |
|
Estimate |
From 2009 |
|
|
|
|
|
Number of Fires |
1,331,500 |
1,311,500 |
-1.3 |
|
|
to 1,351,500 |
|
Number of Civilian |
|
|
|
Deaths |
3,120 |
2,810 to 3,430 |
+3.7 |
|
|
|
|
Number of Civilian |
|
|
|
Injuries |
17,720 |
16,820 to 18,620 |
+3.9 |
|
|
|
|
Property Loss2 |
$11,593,000,000 |
$11,283,000,000 |
-7.5** |
|
|
to 11,903,000,000 |
|
The estimates are based on data reported to the NFPA by fire departments that responded to the 2010 National Fire Experience Survey.
1These are 95 percent confidence intervals.
2This includes overall direct property loss to contents, structures, vehicles, machinery, vegetation, and anything else involved in a fire. It does not include indirect losses. No adjustment was made for inflation in the year-to-year comparison.
**Change was statistically significant at the .01 level.
Fire Loss in the U.S., 9/11 |
2 |
NFPA Fire Analysis and Research Quincy, MA |
Table 2
Estimates of 2010 Fires and
Property Loss by Property Use
|
Number of Fires |
Property Loss1 |
||
|
|
Percent Change |
|
Percent Change |
Type of Fire |
Estimate |
from 2009 |
Estimate |
from 2009 |
|
|
|
|
|
|
|
|
|
|
Fires in Structures |
482,000 |
+0.3 |
$9,716,000,000 |
-10.4** |
|
|
|
|
|
Fires in Highway |
|
|
|
|
Vehicles |
184,500 |
-3.2 |
987,000,000 |
-6.4 |
|
|
|
|
|
Fires in Other |
|
|
|
|
Vehicles2 |
31,000 |
+8.8 |
389,000,000 |
+26.7* |
|
|
|
|
|
Fires Outside of |
|
|
|
|
structures with |
|
|
|
|
value involved |
|
|
|
|
but no vehicle |
|
|
|
|
(outside storage, |
|
|
|
|
crops, timber, etc.) |
72,500 |
+5.1 |
413,000,000 |
+62.6** |
|
|
|
|
|
Fires in Brush, Grass |
|
|
|
|
Wildland (excluding |
|
|
|
|
crops and timber) |
|
|
|
|
with no value or |
|
|
|
|
loss involved |
304,000 |
-0.7 |
— |
— |
|
|
|
|
|
Fires in Rubbish |
|
|
|
|
including dumpsters |
|
|
|
|
(outside of structures), |
|
|
|
|
with no value or loss |
|
|
|
|
involved |
173,000 |
+1.2 |
— |
— |
|
|
|
|
|
All Other Fires |
84,500 |
-18.0** |
88,000,000 |
+18.9 |
|
|
|
|
|
Total |
1,331,500 |
-1.3 |
$11,593,000,000 |
-7.5** |
The estimates are based on data reported to the NFPA by fire departments that responded to the 2010 National Fire Experience Survey.
1This includes overall direct property loss to contents, structure, a vehicle, machinery, vegetation or anything else involved in a fire. It does not include indirect losses, e.g., business interruption or temporary shelter costs. No adjustment was made for inflation in the year-to-year comparison.
2This includes trains, boats, ships. aircraft, farm vehicles and construction vehicles.
*Change was statistically significant at the .05 level. **Change was statistically significant at the .01 level.
Fire Loss in the U.S., 9/11 |
3 |
NFPA Fire Analysis and Research Quincy, MA |
Table 3
Estimates of 2010 Structure Fires and
Property Loss by Property Use
|
Structure Fires |
Property Loss1 |
||
|
|
Percent |
|
Percent |
|
|
Change |
|
Change |
Property Use |
Estimate |
from 2009 |
Estimate |
from 2009 |
|
|
|
|
|
Public Assembly |
12,000 |
-17.2** |
$421,000,000 |
-44.4** |
|
|
|
|
|
Educational |
5,500 |
0 |
76,000,000 |
-8.4 |
|
|
|
|
|
Institutional |
5,500 |
0 |
37,000,000 |
+15.6 |
|
|
|
|
|
Residential (Total) |
384,000 |
+1.9 |
7,079,000,000 |
-9.2** |
Oneand Two-Family |
|
|
|
|
Homes2 |
279,000 |
+2.4 |
5,895,000,000 |
-7 |
Apartments |
90,500 |
+0.6 |
1,033,000,000 |
-15 |
Other Residential3 |
14,500 |
0 |
151,000,000 |
-16 |
|
|
|
|
|
Stores and Offices |
18,000 |
+9.1 |
730,000,000 |
+2.4 |
|
|
|
|
|
Industry, Utility, |
|
|
|
|
Defense4 |
9,000 |
-5.3 |
515,000,000 |
-10.0 |
|
|
|
|
|
Storage in Structures |
28,000 |
-5.1 |
756,000,000 |
-4.4 |
|
|
|
|
|
Special Structures |
20,000 |
-11.1 |
102,000,000 |
+4.1 |
|
|
|
|
|
Total |
482,000 |
+0.3 |
$9,716,000,000 |
-10.4** |
The estimates are based on data reported to the NFPA by fire departments that responded to the 2010 National Fire Experience Survey.
1This includes overall direct property loss to contents, structure, a vehicle, machinery, vegetation or anything else involved in a fire. It does not include indirect losses, e.g., business interruption or temporary shelter costs. No adjustment was made for inflation in the year-to-year comparison.
2This includes manufactured homes.
3Includes hotels and motels, college dormitories, boarding houses, etc.
4Incidents handled only by private fire brigades or fixed suppression systems are not included in the figures shown here. **Change was statistically significant at the .01 level.
Fire Loss in the U.S., 9/11 |
4 |
NFPA Fire Analysis and Research Quincy, MA |
3,500,000 |
|
|
|
|
|
|
|
|
|
|
|
|
|
|
Figure 1 |
|
|
|
|
|
|
|
|
|
|
|
|
|
|
|
|||
3,264,500 |
|
|
|
|
|
|
|
|
|
|
|
|
|
|
|
|
|
|
|
|
|
|
|
|
|
|
|||||||
|
|
|
|
|
|
|
|
Estimate of Fires by Type |
|
|
|
|
|
|
|
|
|
|
|
|
|||||||||||||
|
|
|
|
|
|
|
|
|
|
|
in the United States (1977-2010) |
|
|
|
|
|
|
|
|
|
|
|
|||||||||||
3,000,000 |
|
|
|
|
|
|
|
|
|
|
|
|
|
|
|
|
|
|
|
|
|
|
|
|
|
|
|
|
|
|
|
|
|
|
|
|
|
|
|
|
|
|
|
|
|
|
|
|
|
|
|
|
|
|
|
|
|
|
|
|
|
|
|
|
|
|
Total |
2,500,000 |
|
|
|
|
|
|
|
|
|
|
|
|
|
|
|
|
|
|
|
|
|
|
|
|
|
|
|
|
|
|
|
|
Outside |
|
|
|
|
|
|
|
|
|
|
|
|
|
|
|
|
|
|
|
|
|
|
|
|
|
|
|
|
|
|
|
|
|
|
|
|
|
|
|
|
|
|
|
|
|
|
|
|
|
|
|
|
|
|
|
|
|
|
|
|
|
|
|
|
|
|
|
Structure |
|
|
|
|
|
|
|
|
|
|
|
|
|
|
|
|
|
|
|
|
|
|
|
|
|
|
|
|
|
|
|
|
|
Vehicle |
2,000,000 |
|
|
|
|
|
|
|
|
|
|
|
|
|
|
|
|
|
|
|
|
|
|
|
|
|
|
|
|
|
|
|
|
|
1,658,500 |
|
|
|
|
|
|
|
|
|
|
|
|
|
|
|
|
|
|
|
|
|
|
|
|
|
|
|
|
|
|
|||
1,500,000 |
|
|
|
|
|
|
|
|
|
|
|
|
|
|
|
|
|
|
|
|
|
|
|
|
|
|
|
|
|
|
|
|
1,331,500 |
|
|
|
|
|
|
|
|
|
|
|
|
|
|
|
|
|
|
|
|
|
|
|
|
|
|
|
|
|
|
|
|
|
|
1,000,000 |
|
|
|
|
|
|
|
|
|
|
|
|
|
|
|
|
|
|
|
|
|
|
|
|
|
|
|
|
|
|
|
|
|
1,098,000 |
|
|
|
|
|
|
|
|
|
|
|
|
|
|
|
|
|
|
|
|
|
|
|
|
|
|
|
|
634,000 |
||||
|
|
|
|
|
|
|
|
|
|
|
|
|
|
|
|
|
|
|
|
|
|
|
|
|
|
|
|
|
|
|
|
||
508,000 |
|
|
|
|
|
|
|
|
|
|
|
|
|
|
|
|
|
|
|
|
|
|
|
|
|
|
|
|
|
|
|
||
500,000 |
|
|
|
|
|
|
|
|
|
|
|
|
|
|
|
|
|
|
|
|
|
|
|
|
|
|
|
|
|
|
|
|
482,000 |
|
|
|
|
|
|
|
|
|
|
|
|
|
|
|
|
|
|
|
|
|
|
|
|
|
|
|
|
|
|
|
|
|
|
|
|
|
|
|
|
|
|
|
|
|
|
|
|
|
|
|
|
|
|
|
|
|
|
|
|
|
|
|
|
|
|
215,500 |
|
0 |
|
|
|
|
|
|
|
|
|
|
|
|
|
|
|
|
|
|
|
|
|
|
|
|
|
|
|
|
|
|
|
|
|
1977 |
1978 |
1979 |
1980 |
1981 |
1982 |
1983 |
1984 |
1985 |
1986 |
1987 |
1988 |
1989 |
1990 |
1991 |
1992 |
1993 |
1994 |
1995 |
1996 |
1997 |
1998 |
1999 |
2000 |
2001 |
2002 |
2003 |
2004 |
2005 |
2006 |
2007 |
2008 |
2009 |
2010 |
Fire Loss in the U.S., 9/11 |
5 |
NFPA Fire Analysis and Research Quincy, MA |
Fires per Thousand Population
14.00
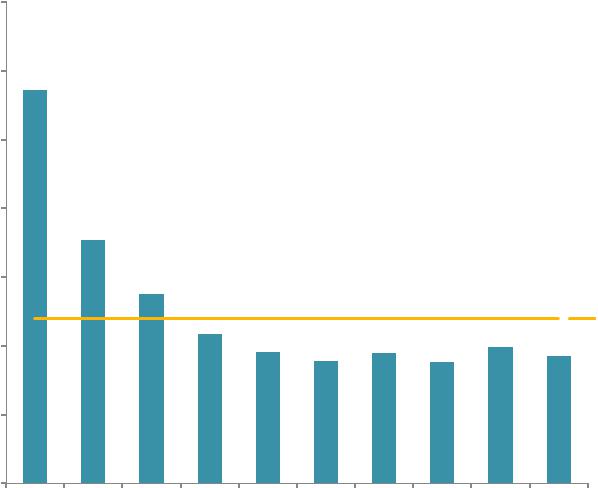
Figure 2. Fires per Thousand Population by Size of Community (2006-2010)
12.00 11.43
10.00
8.00 |
|
|
|
|
|
|
7.06 |
|
|
|
|
6.00 |
5.49 |
|
|
|
|
|
4.34 |
|
|
National Rate 4.78 |
|
|
3.82 |
|
3.77 |
3.97 |
|
4.00 |
3.54 |
3.68 |
|||
|
3.50 |
2.00
0.00
Under |
2,500 to |
5,000 to |
10,000 to |
25,000 to |
50,000 to |
100,000 to 250,000 to 500,000 to 1,000,0000 |
|||
2,500 |
4,999 |
9,999 |
24,999 |
49,999 |
99,999 |
249,999 |
499,999 |
999,999 |
or more |
Size of Community
Source: NFPA Survey of Fire Departments (2006-2010)
Fire Loss in the U.S., 9/11 |
6 |
NFPA Fire Analysis and Research, Quincy, MA |
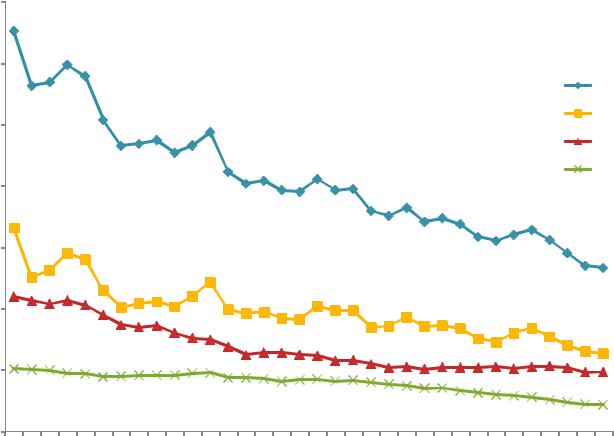
the next three years. From 1997 to 2002, the number of outside fires stayed in the 839,000 to 861,500 level except for 1999, then rose in 2005 and 2006, before declining during 2007-2010 to 634,000 at the end of 2010.
Of the outside fires, there were an estimated 304,000 brush, grass and wildland fires in 2010, a very slight decrease of 0.7%, while an estimated 173,000 rubbish fires occurred, a very slight increase of 1.2%, or virtually no change from a year ago.
Civilian Fire Deaths
The 1,331,500 fires reported by fire departments in the U.S. in 2010, resulted in an estimated 3,120 civilian deaths based on data reported to the NFPA. This is an increase of 3.7% from a year ago. The nature of the increase is better understood when results are examined by property type.
An estimated 2,665 civilians died in residential fires in 2010, an increase of 2.9%. Of these deaths, 440 occurred in apartment fires. Another 2,200 died in oneand twofamily homes, an increase of 4.8%.
In all, fires in the home (oneand two-family homes including manufactured homes and apartments) resulted in 2,640 civilian deaths, an increase of 2.9% from a year ago. Looking at trends in civilian deaths since 1977-781, several observations are worth noting (see Figure 3). Home fire deaths were at their peak in 1978 when 6,015 fire deaths occurred. Home fire deaths then decreased steadily during the 1979-82 period except for 1981, and decreased a substantial 20% during the period to 4,820 by the end of 1982. From 1982 to 1988, the number of home fire deaths stayed quite level in the 4,650 to 4,950 area except for 1984 when 4,075 fire deaths occurred. From 1989 to 1996 home fire deaths continued to decline and stayed in the 3,420 to 4,340 area. From 1997 onward home fire deaths have generally continued to decline with the number of deaths staying in the 2,550 to 3,200 area since 2001.
Overall for the 1977-2010 period, the number of home fire deaths decreased from 5,865 in 1977 to 2,640 in 2010 for a decrease of 55%. The number of home fire incidents also declined steadily for an overall decrease of 49% for the same period. When the death rate per 1,000 home fire incidents is looked at (Figure 3), there is no steady decline, but rather the rate fluctuates considerably up and down2. In fact, the death rate per 1,000 home fires was 8.1 in 1977 and 7.1 in 2010 for a decrease of 12%. These results suggest that even though the number of home fires and home fire deaths declined similarly during the period, the death rate did not, and that given there is a home fire, the fire death rate risk has not changed much for the period.
Fire Loss in the U.S, 9/11 |
7 |
NFPA Fire Analysis and Research, Quincy, MA |
With home fire deaths still accounting for 2,640 fire deaths or 85% of all civilian deaths, fire safety initiatives targeted at the home remain the key to any reductions in the overall fire death toll. Five major strategies are: First, more widespread public fire safety education is needed on how to prevent fires and how to avoid serious injury or death if fire occurs. Information on the common causes of fatal home fires should continue to be used in the design of fire safety education messages. Second, more people must use and maintain smoke detectors and develop and practice escape plans. Third, wider use of residential sprinklers must be aggressively pursued. Fourth, additional ways must be sought to make home products more fire safe. The regulations requiring more childresistant lighters are a good example, as are requirements for cigarettes, with reduced ignition strength (generally called “fire-safe” cigarettes). The wider use of upholstered furniture and mattresses that are more resistant to cigarette ignitions is an example of change that has already accomplished much and will continue to do more. Fifth, the special fire safety needs of high-risk groups, e.g., the young, older adults, and the poor need to be addressed.3.4
Also in 2010, 90 civilians that died in nonresidential structure fires, a decrease of
14.3%.
Civilian fire death rates per million people by community size were examined (Figure 4). The smallest communities (populations less than 2,500) had the highest rate with 10.8, which was almost twice the national average rate.
Of the 2,755 civilians that died in structure fires, 200 or 7.3% died in fires that were intentionally set.
Also in 2010, an estimated 285 civilians died in highway vehicle fires, an increase of 9.6%.
Fire Loss in the U.S, 9/11 |
8 |
NFPA Fire Analysis and Research, Quincy, MA |
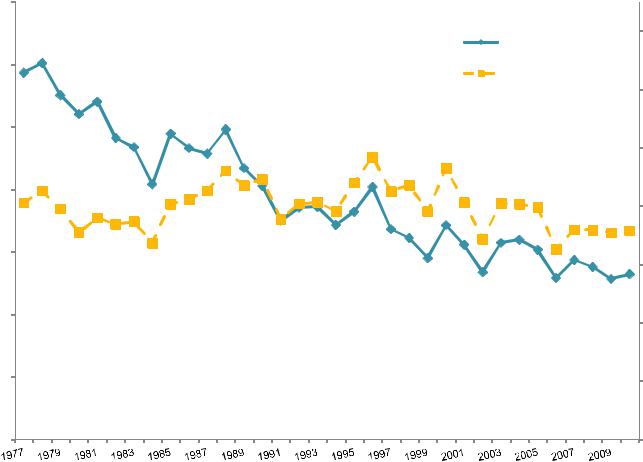
Figure 3. Civilian Home Fire Deaths and Rates per 1000 Fires, 1977-2010
|
7000 |
|
|
|
14.0 |
|
|
Home fire Deaths |
|
6000 |
Deaths per 1000 Fires |
|
|
|
|
|
12.0 |
|
5000 |
|
|
|
10.0 |
Home Fire Deaths |
4000 |
|
|
8.0 |
|
3000 |
perHomeFires1000 |
|
|
6.0 |
|
|
|
|
Civilian |
|
DeathRate |
|
2000 |
4.0 |
|
|
|
|
1000 |
2.0 |
|
|
|
|
0 |
0.0 |
Source: NFPA Surve of Fire Departments (1977 2010)
Fire Loss in the U.S, 9/11 |
9 |
NFPA Fire Analysis and Research, Quincy, MA |

Table 4
Estimates of 2010 Civilian Fire Deaths and
Injuries by Property Use
|
|
Civilian Deaths |
|
Civilian Injuries |
|
|
||
|
|
Percent |
Percent |
|
|
Percent |
|
Percent |
|
|
Change |
of all |
|
|
Change |
|
of all |
|
|
From |
Civilian |
|
|
From |
|
Civilian |
Property Use |
Estimate |
2009 |
Deaths |
Estimate |
|
2009 |
|
Injuries |
|
|
|
|
|
|
|
||
Residential (total) |
2,665 |
+2.9 |
85.4 |
13,800 |
+5.8 |
|
77.9 |
|
One-and-Two- |
2,200 |
+4.8 |
70.5 |
9,400 |
+1.1 |
|
53.1 |
|
Family Homes1 |
|
|
|
|
|
|
|
|
Apartments |
440 |
-5.4 |
14.1 |
3,950 |
+17.9* |
|
22.3 |
|
Other Residential2 |
25 |
0 |
0.8 |
450 |
+12.5 |
|
2.5 |
|
|
|
|
|
|
|
|
||
Non-residential |
90 |
-14.3 |
2.9 |
1,620 |
-4.1 |
|
9.1 |
|
Structures3 |
|
|
|
|
|
|
|
|
Highway Vehicles |
285 |
+9.6 |
9.1 |
1,440 |
-1.0 |
|
8.1 |
|
Other Vehicles4 |
25 |
+25.0 |
0.8 |
150 |
-3.2 |
|
0.9 |
|
All Other5 |
55 |
+57.1 |
1.8 |
710 |
+1.4 |
|
4.0 |
|
Total |
3,120 |
+3.7 |
|
17,720 |
+3.9 |
|
|
|
Estimates are based on data reported to the NFPA by fire departments that responded to the 2010 National Fire Experience Survey. Note that most changes were not statistically significant; considerable year-to-year fluctuation is to be expected for many of these totals because of their small size.
1This includes manufactured homes.
2Includes hotels and motels, college dormitories, boarding houses, etc.
3This includes public assembly, educational, institutional, store and office, industry, utility, storage, and special structure properties.
4This includes trains, boats, ships, farm vehicles and construction vehicles.
5This includes outside properties with value, as well as brush, rubbish, and other outside locations.
*Change was statistically significant at the .05 level.
Fire Loss in the U.S, 9/11 |
10 |
NFPA Fire Analysis and Research, Quincy, MA |

Figure 4. Civilian Fire Deaths per Million Population by Community Size (2006-2010)
Civilian Fire Deaths per Million Population
25.00
22.29
20.00
15.45
15.00
11.5111.52
10.00 |
|
|
|
|
8.89 |
|
9.15 |
|
9.69 |
|
National Rate 10.83 |
|
|
|
|
8.29 |
7.85 |
|
7.75 |
|
|||
|
|
|
|
|
|
|
|
|
|||
|
|
|
|
|
|
|
|
|
|
||
5.00 |
|
|
|
|
|
|
|
|
|
|
|
0.00 |
|
|
|
|
|
|
|
|
|
|
|
Under |
2,500 to |
5,000 to |
10,000 to |
25,000 to |
50,000 to |
100,000 to |
250,000 to |
500,000 to |
1,000,0000 |
|
|
|
|
||||||||||
2,500 |
4,999 |
9,999 |
24,999 |
49,999 |
99,999 |
249,999 |
499,999 |
999,999 |
or more |
||
Community Size
Source: NFPA Survey of Fire Departments (2006 2010)
Fire Loss in the U.S., 9/11 |
11 |
NFPA Fire Analysis and Research, Quincy, MA |