

Статистика пожаров / National Fire Protection Association / Fire loss in the United States during 2010
.pdfCivilian Fire Injuries
Results based on data reported to the NFPA indicate that in addition to 3,120 civilian fire deaths, there were an estimated 17,720 civilian fire injuries in 2010. This represents an increase of 3.9% from a year ago, and is the highest since 2005 when 17,925 injuries occurred.
Estimates of civilian fire injuries are on the low side, because many civilian injuries are not reported to the fire service. For example, many injuries occur at small fires that fire departments do not respond to, and sometime when departments do respond they may be unaware of injured persons that they did not transport to medical facilities.
The NFPA estimates that there were 13,800 civilians injured in residential properties, an increase of 5.8%. Of these injuries 9,400 occurred in oneand two-family homes, and 3,950 occurred in apartments. There were also 1,620 civilians injured in nonresidential structures in 2010.
For the 1977-2010 period, the number of civilian injuries has ranged from a high of 31, 275 in 1983 to a low of 16,400 in 2006 for an overall decrease of 48%. There was no consistent pattern going up or down until 1995, when injuries fell roughtly 5,000 in 1994-95 to 25,775. From 1996 to 2002, injuries declined 28% to 18,425 by the end of 2002. Since 2002, civilian injuries have been in the range of 16,400 to 18,425.
Fire Loss in the U.S., 9/11 |
12 |
NFPA Fire Analysis and Research, Quincy, MA |
Property Loss
The NFPA estimates that the 1,331,500 fires responded to by the fire service caused $11,593,000,000 in property damage in 2010. This is a highly significant decrease of 7.5%.
Fires in structures resulted in $9,716,000,000, in property damage, a significant decrease of 10.4%. Average loss per structure fire was $20,158, a significant decrease of 10.6%.
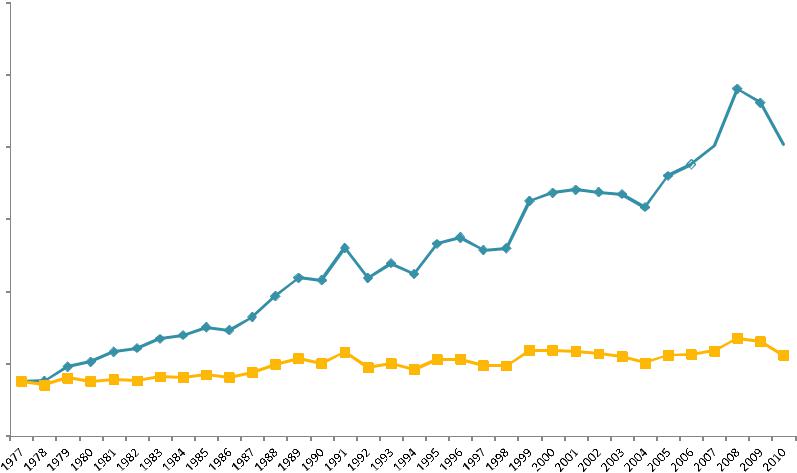
Over the 1977-2010 period, and excluding the events of 9/11/01, the average loss per structure fire was $3,757 in 1977 and $20,158 in 2010 for an overall increase of 436%. When property loss is adjusted for inflation, the increase in the average structure fire loss between 1977 and 2010 is 48%.
Of the property loss in structures, $7,079,000,000 occurred in residential properties, a decrease of 9.2%. An estimated $5,895,000,000 occurred in oneand twofamily homes, a decrease of 7.8%. An estimated $1,033,000,000 also occurred in apartments.
Other property damage figures worth noting for 2010 include: $421,000,000 in public assembly properties, a significant decrease of 44.4% (this decrease reflects a s009 casino fire that resulted in $340,000,000 in property loss); $515,000,000 in industrial properties, a decrease of 10.0%; $389,000,000 in fires outside of a structure with value involved, a significant increase of 27.6% (this increase reflects the Fourmile Canyon Wildfire in Colorado with an estimated property loss of $217,000,000).
It should be kept in mind that property loss totals can change dramatically from year to year because of the impact of occasional large loss fires. The NFPA provides an analysis of these large loss fires in the November/December issue of NFPA Journal every year.
Fire Loss in the U.S., 9/11 |
13 |
NFPA Fire Analysis and Research, Quincy, MA |
30,000 |
Figure 5. Average Loss per Structure |
|
Fire in the United States (1977-2010) |
25,000
 Unadjusted
 Adjusted for Inflation
20,000 

 $20,158
15,000
10,000
5,000
$5,555
0
Source: NFPA Survey of Fire Departments (1977-2010) |
Year |
Fire Loss in the U.S., 9/11 |
14 |
NFPA Fire Analysis and Research, Quincy, MA |
Intentionally Set Fires
Based on data reported by fire departments in the survey, the NFPA estimates there were 27,500 intentionally set structure fires in 2010, an increase of 3.8% from a year ago (see Table 5). (Note the NFPA survey is based on the NFIRS 5.0 system. This system has an intentionally set category which is equivalent to the old incendiary category. There is no new equivalent to the old suspicious category, which has been eliminated.)
These intentionally set structure fires resulted in an estimated 200 civilian deaths, an increase of 17.7%. These set structure fires also resulted in $585,000,000 in property loss, a decrease of 14.5%.
Also in 2010, there were an estimated 14,000 intentionally set vehicle fires, a decrease of 6.7% from a year ago. These set vehicle fires resulted in $89,000,000 in property loss, a decrease of 17.6% from a year ago.
Fire Loss in the U.S., 9/11 |
15 |
NFPA Fire Analysis and Research, Quincy, MA |
|
|
Table 5 |
|
Estimate of 2010 Losses in |
|
|
Intentionally Set Structure Fires |
|
|
|
|
Intentionally2 Set |
Estimate |
Percent change |
Structure Fires |
|
from 2008 |
|
|
|
Number of Structure Fires |
27,500 |
+3.8 |
|
|
|
Civilian Deaths |
200 |
+17.7 |
|
|
|
Property Loss1 |
$585,000,000 |
-14.5 |
The estimates are based on data reported to the NFPA by fire departments that responded to the 2010 National Fire Experience Survey.
1 This includes overall direct property loss to contents, structure, a vehicle, machinery, vegetation, or anything else involved in a fire. It does not include indirect losses, e.g., business interruption or temporary shelter costs. No adjustment was made for inflation in the year-to-year comparison.
2The NFPA Survey is based on the NFIRS 5.0 system. This system has an intentionally set category which is equivalent to the old incendiary category. There is no new equivalent to the old suspicious category, which has been eliminated.
Fire Loss in the U.S., 9/11 |
16 |
NFPA Fire Analysis and Research, Quincy, MA |
Region
Fire loss rates nationwide and by region can be seen in Table 6. The Midwest and the South with 4.9 fires per thousand people had the highest fire incident rates..
The South (13.0) and the Midwest (12.6) had the highest civilian death rate per million population. In recent years, the Midwest and the South have had the highest fire incident and civilian death rates.
The Northeast (76.6) and the Midwest (71.1) had the highest civilian injury rates per million population.
The Midwest with $46.0 property loss per capita had the highest property loss
rate.
Fire incident rates by region and community size are shown in Table 8. The Northeast had the highest rate for communities of 500,000 or more, the Midwest had the highest rate for communities of 250,000 to 499,999, and the South had the highest rates for communities of 10,000 to 99,999, and smaller communities (population of less than 10,000)..
Civilian fire deaths per million population by region and community size are shown in Table 9. The Midwest had the highest rate for communities of 100,000 to 499,999 and the smallest communities (population of less then 5,000 population), the West had the highest rate for communities of 5,000 to 9,999, and the South had the highest rates for communities of 10,000 to 99,999.
Civilian fire injuries per million population by region and community size are shown in Table 9. The West had the highest rates for communities of 500,000 or more (though only the South and the West had sufficient data for this community size), and the South had the highest rate for communities of 100,000 to 249,999. The Midwest had the highest rates for communities of 250,000 to 499,999, communities of 10,000 to 24,999, and communities less than 2,500 population, and the Northeast had the highest rates for communities of 25,000 to 99,999, and communities of 2,500 to 9,999.
Property loss per capita by region and community size are shown in Table 10. The South had the highest rates for most community sizes, and the West had the highest rate for communities of 25,000 to 49,999.
Fire Loss in the U.S., 9/11 |
17 |
NFPA Fire Analysis and Research, Quincy, MA |
Table 6
Fire Loss Rates Nationwide and by Region, 2010
|
Number of |
Civilian |
Civilian |
|
|
Fires per |
Deaths per |
Injuries per |
|
|
Thousand |
Million |
Million |
Property Loss |
Region |
Population |
Population |
Population |
per Capita |
|
|
|
|
|
Nationwide |
4.3 |
10.1 |
57.3 |
$37.5 |
|
|
|
|
|
Northeast |
4.4 |
6.8 |
76.6 |
31.2 |
|
|
|
|
|
Midwest |
4.9 |
12.6 |
71.1 |
46.0 |
|
|
|
|
|
South |
4.9 |
13.0 |
51.6 |
38.7 |
|
|
|
|
|
West |
2.7 |
5.7 |
38.8 |
32.5 |
Source: NFPA’s; Survey of Fire Departments for 2010 U.S. Fire Experience.
Fire Loss in the U.S., 9/11 |
18 |
NFPA Fire Analysis and Research, Quincy, MA |
Table 7
2010 Fires per Thousand Population
Population of |
All |
|
|
|
|
Community |
Regions |
Northeast |
Midwest |
South |
West |
|
|
|
|
|
|
500,000 or more |
3.4 |
5.4 |
* |
3.4 |
2.2 |
250,000 to 499,999 |
3.1 |
* |
4.3 |
3.2 |
2.0 |
100,000 to 249,999 |
3.4 |
5.4 |
3.6 |
4.1 |
2.1 |
50,000 to 99,999 |
3.3 |
3.8 |
2.8 |
4.3 |
2.3 |
25,000 to 49,999 |
3.4 |
3.9 |
2.8 |
4.4 |
3.0 |
10,000 to 24,999 |
4.0 |
3.7 |
3.4 |
5.8 |
3.2 |
5,000 to 9,999 |
5.0 |
4.3 |
4.3 |
7.0 |
4.6 |
2,500 to 4,999 |
6.6 |
5.6 |
5.8 |
9.5 |
5.8 |
under 2,500 |
10.3 |
7.6 |
8.9 |
15.6 |
9.8 |
Source: NFPA's Survey of Fire Departments for 2010 U.S. Fire Experience. *Insufficient data
Fire Loss in the U.S., 9/11 |
19 |
NFPA Fire Analysis and Research, Quincy, MA |
Table 8
2010 Civilian Fire Deaths per Million Population by Region and Size of Community
Population of |
All |
|
|
|
|
Community |
Regions |
Northeast |
Midwest |
South |
West |
|
|
|
|
|
|
500,000 or more |
8.1 |
8.8 |
* |
10.5 |
4.3 |
250,000 to 499,999 |
5.8 |
* |
13.3 |
4.4 |
2.8 |
100,000 to 249,999 |
8.5 |
5.7 |
14.7 |
9.5 |
4.4 |
50,000 to 99,999 |
7.2 |
5.9 |
8.1 |
9.9 |
2.8 |
25,000 to 49,999 |
7.9 |
8.2 |
8.5 |
11.5 |
7.7 |
10,000 to 24,999 |
10.8 |
8.3 |
9.7 |
17.3 |
4.4 |
5,000 to 9,999 |
9.4 |
11.1 |
4.5 |
13.9 |
14.5 |
2,500 to 4,999 |
13.5 |
5.2 |
17.9 |
11.9 |
9.5 |
under 2,500 |
14.6 |
* |
18.4 |
17.4 |
12.8 |
Source: NFPA's Survey of Fire Departments for 2010 U.S. Fire Experience *Insufficient data
Fire Loss in the U.S., 9/11 |
20 |
NFPA Fire Analysis and Research, Quincy, MA |
Table 9
2010 Civilian Fire Injuries per Million Population by Region and Size of Community
Population of |
All |
|
|
|
|
Community |
Regions |
Northeast |
Midwest |
South |
West |
|
|
|
|
|
|
500,000 or more |
51.5 |
* |
* |
40.6 |
44.8 |
250,000 to 499,999 |
46.2 |
* |
82.7 |
46.6 |
31.2 |
100,000 to 249,999 |
63.5 |
* |
72.0 |
81.6 |
34.3 |
50,000 to 99,999 |
64.1 |
119.8 |
62.2 |
69.9 |
37.7 |
25,000 to 49,999 |
65.0 |
78.1 |
65.1 |
70.5 |
43.8 |
10,000 to 24,999 |
61.7 |
57.9 |
65.5 |
59.9 |
55.0 |
5,000 to 9,999 |
36.9 |
43.0 |
39.0 |
31.8 |
29.1 |
2,500 to 4,999 |
40.5 |
57.6 |
34.4 |
34.6 |
56.7 |
under 2,500 |
52.1 |
25.0 |
76.5 |
40.8 |
* |
Source: NFPA's Survey of Fire Departments for 2010 U.S. Fire Experience. *Insufficient data
Fire Loss in the U.S., 9/11 |
21 |
NFPA Fire Analysis and Research, Quincy, MA |