

Key Points 2011-12
NB: Headline data up to March 2012 is available at www.gov.uk/government/publications/fire-statistics-monitor-april-2011-to-march-2012
Overview
•In 2011-12 fire and rescue authorities attended 585,000 fires or false alarms in Britain,
7% fewer than in 2011-12 (para 1.1).
•A total of 272,000 fires were attended, 6% fewer than in 2010-11. Around 71% were outdoor fires (193,000), e.g. road vehicles, refuse, grassland. A total of 44,000 (16%) were fires in dwellings (para 1.1, 1.2 & 5.1).
•The total number of accidental dwelling fires fell by 3% to 37,600 in 2011-12 (para 1.7).
Fatalities from fires
•In 2011-12, there were 380 fire-related fatalities in Britain, 24 fewer than in 2010-11 and lower than in any year in the last fifty years. The highest number of fatalities recorded was 967 in 1985-86. Through the 1990s and 2000s there was a general downward trend. (para 1.10).
•Three quarters (76%) of fire-related fatalities occurred in dwelling fires (para 1.11). Fire fatality rates are notably higher for people aged 80+ and for males, and in Scotland (para 1.14 & 1.25).
•Being overcome by gas, smoke or toxic fumes was partly or wholly the cause of death in over half (53%) of all fire fatalities.
Non-fatal casualties
•There were 11,300 non-fatal casualties in fires in Britain in 2011-12, 32 per cent lower than in 2000/01. The number was similar to that recorded in 2011-12 and lower than any other year except 2009-10. (para 1.15).
Dwelling Fires
•There were 43,500 dwelling fires in Britain in 2011-12, 3% lower than in 2010-11. Most dwelling fires were accidental (86%), 37,600 fires (paras 2.1 & 2.2).
Accidental dwelling fires
•The main cause of accidental dwelling fires remained the misuse of equipment/appliances (14,700 fires), while the main source of ignition was cooking appliances which accounted for more than half of all accidental dwelling fires) (paras 2.3 & 2.5).
10
Fatalities in dwelling fires
•Of the 287 fatalities in dwellings in 2011-12, 244 (85%) were of accidental causes. The main cause was careless handling of fire or hot substances (e.g. careless disposal of cigarettes), amounting to 35% of all fatalities due to accidental causes (para 2.7 & 2.8).
The highest fatality rate is for fires which started in the living or dining room (para 2.21).
Non-fatal casualties in dwelling fires
•Of the 11,300 non-fatal casualties in dwellings, the largest cause of injury in accidental dwelling fires was the misuse of equipment and appliances (2,600 injuries) (para 2.14 & 2.15).
Smoke alarms status in dwelling fires
•No smoke alarm was present in 14,800 (34%) dwelling fires (para 2.26). A smoke alarm was present but did not operate in 18% of dwelling fires.
•Smoke alarm ownership increased rapidly from 8% in 1988 to 70% in 1994, and has continued to rise in recent years to 86% in 2008 (para 2.27).
Other Building Fires
•In 2011-12 there were 24,100 fires recorded in buildings other than dwellings, 4% fewer than in 2010-11. Of these, 70% were accidental compared to 86% of those in dwellings (para 3.1 & 3.3).
•Twenty five people died and there were 1,200 non-fatal casualties in fires in buildings other than dwellings. (para 3.2 & 3.8).
Road Vehicle Fires
•There were 28,000 road vehicle fires in 2011-12 – 14% fewer than 2010-11. This was the lowest in more than a decade and 75 per cent lower than its peak in 2001/02 (para 4.1).
11

Introduction
The statistics in this publication are compiled from Fire and Rescue Service records of incidents attended by fire and rescue authorities across Great Britain1.
This publication contains detailed analysis of fires, casualties and their causes for 2011-12. Headline data for 2011-12 was published in July 2012 in the Fire Statistics Monitor series.
This is the second edition of this publication using data since the new Incident Recording System was adopted. Incomplete records from one Fire and Rescue Authority meant that it was not possible to produce some more detailed statistics for 2009-10. The notes and definitions section at the rear of the publication provide definitions and context, including signposting to some changes to the detailed categories which will feed into statistics from the
2012-13 edition of this publication. The impact on data tables is expected to be very minor, but these are nevertheless flagged up for information at the end of the definitions section.
This publication follows the content and order of previous editions as far as possible in order to be consistent for those familiar with previous editions. Following a critical review of all of the content of the publication, which had changed little over the past 15 years, some sections of the commentary and six annex tables have been discontinued, and new interactive tables showing numbers of fires and casualties by source of ignition has been introduced. The review involved a detailed user survey to which 22 users responded. The views expressed by users have been written up in the document ‘Summary of responses to the 2012 Fire Statistics User Survey’ which can be found on the Department’s website. This notes that many of the other comments from users are being addressed by access to incident records being delivered.
We are keen to hear from users to broaden our knowledge of all the various uses to which these statistics are out, and as to what other analyses would be valuable in the future. Please see the user interests form which can be downloaded from https://www.gov.uk/government/publications/fire-statistics.
Responsible statistician
Gavin Sayer 0303 444 2818
1 Until 2008, this was a UK publication. Since then it has covered Great Britain. This is because the new Incident Recording System with electronic data capture and transfer was adopted by Fire and Rescue Authorities across Great Britain in 2009.
12

Chapter 1 – Summary
Total number of fires and false alarms attended by fire and rescue authorities (Tables 1.1, 1.2 and Figure 1.1)
1.1In 2011-12, local authority fire and rescue services attended 584,500 fires or false alarms in Britain, 7% fewer than in 2010-11 (626,900). Within this total, fires decreased by 6% to
272,100, while false alarms fell by 8% to 312,400.
Table 1.1: Fires by location and false alarm, Great Britain, 2000/01-2011/12
Year |
Total |
|
|
|
|
|
|
False |
|
|
|
Building fires |
|
|
|
alarms |
|
|
fires & |
|
|
|
Outdoor |
Chimney |
||
|
|
|
|
|
|
|||
|
false |
Total |
|
|
|
Fires3 |
fires |
|
|
alarms Fires Total Dwellings2 |
Other |
. |
. |
|
|||
2000/01 |
895 |
445 |
107 |
67 |
40 |
324 |
14 |
450 |
2001/02 |
992 |
525 |
109 |
67 |
42 |
404 |
12 |
467 |
2002/03 |
949 |
503 |
98 |
60 |
38 |
395 |
10 |
447 |
2003/04 |
1,028 |
572 |
102 |
62 |
40 |
460 |
9 |
456 |
2004/05 |
845 |
412 |
93 |
57 |
36 |
311 |
8 |
433 |
2005/06 |
832 |
409 |
90 |
56 |
34 |
310 |
9 |
423 |
2006/07 |
838 |
411 |
86 |
54 |
32 |
318 |
8 |
426 |
2007/08 |
770 |
364 |
80 |
50 |
29 |
276 |
9 |
406 |
2008/09 |
694 |
309 |
74 |
47 |
26 |
225 |
11 |
385 |
2009/10 |
654 |
299 |
74 |
47 |
27 |
216 |
10 |
354 |
2010/11 |
627 |
288 |
74 |
46 |
28 |
204 |
10 |
339 |
2011/12 |
585 |
272 |
71 |
44 |
27 |
193 |
8 |
312 |
1Figures in thousand and figures are rounded and the components do not necessarily sum to the independently rounded totals.
2Includes caravans, houseboats, mobile homes and other non-permanent structures used solely as a permanent dwelling.
3Primary and secondary fires. See overleaf and explanatory notes 5 and 6 for the definition of a primary and secondary fire
1.2A total of 272,100 fires were attended in 2011-12, of which 44,300 (16%) were in dwellings. Findings from the 2004/05 Survey of English Housing on all outbreaks of fire experienced by households in England suggested that the fire and rescue service attend approximately one fifth of all domestic fires. This is because many of the fires recorded in the survey are minor and able to be put out by someone in the home, and therefore the fire and rescue service was not called. See ODPM Statistical Bulletin – “Fires in the home: Findings from the 2004/05 Survey of English Housing”. (See explanatory note 10 for further details.)
13

Figure 1.1: Fires by location group and chimney fires, Great Britain, 2000/01 – 2011/12
|
700,000 |
|
|
|
|
|
|
|
|
|
|
|
|
|
|
|
|
|
600,000 |
|
|
|
|
|
|
|
|
|
|
|
|
|
|
|
|
|
500,000 |
|
|
|
|
|
|
|
|
|
|
|
|
|
|
|
|
fires |
400,000 |
|
|
|
|
|
|
|
|
|
|
|
|
|
|
|
|
of |
|
|
|
|
|
|
|
|
|
|
|
|
|
|
|
|
|
|
|
|
|
|
|
|
|
|
|
|
|
|
|
|
|
|
|
Number |
300,000 |
|
|
|
|
|
|
|
|
|
|
|
|
|
|
|
|
|
|
|
|
|
|
|
|
|
|
|
|
|
|
|
|
|
|
|
200,000 |
|
|
|
|
|
|
|
|
|
|
|
|
|
|
|
|
|
100,000 |
|
|
|
|
|
|
|
|
|
|
|
|
|
|
|
|
|
0 |
|
|
|
|
|
|
|
|
|
|
|
|
|
|
|
|
|
2000/01 |
2 |
2002/03 |
|
/04 |
5 |
2005/06 |
|
7 |
8 |
|
9 |
|
0 |
|
1r |
p |
|
2001/0 |
|
2004/0 |
|
/0 |
2007/0 |
|
/0 |
|
/1 |
1 |
/12 |
|||||
|
|
03 |
6 |
8 |
9 |
2010/ |
|
||||||||||
|
|
00 |
|
00 |
|
00 |
|
|
1 |
||||||||
|
0 |
|
|
|
|
01 |
|||||||||||
|
2 |
|
2 |
|
2 |
|
2 |
|
|
||||||||
|
|
|
|
|
|
|
|
|
|
|
|
|
|
|
|
2 |
|


 Buildings
 Chimney Fires
  Road vehicles
 Other Outdoors
p=provisional; r= revised
1.3The number of building fires fell by 4% from 74,100 in 2010-11 to 71, 200 in 2011-12. This is the lowest figure recorded over the past decade. Within this category, dwelling fires fell by 4% to 44,300. Fires in buildings other than dwellings also fell, by 4% to 27,000.
1.4There were 193,000 outdoor fires2 in 2011-12. Of these 85,600 (44%) were refuse fires, 28,800 (15%) were road vehicle fires and 55,200 (29%) were grassland fires (including domestic garden, heath land and intentional straw and stubble burning). The remaining
23,700 (12%) were in other outdoor locations (including outdoor equipment/machinery or furniture).
1.5The number of chimney fires fell by 24% to 7,600 in 2011-12.
2 All fires – includes primary as well as secondary fires. For definition of Primary and Secondary fires, see overleaf and explanatory notes 5 and 6 for the definition of a primary and secondary fire
14

Definitions: primary fires, secondary, chimney fires, outdoor fires
“Primary” fires include all fires in buildings, vehicles and outdoor structures or any fire involving casualties, rescues, or fires attended by five or more appliances.
“Secondary” fires are the majority of outdoor fires including grassland and refuse fires unless they involve casualties or rescues, property loss or five or more appliances attend. They include fires in single derelict buildings.
Chimney fires are any fire in an occupied building where the fire was confined within the chimney structure (and did not involve casualties or rescues or attendance by five or more appliances). A false alarm is defined as an event in which the fire and rescue service believes they are called to a reportable fire and then find there is no such incident.
The term “outdoor fires” used in this Bulletin refers to primary and secondary fires in road vehicles, other outdoor property, derelict buildings and derelict vehicles and more minor refuse, grassland and intentional straw/stubble fires.
15

Causes of fires
Interpretation of trends in accidental and deliberate fires
1.6Fires are categorised as: accidental, deliberate or unknown, according to the probable cause, as observed at the scene. Those recorded as ‘unknown’ are grouped together with
‘accidental’ for all outputs.
Table 1.2: Primary fires by cause and location of fire, Great Britain, 2000/012011/12
|
|
|
|
|
Location |
|
|
Cause/Year |
Total1 |
Dwellings |
Total other |
Other buildings |
Road |
Other |
|
|
|||||||
|
|
|
buildings |
|
|
vehicles |
outdoors |
|
|
|
|
|
|
|
|
|
|
|
|
Other |
Non- |
|
|
|
|
|
|
residential 3 |
residential |
|
|
Accidental fires2 |
|
|
|
|
|
|
|
2000/01 |
103.5 |
54.1 |
22.8 |
.. |
.. |
23.0 |
3.6 |
2001/02 |
100.9 |
52.2 |
22.8 |
.. |
.. |
22.0 |
3.9 |
2002/03 |
92.2 |
47.1 |
21.5 |
.. |
.. |
19.6 |
4.0 |
2003/04 |
94.1 |
48.5 |
22.1 |
.. |
.. |
19.1 |
4.4 |
2004/05 |
87.6 |
46.1 |
21.1 |
.. |
.. |
17.1 |
3.4 |
2005/06 |
87.0 |
46.1 |
20.5 |
.. |
.. |
16.8 |
3.6 |
2006/07 |
84.7 |
44.2 |
19.4 |
.. |
.. |
16.9 |
4.2 |
2007/08 |
78.7 |
41.8 |
18.0 |
.. |
.. |
15.3 |
3.5 |
2008/09 |
74.9 |
39.6 |
16.9 |
.. |
.. |
14.9 |
3.5 |
2009/10 |
79.0 |
40.3 |
18.0 |
.. |
.. |
16.5 |
4.2 |
2010/11 |
75.8 |
38.7 |
17.6 |
3.2 |
14.4 |
15.5 |
3.9 |
2011/12p |
72.4 |
37.6 |
16.8 |
2.9 |
13.9 |
14.0 |
3.9 |
Deliberate |
|
|
|
|
|
|
|
fires2 |
106.0 |
13.3 |
17.1 |
.. |
.. |
67.9 |
7.7 |
2000/01 |
|||||||
2001/02 |
120.6 |
14.3 |
19.4 |
.. |
.. |
77.8 |
9.1 |
2002/03 |
111.5 |
12.6 |
16.7 |
.. |
.. |
73.4 |
8.9 |
2003/04 |
107.8 |
13.2 |
18.3 |
.. |
.. |
67.0 |
9.2 |
2004/05 |
84.4 |
11.0 |
14.7 |
.. |
.. |
50.8 |
7.9 |
2005/06 |
74.8 |
9.8 |
13.3 |
.. |
.. |
44.7 |
7.1 |
2006/07 |
67.7 |
9.5 |
12.4 |
.. |
.. |
38.6 |
7.2 |
2007/08 |
57.8 |
8.6 |
11.1 |
.. |
.. |
32.3 |
5.8 |
2008/09 |
49.7 |
7.9 |
9.2 |
.. |
.. |
27.5 |
5.2 |
2009/10 |
43.6 |
6.9 |
8.5 |
.. |
.. |
22.0 |
6.2 |
2010/11 |
36.1 |
6.3 |
7.4 |
0.4 |
7.0 |
17.1 |
5.3 |
2011/12 |
32.5 |
5.9 |
7.3 |
0.4 |
6.9 |
13.9 |
5.4 |
1Figures are expressed in thousand and figures are rounded and the components do not necessarily sum to the independently rounded totals.
2Deliberate fires include fires where deliberate ignition was merely suspected. Accidental fires include those where the cause was
3includes residential care homes, hotel/motel, hostels (for homeless people), boarding school
accommodation and sheltered housing
.. ‘not known’ or ‘unspecified’ (see explanatory notes).
16

Accidental primary fires (Table 1.2, Figure 1.2)
1.7The total number of accidental primary fires in 2011-12 decreased by 5% to 72,400. Of the total accidental fires, 37,600 fires (52%) were in dwellings, 16,800 (23%) in other buildings and 14,000 (19%) in road vehicles. Accidental primary fires have been on a steady decline since 2000/01 and the 2011/12 figure declined by nearly one third since the decade peak in 2000/01.
The key changes in 2011-12 were:
•Accidental fires in dwellings fell by 3% to 37,600
•Accidental fires in other buildings fell by 5% to 16,800
•Accidental fires in road vehicles also fell, down 10% to 14,000.
Figure 1.2: Accidental primary fires by location group, Great Britain, 2000/01-2011/12
|
120000 |
|
|
|
|
|
|
|
|
|
|
|
|
|
|
|
|
|
|
|
100000 |
|
|
|
|
|
|
|
|
|
|
|
|
|
|
|
|
|
|
of fires |
80000 |
|
|
|
|
|
|
|
|
|
|
|
|
|
|
|
|
|
|
60000 |
|
|
|
|
|
|
|
|
|
|
|
|
|
|
|
|
|
|
|
Number |
|
|
|
|
|
|
|
|
|
|
|
|
|
|
|
|
|
|
|
40000 |
|
|
|
|
|
|
|
|
|
|
|
|
|
|
|
|
|
|
|
|
20000 |
|
|
|
|
|
|
|
|
|
|
|
|
|
|
|
|
|
|
|
0 |
|
|
|
|
|
|
|
|
|
|
|
|
|
|
|
|
|
|
|
2000/01 |
02 |
|
02/03 |
/04 |
|
04/05 |
/06 |
|
7 |
2007/08 |
09 |
|
09/10 |
|
|
1r |
|
2p |
|
|
|
0 |
|
|
|
|
||||||||||||
|
|
|
6/ |
|
|
|
1 |
|
|||||||||||
|
1/ |
|
003 |
|
2005 |
|
8/ |
|
|
0/ |
|
|
/1 |
||||||
|
00 |
0 |
0 |
00 |
|
00 |
0 |
1 |
|
|
11 |
||||||||
|
2 |
2 |
|
2 |
2 |
|
2 |
|
2 |
2 |
|
20 |
|
|
20 |
|
|||
|
|
|
|
|
|
|
|
|
|
|
|
|
|
|
|
|
|
||
|
|
Dwellings |
|
Other buildings |
|
Road vehicles |
|
Other outdoors |
|
|
|
|
|
||||
|
|
|
|
|
||||
|
|
|
|
|
|
|
|
|
p= provisional ; r = revised
17

Deliberate primary fires (Tables 1.2 and 14 and Figure 1.3)
1.8The number of deliberate primary fires has been on a steady decline since its peak in
2001/02. In 2011-12, the number of deliberate fires was 32,500 – declined by 10% from 36,100 in 2010-11.
There was a decline in deliberate fires in all locations:
•Deliberate fires in dwellings fell by 7% to 5,900
•Deliberate fires in other buildings fell by 1% to 7,300
•Deliberate fires in road vehicles also fell by 19% to 14,000.
1.9Of the 13,200 deliberate fires in buildings recorded in 2011-12, more than half (56%) occurred in buildings other than dwellings. Of these 7,300 deliberate fires in other buildings, over a third occurred in private garages or sheds, green houses or summer houses. Chapter 3 contains further details of deliberate fires in other buildings.
Figure 1.3: Deliberate fires by location group, Great Britain, 2000/01 – 2011/12
|
140,000 |
|
|
|
|
|
|
|
|
|
|
|
|
|
120,000 |
|
|
|
|
|
|
|
|
|
|
|
|
|
100,000 |
|
|
|
|
|
|
|
|
|
|
|
|
fires |
80,000 |
|
|
|
|
|
|
|
|
|
|
|
|
of |
|
|
|
|
|
|
|
|
|
|
|
|
|
|
|
|
|
|
|
|
|
|
|
|
|
|
|
Number |
60,000 |
|
|
|
|
|
|
|
|
|
|
|
|
|
|
|
|
|
|
|
|
|
|
|
|
|
|
|
40,000 |
|
|
|
|
|
|
|
|
|
|
|
|
|
20,000 |
|
|
|
|
|
|
|
|
|
|
|
|
|
0 |
|
|
|
|
|
|
|
|
|
|
|
|
|
2000/01 |
2001/02 |
2002/03 |
2003/04 |
2004/05 |
/06 |
|
06/07 |
007/08 |
008/09 |
009/10 |
2010/11r |
2011/12p |
|
2005 |
20 |
|||||||||||
|
|
2 |
2 |
2 |
|
Dwellings |
Other buildings |
|
Road vehicles |
|
Other outdoors |
|
|
|
p = provisional; r = revised
18

Fatalities from fires (Table 6, 17a, 26 and Figure 1.4)
1.10In 2011-12, there were 380 fire-related fatalities in Britain, down by 24 from 404 in 2010-11.
There were no fire-related fire fighter fatalities in 2011-12. There were two such fatalities in 2010-11. The long term trend in fire fatalities has been downward.
Figure 1.4: Fatalities from fires, Great Britain, 2000/01 – 2011/12
|
1200 |
|
|
|
|
|
|
|
|
|
|
|
|
|
|
|
|
|
|
|
|
|
|
|
|
|
|
|
|
|
|
|
|
|
|
|
|
|
|
|
|
|
|
|
|
|
|
|
|
|
|
|
1000 |
|
|
|
|
|
|
|
|
|
|
|
|
|
|
|
|
|
|
|
|
|
|
|
|
|
|
|
|
|
|
|
|
|
|
|
|
|
|
|
|
|
|
|
|
|
|
|
|
|
|
deaths |
800 |
|
|
|
|
|
|
|
|
|
|
|
|
|
|
|
|
|
|
|
|
|
|
|
|
|
|
|
|
|
|
|
|
|
|
|
|
|
|
|
|
|
|
|
|
|
|
|
|
|
|
|
|
|
|
|
|
|
|
|
|
|
|
|
|
|
|
|
|
|
|
|
|
|
|
|
|
|
|
|
|
|
|
|
|
|
|
|
|
|
|
|
|
|
|
|
|
|
|
|
|
|
|
related |
600 |
|
|
|
|
|
|
|
|
|
|
|
|
|
|
|
|
|
|
|
|
|
|
|
|
|
|
|
|
|
|
|
|
|
|
|
|
|
|
|
|
|
|
|
|
|
|
|
|
|
|
|
|
|
|
|
|
|
|
|
|
|
|
|
|
|
|
|
|
|
|
|
|
|
|
|
|
|
|
|
|
|
|
|
|
|
|
|
|
|
|
|
|
|
|
|
|
|
|
|
|
|
|
Fire |
400 |
|
|
|
|
|
|
|
|
|
|
|
|
|
|
|
|
|
|
|
|
|
|
|
|
|
|
|
|
|
|
|
|
|
|
|
|
|
|
|
|
|
|
|
|
|
|
|
|
|
|
|
|
|
|
|
|
|
|
|
|
|
|
|
|
|
|
|
|
|
|
|
|
|
|
|
|
|
|
|
|
|
|
|
|
|
|
|
|
|
|
|
|
|
|
|
|
|
|
|
|
|
|
|
200 |
|
|
|
|
|
|
|
|
|
|
|
|
|
|
|
|
|
|
|
|
|
|
|
|
|
|
|
|
|
|
|
|
|
|
|
|
|
|
|
|
|
|
|
|
|
|
|
|
|
|
|
0 |
|
|
|
|
|
|
|
|
|
|
|
|
|
|
|
|
|
|
|
|
|
|
|
|
|
|
|
|
|
|
|
|
|
|
|
|
|
|
|
|
|
|
|
|
|
|
|
|
|
|
|
|
|
2 |
|
|
4 |
|
|
6 |
|
|
8 |
|
|
|
0 |
|
|
|
2 |
|
|
4 |
|
|
6 |
|
|
8 |
|
|
0 |
|
|
2 |
|
|
4 |
|
|
|
8 |
|
|
0 |
|
2p |
||||
|
|
8 |
|
8 |
|
8 |
|
8 |
|
|
9 |
|
|
9 |
|
9 |
|
9 |
|
/9 |
|
|
/0 |
|
|
/0 |
|
|
/0 |
|
|
|
0 |
|
1 |
|
|||||||||||||||
|
1/ |
|
3/ |
|
5/ |
|
|
7/ |
|
|
9/ |
|
|
1/ |
|
3/ |
|
|
5/ |
|
|
|
|
|
|
|
|
|
|
7/ |
|
9/ |
|
1 |
|||||||||||||||||
|
|
|
|
|
|
|
|
|
|
|
|
|
7 |
|
|
9 |
|
|
1 |
|
|
3 |
|
|
|
|
|
1/ |
|
||||||||||||||||||||||
|
198 |
|
198 |
|
8 |
|
|
8 |
|
8 |
|
|
9 |
|
9 |
|
|
9 |
199 |
|
|
199 |
|
|
200 |
|
|
200 |
|
|
|
00 |
|
200 |
|
|
|
||||||||||||||
|
|
|
19 |
|
|
19 |
|
19 |
|
|
19 |
|
|
19 |
|
|
19 |
|
|
|
|
|
|
|
|
|
2 |
|
|
|
201 |
|
|||||||||||||||||||
|
|
|
|
|
|
|
|
|
|
|
|
|
|
|
|
|
|
|
|
|
2005/06 |
|
|
|
|
|
|||||||||||||||||||||||||
p= provisional
19

Location (Tables 6 and 26, Figure 1.5)
1.11The majority of fire-related fatalities (over three-quarters) occur in dwelling fires. In 2011-
12, 287 fatalities were recorded in dwellings, 31 fewer than in 2010-11 and 458 fewer than 30 years ago in 1981-82. In 2011-12, there were 6.6 fatalities per 1,000 dwelling fires, compared with 1 per 1,000 fires in other buildings and 1.3 per 1,000 road vehicle fires.
Figure 1.5: Fatalities from fires by location group, Great Britain, 2000/01 – 2011/12
|
700 |
|
|
|
|
|
|
|
|
|
|
|
|
|
|
|
|
|
|
|
|
|
|
|
|
|
|
|
|
|
600 |
|
|
|
|
|
|
|
|
|
|
|
|
|
|
|
|
|
|
|
|
|
|
|
|
|
|
|
|
deaths |
500 |
|
|
|
|
|
|
|
|
|
|
|
|
|
|
|
|
|
|
|
|
|
|
|
|
|
|
|
|
400 |
|
|
|
|
|
|
|
|
|
|
|
|
|
|
|
|
|
|
|
|
|
|
|
|
|
|
|
|
|
of |
|
|
|
|
|
|
|
|
|
|
|
|
|
|
|
|
|
|
|
|
|
|
|
|
|
|
|
|
|
Number |
300 |
|
|
|
|
|
|
|
|
|
|
|
|
|
|
|
|
|
|
|
|
|
|
|
|
|
|
|
|
200 |
|
|
|
|
|
|
|
|
|
|
|
|
|
|
|
|
|
|
|
|
|
|
|
|
|
|
|
|
|
|
|
|
|
|
|
|
|
|
|
|
|
|
|
|
|
|
|
|
|
|
|
|
|
|
|
|
|
|
|
|
100 |
|
|
|
|
|
|
|
|
|
|
|
|
|
|
|
|
|
|
|
|
|
|
|
|
|
|
|
|
|
0 |
|
|
|
|
|
|
|
|
|
|
|
|
|
|
|
|
|
|
|
|
|
|
|
|
|
|
|
|
|
|
1 |
|
|
2 |
|
|
3 |
|
|
4 |
|
5 |
|
6 |
|
7 |
|
8 |
|
9 |
|
0 |
|
|
1r |
|
|
2p |
|
0 |
|
0 |
|
0 |
|
0 |
0 |
0 |
0 |
|
/0 |
|
/0 |
|
9/1 |
|
1 |
|
|
|||||||||
|
2000/ |
|
|
01/ |
|
|
02/ |
|
|
03/ |
|
2004/ |
|
2005/ |
|
2006/ |
|
|
|
|
|
10/ |
|
|
1 |
||||
|
|
20 |
|
20 |
|
20 |
|
|
|
|
|
07 |
|
08 |
0 |
|
|
|
11/ |
|
|||||||||
|
|
|
|
|
|
|
|
|
|
|
20 |
|
20 |
|
20 |
|
0 |
|
20 |
|
|||||||||
|
|
|
|
|
|
|
|
|
|
|
|
|
|
2 |
|
|
|
|
|||||||||||
|
|
Dwellings |
|
Other buildings |
|
Road vehicles |
|
Other outdoors |
|
|
|
|
|
||||
|
|
|
|
|
|
|
|
|
p= provisional; r= revised
20
Cause of death (Table 7, Figure 1.6)
1.12The most common identified cause of death from a fire incident is being overcome by gas or smoke or toxic fumes. In 2011-12, fire and rescue services reported 380 fire related fatalities of which 130 people died because of this cause, accounting for 34% of all fatalities. A further 74 (19%) fatalities were attributed jointly to both burns and being overcome by gas or smoke, whilst 94 (25%) were due to severe burns alone.
Figure 1.6: Fatalities by cause, Great Britain, 2011/12p
Other
8%
Unspecified 14%
Overcome by gas, smoke or toxic fumes
34%
Combination of burns and overcome by gas/smoke 19%
Burns -severe
25%
‘Other’ includes head/chest or other physical injuries, fractures, shock or other medical conditions
21

Fatality rates by age and gender (Tables 5b, 17a, 17b and 1.3)
1.13The fire fatality rate is defined as the number of fatalities per million population, abbreviated henceforth to pmp.
Table 1.3: Fatal casualties and rates from fires by age and gender, Great Britain, 2006/07-2011/12 1
|
|
|
Number of fatalities |
|
|
|
|
Rate1 |
|
|
|||||
Year |
2006/ |
2007/ |
2008/ |
2009/ |
2010/ |
2011/ |
2006/ |
2007/ |
2008/ |
2009/ |
2010/ |
2011/ |
|||
07 |
08 |
09 |
10 |
11 |
12 |
07 |
08 |
09 |
10 |
11 |
12 |
||||
|
|
||||||||||||||
Age of victims |
|
|
|
|
|
|
|
|
|
|
|
|
|
||
under 1 |
1 |
4 |
3 |
- |
5 |
3 |
1 |
5 |
4 |
- |
7 |
4 |
|||
1 – 4 |
15 |
7 |
6 |
- |
6 |
8 |
6 |
3 |
2 |
- |
2 |
3 |
|||
5 – 10 |
5 |
3 |
8 |
- |
12 |
7 |
1 |
1 |
2 |
- |
3 |
2 |
|||
11 – 16 |
5 |
4 |
5 |
- |
0 |
3 |
1 |
1 |
1 |
- |
0 |
1 |
|||
17 |
– 24 |
23 |
28 |
24 |
- |
17 |
15 |
4 |
4 |
4 |
- |
3 |
2 |
||
25 |
– 29 |
19 |
24 |
15 |
- |
10 |
10 |
5 |
6 |
4 |
- |
2 |
2 |
||
30 |
– 59 |
156 |
190 |
155 |
- |
170 |
156 |
6 |
8 |
6 |
- |
7 |
6 |
||
60 |
– 64 |
27 |
30 |
24 |
- |
33 |
25 |
9 |
9 |
7 |
- |
8 |
7 |
||
65 |
– 79 |
84 |
89 |
88 |
- |
77 |
76 |
12 |
13 |
13 |
- |
10 |
10 |
||
80 |
& over |
74 |
66 |
74 |
- |
74 |
77 |
28 |
25 |
27 |
- |
26 |
27 |
||
Unspecified |
21 |
13 |
10 |
- |
.. |
.. |
.. |
.. |
.. |
.. |
.. |
.. |
|||
All ages2 |
430 |
458 |
412 |
416 |
404 |
380 |
7 |
8 |
7 |
7 |
7 |
6 |
|||
Gender |
|
|
|
|
|
|
|
|
|
|
|
|
|
||
Males(all |
275 |
284 |
249 |
- |
241 |
237 |
10 |
10 |
9 |
- |
8 |
8 |
|||
ages) |
|||||||||||||||
|
|
|
|
|
|
|
|
|
|
|
|
|
|||
Females (all |
151 |
174 |
158 |
- |
160 |
140 |
5 |
6 |
5 |
- |
5 |
5 |
|||
ages) |
|||||||||||||||
|
|
|
|
|
|
|
|
|
|
|
|
|
|||
Not specified |
4 |
0 |
5 |
- |
3 |
3 |
.. |
.. |
.. |
.. |
.. |
.. |
|||
1The per million population rates for all years take into account the revised mid-year population estimates published by the Office for National Statistics in June 2011 (see explanatory notes).
2Includes some fatal casualties, whose gender was not recorded.
-Data not available due to incomplete record from one fire and rescue authority in 2009/10
.. Not specified
1.14In 2011-12 the fatality rate for ages under thirty year old is much below average, and higher than average for ages between 65 and 79, and by far the highest in the age group 80 and over (27 per million population). Fatality rates are higher for males than for females (the rates are 8 per million population and 5 per million population for males and females respectively in 2011-12).
22

Non-fatal casualties
Location (Table 6, Figure 1.7)
1.15Dwelling fires were responsible for the majority of fatal (76%) and non-fatal casualties
(79%) in 2011-12. In 2011-12, there were 8,900 non-fatal casualties in dwelling fires. This is 2% less than the previous year.
Figure 1.7: Non-fatal casualties by location group, Great Britain, 2000/01-2011/12
|
18,000 |
|
|
|
|
|
|
|
|
|
|
|
|
|
|
|
|
|
|
|
casualtiesfatal |
16,000 |
|
|
|
|
|
|
|
|
|
|
|
|
|
|
|
|
|
|
|
10,000 |
|
|
|
|
|
|
|
|
|
|
|
|
|
|
|
|
|
|
|
|
|
14,000 |
|
|
|
|
|
|
|
|
|
|
|
|
|
|
|
|
|
|
|
|
12,000 |
|
|
|
|
|
|
|
|
|
|
|
|
|
|
|
|
|
|
|
non- |
8,000 |
|
|
|
|
|
|
|
|
|
|
|
|
|
|
|
|
|
|
|
of |
|
|
|
|
|
|
|
|
|
|
|
|
|
|
|
|
|
|
|
|
|
|
|
|
|
|
|
|
|
|
|
|
|
|
|
|
|
|
|
|
|
Number |
6,000 |
|
|
|
|
|
|
|
|
|
|
|
|
|
|
|
|
|
|
|
|
|
|
|
|
|
|
|
|
|
|
|
|
|
|
|
|
|
|
|
|
|
4,000 |
|
|
|
|
|
|
|
|
|
|
|
|
|
|
|
|
|
|
|
|
2,000 |
|
|
|
|
|
|
|
|
|
|
|
|
|
|
|
|
|
|
|
|
0 |
|
200 |
|
200 |
|
200 |
|
2004 |
|
2005 |
|
2006/07 2007/08 2008/09 |
200 |
|
|
|
|
011/ |
|
|
200 |
/01 |
/02 |
/03 |
/04 |
/05 |
/06 |
/10 |
|
/11r |
2p |
|||||||||
|
0 |
1 |
2 |
3 |
|
|
|
|
|
9 |
|
|
1 |
|||||||
|
|
|
|
|
|
|
|
|
|
|
|
|
|
|
|
|
0 |
|
|
|
|
|
|
|
|
|
|
|
|
|
|
|
|
|
|
|
201 |
2 |
|
||
|
|
|
|
|
Dwellings |
|
|
|
|
|
Other-residential |
|
|
Non-residential |
||||||
|
|
|
|
|
Other buildings |
|
|
|
Road vehicles |
|
|
Other outdoors |
||||||||
|
|
|
p=provisional; r=revised |
|
|
|
|
|
|
|
|
|
|
|
||||||
1.16Similarly, dwelling fires had more non-fatal casualties per 1,000 fires than any other location. In 2011-12, there were 205 non-fatal casualties per 1,000 dwelling fires, compared with 99 per 1,000 other residential fires, 45 per 1,000 non-residential fires and 22 per 1,000 road vehicle fires.
23

Severity of injury (Figure 1.8)
1.17The introduction of the new Incident Recording System (IRS) has led to a change in the way that non-fatal casualties are categorised. These changes to categories are explained in the section on ‘Comparability’ in the Explanatory Notes at the back of this publication. In
2011-12 the most frequent non-fatal injury severity recorded was ‘victim to hospital with slight injuries’, accounting for 37% of the total.
Figure 1.8: Non-fatal casualties from fires by severity, Great Britain, 2000/01-2011/12
|
16,000 |
|
|
|
|
|
|
|
|
|
|
|
|
casualties |
14,000 |
|
|
|
|
|
|
|
|
|
|
|
|
12,000 |
|
|
|
|
|
|
|
|
|
|
|
|
|
10,000 |
|
|
|
|
|
|
|
|
|
|
|
|
|
8,000 |
|
|
|
|
|
|
|
|
|
|
|
|
|
-fatal |
|
|
|
|
|
|
|
|
|
|
|
|
|
6,000 |
|
|
|
|
|
|
|
|
|
|
|
|
|
non |
|
|
|
|
|
|
|
|
|
|
|
|
|
4,000 |
|
|
|
|
|
|
|
|
|
|
|
|
|
Alll |
|
|
|
|
|
|
|
|
|
|
|
|
|
2,000 |
|
|
|
|
|
|
|
|
|
|
|
|
|
|
|
|
|
|
|
|
|
|
|
|
|
|
|
|
0 |
|
|
|
|
|
|
|
|
|
|
|
|
|
|
00/01 |
2001/02 |
2002/03 |
2003/04 |
2004/05 |
/06 |
2006/07 |
|
07/08 |
2008/09 |
2009/10 |
2010/11r 2011/12p |
|
20 |
2005 |
20 |
|
Non-fatal casualties |
|
Hospital severe |
|
Hospital slight |
|
|
|
|||
|
|
|
|||
|
First Aid |
|
Precautionary Checks |
|
|
|
|
|
|
||
|
|
|
|
p=provisional; r= revised
Nature of injury (Table 8, Figure 1.9)
1.18Other types of injuries sustained included:
•Suffering from the effects of gas or smoke, totaling about 2,927 and accounting for 26% of all non-fatal casualties in 2011-12
•Burn injuries only (including severe and slight injuries severities) totaled 1,148 (10% of all non-fatal casualties).
24

•Suffering from both burns and having been overcome by gas or smoke totaled 194 (2% of all non-fatal casualties in 2011-12).
Figure 1.9: Non-fatal casualties from fires (excluding firefighter casualties) by nature of injury1, Great Britain, 2000/01-2011/12
Number of non-fatal casualties
16,000
14,000
12,000
10,000
8,000
6,000
4,000
2,000 |
|
|
|
|
|
|
|
|
|
|
|
0 |
|
|
|
|
|
|
|
|
|
|
|
2000/01 |
2001/02 |
2002/03 |
2003/04 |
2004/05 |
2005/06 |
2006/07 |
2007/08 |
2008/09 |
2009/10 |
2010/11r |
2011/12p |
|
Burns |
|
Overcome by gas or smoke |
|
|
||
|
|
||
|
Burns and overcome by gas or smoke |
|
Physical injuries |
|
|
||
|
Shock only |
|
Unspecified & Other |
|
|
||
|
|
||
|
Precautionary check up |
|
First Aid |
|
|
||
|
|
1 There was no category for ‘first aid’ prior to the introduction of the new Incident Recording System (see explanatory note 3) 2009/10 figure was not shown due to incomplete record from one fire and rescue authority
p=provisional; r= revised
25

Type of fires and country
Primary fires (Tables 5a and Figure 1.9)
1.19Britain experienced a 6% decline in the number of primary fires attended by fire and rescue services in 2011-12 (see explanatory note 7 for definition of a primary fire). Among the countries in Britain, Wales experienced much more decline compared to England and Scotland. In England, the number fell by 6% from 92,300 in 2010-11 to 86,800 in 2011-12, while Wales saw a 11% decline to 5,700 in 2011-12. The number of primary fires in Scotland fell by 6% to 12,400.
Figure 1.10: Primary fires by country and location, 2011/12
60
Percentage of fires
50 |
|
|
|
40 |
|
|
|
30 |
|
|
|
20 |
|
|
|
10 |
|
|
|
0 |
|
|
|
England |
Wales |
|
Scotland |
Dwellings |
Other buildings |
Road vehicles |
Other |
1.20The location profile of primary fires differs between countries. In Scotland, half of all primary fires were in dwellings, compared with smaller proportions in, England (41%) and in Wales (35%). Road vehicle fires exhibited a different pattern. In Wales, road vehicle fires constituted 32% of primary fires; in England these constituted 27%, but only made up 19% of the total in Scotland.
Secondary fires (Table 5a)
1.21England recorded an increase in secondary fires in 2011-12 compared to 2010-11, while both Wales and Scotland experienced declines in secondary fires (see explanatory note 7 for definition of a secondary fire). In England, the figure was 2% higher at 130,900, while in Wales the decrease was 25% (to 10,200) and the decrease in Scotland was 23% (to 18,600).
26
Chimney fires (Tables 5a)
1.22Britain experienced a fall (24%) in chimney fires in 2011-12. England, Wales and Scotland had 25%, 22% and 24% declines in chimney fires compared with 2010-11.
Fatalities casualties and rates by country and fire and rescue service area (Table 5b and Table 22a)
1.23There were 380 fire-related fatalities in Britain in 2011-12, down by 24 fatalities from 404 in 2010-11. The fatality rate in fires in Britain in 2011-12 was 6.2 per million population (pmp).
Fatality rates differ between countries:
•Scotland has had a consistently higher fatality rate over the years compared to the rest of Britain, currently at 10.8 pmp, up from 10.0 pmp in 2010-11.
•The rate in Wales in 2011-12 was 6.2 pmp, down from 7.0 pmp in 2010-11 to.
•In England the rate was 5.7 pmp in 2011-12, down 6.3 pmp in 2010-11.
Non-fatal casualties and rates by country and rescue service area (Table 5b and Table 22b)
1.24The number of non-fatal casualties in England fell by 1% in 2011-12 to 9,300 from 9,400 in 2010-11 and in Wales the figure fell by 4% to 580 from 610 in 2010-11. Meanwhile non-fatal casualties in Scotland rose by 5% to 1,400 in 2011-12.
1.25The non-fatal casualty rate per million population (pmp) declined from 187 in 2010-11 to 184 in 2011-12. This is the second lowest rate over the past 12 years. By country, the non-fatal casualty rates were:
•England, 175 pmp in 2011-12, down from 180 pmp in 2010-11
•Wales, 190 pmp in 2011-12, down from 202 pmp in 2010-11
•Scotland, 266 pmp in 2011-12, up from 254 pmp in 2010-11
•Some of the highest non-fatality rates occurred in England were in the metropolitan fire and rescue service areas, with Greater Manchester (420 per million population) 70% higher than any other metropolitan area. The highest rate recorded by an English nonmetropolitan fire and rescue service was in Lancashire (332 pmp). The highest casualty rate in Wales was in North Wales (331 pmp)
27
Chapter 2 – Dwellings
Introduction (Tables 2 and 6)
2.1Dwelling fires account for nearly two-thirds of all building fires and 88% of all casualties occur in building fires. (See explanatory notes for further information on the definitions of primary and dwelling fires.) Overall, the number of dwelling fires fell by 3% to 43,500 in 2011-12, continuing the downward trend since 2000-01. The number of fatalities in such fires was 287, down by 31 in 2011-12 compared to the previous year. There was a 2% fall compared with 2010-11 in the number of non-fatal casualties in fires in dwellings to 8,930.
Accidental fires (Table 2)
2.2Most of fires in dwellings are accidental (87%) in 2011-12. The 2011-12 figure is the lowest number of such fires recorded in more than a decade.
Cause of fire (Table 2)
2.3The main cause of accidental fires in dwellings remains the misuse of equipment or appliances, with 14,700 cases recorded in 2011-12, little change (1 % fewer) than in 201112. This is the lowest figure since 2000-01. Other changes in accidental dwelling fires since 2000-01 include:
•Chip/fat pan fires have fallen by over three quarters in ten years to 2,600.
•Instances of playing with fire have fallen by nearly half in the last decade.
•Incidences of placing articles too close to heat or fire have fallen by one fifth in the last decade.
Source of ignition (Figure 2.1 and Table 3)
2.4This section looks in more detail at the source of the flame, spark or heat that first ignited the fire. This is related to the cause of the fire, and for many sources of ignition there was only one major cause responsible for the fire. For example, for most fires in which the source of ignition was smokers’ materials the cause was most likely to be careless handling of fire or hot substances.
2.5Cooking appliances were the main sources of ignition in accidental dwelling fires (over half in 2011-12). Fires from this source show a continual fall of around a third from the peak of 32,000 in 2000-01.
28
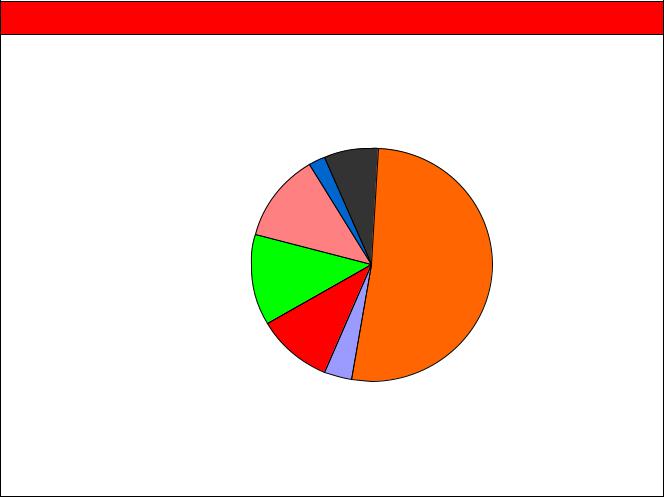
Figure 2.1: Sources of Ignition in accidental fires in dwellings, Great Britain, 2011/12
Smokers' materials
7%
Un-specified 2%
Other
12%
Other electrical |
Cooking appliances |
appliances |
52% |
13% |
|
Electrical distribution 10%
Space heating appliances 4%
Note: Other includes mainly matches, lighters, blowlamps, wielding, and candles
2.6Other key changes from 2000-01 were:
•Fires where the source of ignition was smokers’ materials (i.e. cigarettes, cigars or pipe tobacco) fell by around one third;
•Candle fire totals are now around a half less than the 2000-01 figure.
Casualties from accidental fires (Tables 10 and 11)
2.7Of the 287 fatalities in dwellings in 2011-12, 244 (85%) were of accidental causes. The number of fatalities in accidental home fires has reduced by one third from 363 in 2000-01.
Fatalities by cause of fire (Figure 2.2 and Table 10)
2.8Once again, the leading cause of fatal accidental dwelling fires was careless handling of fire or hot substances (mostly cigarettes which accounted 85 fatalities). This cause now claimed over 1,200 fatalities in accidental dwelling fires in Britain in the last 10 years. Time series data shows a general downward trend in such fatalities over the last decade.
29
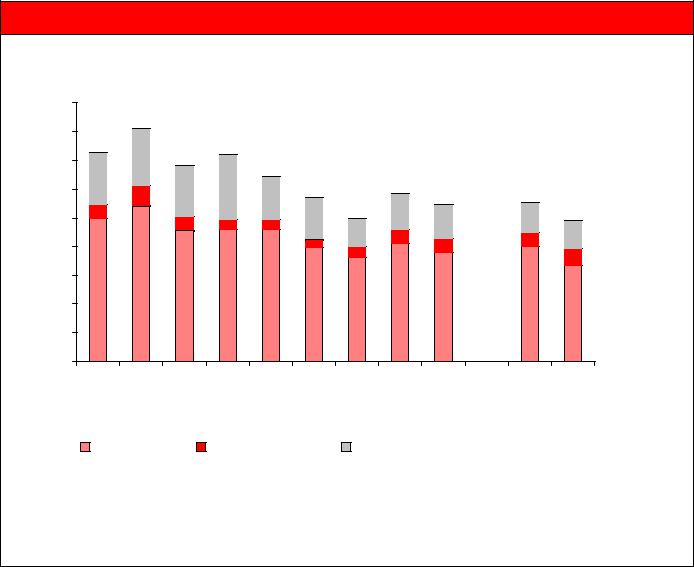
Figure 2.2: Fatalities from accidental dwelling fires by cause, Great Britain, 2000/01 – 2011/12
|
450 |
|
|
|
|
|
|
|
|
|
|
|
|
|
|
|
|
|
400 |
|
|
|
|
|
|
|
|
|
|
|
|
|
|
|
|
|
350 |
|
|
|
|
|
|
|
|
|
|
|
|
|
|
|
|
deaths |
300 |
|
|
|
|
|
|
|
|
|
|
|
|
|
|
|
|
250 |
|
|
|
|
|
|
|
|
|
|
|
|
|
|
|
|
|
of |
|
|
|
|
|
|
|
|
|
|
|
|
|
|
|
|
|
200 |
|
|
|
|
|
|
|
|
|
|
|
|
|
|
|
|
|
Number |
|
|
|
|
|
|
|
|
|
|
|
|
|
|
|
|
|
150 |
|
|
|
|
|
|
|
|
|
|
|
|
|
|
|
|
|
|
|
|
|
|
|
|
|
|
|
|
|
|
|
|
|
|
|
|
100 |
|
|
|
|
|
|
|
|
|
|
|
|
|
|
|
|
|
50 |
|
|
|
|
|
|
|
|
|
|
|
|
|
|
|
|
|
0 |
|
|
|
|
|
|
|
|
|
|
|
|
|
|
|
|
|
0/01 |
|
02 |
2002/03 |
|
04 |
2004/05 |
|
06 |
6/07 |
|
8 |
8/09 |
10 |
|
1r |
12p |
|
|
|
|
0 |
1 |
||||||||||||
|
200 |
2001/ |
|
2003/ |
|
2005/ |
|
200 |
2007/ |
|
200 |
2009/ |
0/ |
|
1/ |
||
|
|
|
|
|
201 |
|
201 |
||||||||||
|
|
Human factors |
Non-human factors |
Other/unspecified |
|
|
|
||||||||||
2009/10 figure was not shown due to incomplete record from one fire and rescue authority
p= provisional; r = revised
2.9Other key changes in the number of fatal casualties by cause of fire between 2010-11 and
2011-12 were:
•Fatalities from placing articles too close to heat fell by 2 from 39 to 37 in 2011-12;
•Faulty appliances and leads accounted for 19 fatalities, down from 20 in 2010-11;
•Fatalities due to the chip/fat pan slightly up from 9 to 12 in 2011-12 (however, the current figure is less than half the 2000-01 figure).
Fatalities and rates by source of ignition of fire (Tables 2.1 and 11)
2.10Smokers’ materials (i.e. cigarettes, cigars or pipe tobacco) were the most frequent source of ignition causing accidental dwelling fire fatalities, accounting for over a third of all accidental dwelling fire fatalities in 2011-12. For every 1,000 accidental dwelling fires where smokers’ materials were the source of ignition, 31 people were killed in 2011-12.
Fatalities from this source have been declining since its peak of 144 in 2001-02.
30
2.11Fires started in cooking appliances were responsible for around 14% of all accidental dwelling fire fatalities. There were 33 such fatalities in 2011-12. For every 1,000 fires started in cooking appliances in 2011-12, there were only 2 fatalities. This could reflect the relatively minor nature of many cooking-related fires and the fact that many cooking fires occur when the victims are alert at the time of the fire.
2.12Accidental dwelling fire fatalities started in space heating appliances resulted in 24 fatalities in 2011-12.
2.13Fires started in electrical appliances resulted in 19 fatalities in accidental dwelling fires in
2011-12.
Table 2.1: Fatal and non-fatal casualties in accidental dwelling1 fires by source of ignition, Great Britain, 2011/12
|
Total |
|
|
|
|
|
|
|
accidental |
|
|
|
Non-fatal |
|
|
|
Fires |
Fatal casualties |
|
casualties |
|||
|
|
Total |
Rate |
|
Total |
Rate |
|
|
|
|
|
|
|
||
Total accidental |
37,601 |
244 |
6 |
7,729 |
206 |
||
Smokers' materials2 |
2,673 |
84 |
31 |
781 |
292 |
||
Cigarette lighters |
299 |
7 |
23 |
125 |
418 |
||
Matches |
302 |
6 |
20 |
69 |
228 |
||
Cooking appliances |
19,612 |
33 |
2 |
4,142 |
211 |
||
Space heating |
1,364 |
24 |
18 |
371 |
272 |
||
appliances3 |
|||||||
Central and water |
447 |
0 |
- |
55 |
123 |
||
heating appliances |
|||||||
|
|
|
|
|
|
||
Blowlamps, welding |
209 |
0 |
- |
30 |
144 |
||
and cutting equipment |
|||||||
|
|
|
|
|
|
||
Electrical distribution |
3,822 |
14 |
4 |
392 |
103 |
||
Other electrical |
4,709 |
19 |
4 |
799 |
170 |
||
appliances |
|||||||
|
|
|
|
|
|
||
Candles |
952 |
9 |
9 |
388 |
408 |
||
Other |
2,354 |
15 |
6 |
372 |
158 |
||
Unspecified |
858 |
33 |
38 |
205 |
239 |
||
1Includes caravans, houseboats, mobile homes and other non-permanent structures used solely as a permanent dwelling (see explanatory notes).
2Does not include lighters or matches
3Not including central or water heating
Rate per 1,000 fires
Non-fatal casualties and rates by source of ignition of fire (Tables 2.1 and 11)
2.14In 2011-12, there were 4,100 injuries from accidental dwelling fires started by cooking appliances. This accounted for over half (54%) of non-fatal casualties in accidental dwelling fires and equates to 211 injuries per 1,000 fires relating to cooking appliances. Although cooking appliance fires caused the largest number of injuries, they did not have the highest injury rate (per 1000 fires), again possibly reflecting the relatively minor nature of many cooking-related fires.
31
2.15The injury rate was highest for fires started by cigarette lighters – 418 per 1,000 fires, a total of 125 injuries in 2011-12. The next highest was for fires caused by candles – 408 per 1,000 fires, a total of 388 injuries in 2011-12
2.16Accidental dwelling fires caused by other electrical appliances resulted in 799 non-fatal casualties in 2011-12. This is the lowest figure recorded in more than a decade.
2.17Fires started by smokers’ materials resulted in 781 injuries –maintaining the long term downward trend (there were 1,440 injuries occurred from this source in accidental dwelling fires in 2001-02).
Non-fatal casualties by cause of fire (Figure 2.3 and Table 10)
2.18The total number of non-fatal casualties in accidental dwelling fire has been steadily declining since 2000-01. In 2011-12, the total number of non-fatal casualties was 8,900 – 2% fewer than in 2010-11. The vast majority of these casualties occurred in fires caused accidentally (87%). The number of non-fatal casualties in accidental dwelling fires fell by 3% from 7,900 in 2010-11 to 7,700 in 2011-12.
2.19The misuse of equipment and appliances was the biggest cause of non-fatal casualties in accidental dwelling fires (2,600 in 2011-12). Chip/fat pans were the biggest cause in accidental dwelling fires casualties until 2004. In 2011-12 they caused 1,230 non-fatal casualties, about two-third fewer than 11 years before.
2.20Other key changes between 2010-11 and 2011-12 in the number of non-fatal casualties by cause of fire were:
•Chip pan fire non-fatal casualties were down by 9% to 1,200 in 2011-12. Injuries from this cause are at its lowest level since 2000-01.
•Playing with fire – non-fatal casualties were up by 18 injuries to 149 in 2011-12 (the increase is mainly due to increase in slight injuries and precautionary checks recommended)
•Careless handling of fire or hot substances – non-fatal casualties declined from 1,200 to 1,100 in 2011-12.
•Faulty appliances and leads – non-fatal casualties declined from 980 to 900 in 2011-12.
32

Figure 2.3: Non-fatal casualties from accidental dwelling fires by cause, Great Britain, 2000/01 – 2011/12
|
12,000 |
|
|
|
|
|
|
|
|
|
|
|
|
|
|
|
casualties |
10,000 |
|
|
|
|
|
|
|
|
|
|
|
|
|
|
|
8,000 |
|
|
|
|
|
|
|
|
|
|
|
|
|
|
|
|
non-fatal |
6,000 |
|
|
|
|
|
|
|
|
|
|
|
|
|
|
|
|
|
|
|
|
|
|
|
|
|
|
|
|
|
|
|
|
of |
4,000 |
|
|
|
|
|
|
|
|
|
|
|
|
|
|
|
Number |
|
|
|
|
|
|
|
|
|
|
|
|
|
|
|
|
2,000 |
|
|
|
|
|
|
|
|
|
|
|
|
|
|
|
|
|
|
|
|
|
|
|
|
|
|
|
|
|
|
|
|
|
|
0 |
2 |
3 |
|
|
|
|
8 |
|
0 |
|
|
r |
|
|
p |
|
1 |
4 |
/05 |
6 |
7 |
/09 |
|
|
|
|
||||||
|
2000/0 |
/0 |
2002/0 |
2003/0 |
/0 |
2006/0 |
2007/0 |
/1 |
|
/11 |
|
2 |
||||
|
|
1 |
|
|||||||||||||
|
2001 |
2004 |
2005 |
2008 |
009 |
10 |
|
1/ |
|
|
||||||
|
2 |
20 |
|
|
01 |
|
|
|||||||||
|
|
|
|
|
|
|
|
|
|
|
|
2 |
|
|
||

 Human factors
 Non-human factors
  Other/unspecified
2009/10 figure was not shown due to incomplete record from one fire and rescue authority
p = provisional; r = revised
Casualties by room of origin of fire (Tables 2.2, 12a and 12b)
2.21In 2011-12, 101 (41%) accidental dwelling fire fatalities occurred in fires starting in either the living or dining room. This equates to a fatality rate of 29 fatalities per 1,000 fires, and makes fires starting in the living or dining room the most likely to result in a fatality. By contrast, 49 (20%) fatalities occurred in kitchen fires equating to a fatality rate of only 2 fatalities per 1,000 fires.
2.22In 2011-12, 53% of all accidental dwelling fire fatalities occurred in the room where the fire started, down 9% in 2011-12. However, this proportion varies depending on the room in which the fire started. For example, 57% of fatalities from fires occurred in the living or dinning room which is the room of origin, while a third of fatalities occurred in the bedroom where the fire started.
2.23The majority of all non-fatal casualties occurred in kitchen fires (61%). As with fatalities, the non-fatal casualty rate in kitchen fires was relatively low at 201 per 1,000 fires compared to the highest rate of 351 per 1,000 fires starting in the bedroom and 292 per
1,000 fires starting in the living or dining room.
33

2.24The pattern of non-fatal casualties is different from that of fatalities, with only 11% occurred in the room of origin in 2011-12. Once again, variations occur according to the room in which the fire started. For example, 53% of non-fatal casualties from fires occurred in the kitchen which is the room of origin, compared to 14% occurred in the bedroom where the fire started.
Table 2.2: Fatal and non-fatal casualties in accidental dwelling1 fires by use of room where fire started, Great Britain, 2011/12
|
Total |
Fatal casualties |
|
|
Non-fatal casualties |
||
|
accidental |
|
|
||||
|
Fires |
|
|
|
|
|
|
|
|
Total |
Rate |
|
Total |
Rate |
|
|
|
|
|
|
|
||
Room of origin of fire |
37,601 |
244 |
6 |
7,729 |
206 |
||
Bedroom or bedsitting room |
3,315 |
70 |
21 |
1,162 |
351 |
||
Living room, dining room or |
3,461 |
101 |
29 |
1,012 |
292 |
||
lounge |
|||||||
|
|
|
|
|
|
||
Kitchen |
23,251 |
49 |
2 |
4,676 |
201 |
||
Bathroom or lavatory |
845 |
1 |
1 |
112 |
133 |
||
Corridor, hall or stairs |
1,010 |
8 |
8 |
141 |
140 |
||
Laundry or airing cupboard |
1,068 |
1 |
1 |
159 |
149 |
||
Store room or loft |
1,321 |
4 |
3 |
108 |
82 |
||
Other2 |
3,233 |
5 |
2 |
340 |
105 |
||
Unspecified |
97 |
5 |
52 |
19 |
196 |
||
1Includes caravans, houseboats, mobile homes and other non-permanent structures used solely as a permanent dwelling (see explanatory notes).
2Conservatory, garage, refuse stores, external fittings and external structures
Rate per 1,000 fires
Smoke alarm analysis (Tables 2.3 to 2.9 and Figure 2.3)
Introduction
2.25This section looks at the effectiveness of smoke alarms and the likely cause of failure on those occasions when alarms did not operate. The assessment and analysis presented here is based (as elsewhere in this report) on fires attended by the fire and rescue service. Any fires involving alarms where no emergency call was made to the fire and rescue service will not be recorded. Therefore, the figures reported may understate the effectiveness of smoke alarms. If a smoke alarm is working correctly it will provide the occupier with an early warning of fire or smoke, making it is less likely the fire and rescue service will be called. Findings from the 2004/05 Survey of English Housing (SEH) estimate that the fire and rescue service were called to just over a fifth of all domestic fires (see paragraph 1.2 and explanatory note 11 for further details).
34

Smoke alarm ownership and operation status
2.26Figure 2.4 shows the presence and operational status of smoke alarm in dwelling fires. No smoke alarm was present in one third of dwelling fires while smoke alarm was present but did not operate in 18% of home fires.
Figure 2.4: Fires in dwellings by smoke alarm presence and operation, Great Britain, 2011-12
Alarm operated but did not raise alarm 10%
No alarm present 34%
Alarm operated and raised alarm
38%
Alarm did not operate 18%
Note: Within the category ‘alarm operated but did not raise alarm’, 58% were because the occupant was already aware of fire and 21% were because no one was in earshot (see table 2.9)
35

2.27Survey data (see table 2.3) show that the proportion of households with a smoke alarm increased rapidly from 8 per cent in 1988 to 70 per cent in 1994, but has risen more slowly in later years up to 86 per cent in 2008.
Table 2.3: Smoke alarm ownership, percentage of households, 1988-2008
England and Wales (unless otherwise stated)
Year |
Smoke alarm ownership |
Source1 |
|
|
|
|
(% of households) |
|
|
|
|
1988 |
8% |
BCS |
1989 |
25% |
BJM |
1990 |
- |
- |
1991 |
36% |
EHCS2 |
1992 |
45/50% |
BCS/ONS |
1993 |
66% |
ONS |
1994 |
70% |
ONS |
1995 |
71% |
ONS |
1996 |
67/72% |
EHCS2/ONS |
1997 |
75% |
ONS |
1998 |
82% |
NCFSC |
1999 |
77/81% |
BCS/NCFSC |
2000 |
83% |
NCFSC |
2001 |
81% |
NCFSC |
2002 |
- |
- |
2003 |
78% |
EHCS2 |
|
Working smoke alarm ownership |
Source1 |
|
|
|
|
(% of households) |
|
|
|
|
2001 |
76% |
BCS3 |
2002/03 |
76% |
BCS3 |
2003/04 |
- |
- |
2004/05 |
80% |
SEH2,3 |
2006 |
84% |
EHCS2 |
2007 |
85% |
EHCS2 |
2008 |
86% |
EHS4 |
1Sources: British Crime Survey (BCS); BJM survey commissioned by the Home Office (BJM); English House Condition Survey (EHCS); ONS Omnibus Survey (ONS); National Community Fire
Safety Centre 'Fire Safety Attitude and Behaviour Monitor' (NCFSC); Survey of English Housing (SEH);
In April 2008 the English House Condition Survey was integrated with the Survey of English Housing to form the English Housing Survey (EHS).
2England only.
3Refers specifically to ownership of a working smoke alarm.
4English Housing Survey
- Data not available
36

Smoke alarm presence, type and operation (Tables 2.4 to 2.6)
2.28No smoke alarm was present in 34% of (14,900) dwelling fires in 2011-12.These fires accounted for 105 fatalities and 2,400 non-fatal casualties. Among the 66% of dwelling fires where an alarm was present:
•an alarm operated and raised the alarm in 16,200 dwelling fires (37% of all dwelling fires);
•alarm operated but did not raise the alarm in 4,500 cases (10% of all dwelling fires). Within this category of ‘operated but did not raise the alarm’ 58% of cases were because the occupant was already aware and 21% were because no one was in earshot. (See table 2.9)”;
•alarm failed to operate in 7,900 cases (18% of all dwelling fires).
Table 2.4 Fires and casualties from fires in dwellings1 by presence and operation of smoke alarms, Great Britain, 2006/07-2011/12
Presence and operation of smoke alarm
|
Present, |
Present, |
Present, |
|
|
|
|
operated, |
|
|
|
||
|
operated & |
but did |
|
|
|
|
|
but did not |
Absent |
Unspecified |
Total |
||
|
raised the |
not |
||||
|
raise the |
|
|
|
||
|
alarm |
operate |
|
|
|
|
|
alarm |
|
|
|
||
|
|
|
|
|
|
|
|
|
|
|
|
|
|
Fires |
|
|
|
|
|
|
2006/07 |
19,322 |
3,206 |
6,689 |
24,568 |
.. |
53,785 |
2007/08 |
18,906 |
3,220 |
6,832 |
21,444 |
5 |
50,407 |
2008/09 |
17,715 |
3,558 |
10,176 |
15,998 |
19 |
47,466 |
2009/10 |
- |
- |
- |
- |
.. |
47,152 |
2010/11r |
16,382 |
4,433 |
7,780 |
16,407 |
.. |
45,002 |
2011/12p |
16,182 |
4,524 |
7,854 |
14,891 |
|
43,451 |
Fatal casualties |
|
|
|
|
|
|
2006/07 |
61 |
36 |
68 |
164 |
.. |
329 |
2007/08 |
67 |
43 |
102 |
159 |
.. |
371 |
2008/09 |
70 |
55 |
103 |
112 |
.. |
340 |
2009/10 |
- |
- |
- |
- |
.. |
405 |
2010/11 |
83 |
43 |
76 |
116 |
.. |
318 |
2011/12 |
73 |
49 |
60 |
105 |
.. |
287 |
Non-fatal casualties |
|
|
|
|
|
|
2006/07 |
4,094 |
735 |
1,639 |
4,535 |
.. |
11,003 |
2007/08 |
4,177 |
799 |
1,882 |
3,989 |
.. |
10,847 |
2008/09 |
3,994 |
903 |
2,074 |
2,845 |
6 |
9,822 |
2009/10 |
- |
- |
- |
- |
- |
10,316 |
2010/11r |
3,787 |
1,147 |
1,561 |
2,599 |
.. |
9,094 |
2011/12p |
3,875 |
1,191 |
1,424 |
2,436 |
.. |
8,926 |
1 Includes caravans, houseboats, mobile homes and other non-structured buildings used solely as a permanent dwelling (see explanatory notes)
- Data not available due to incomplete records from one Fire and Rescue Authority in 2009/10 p = provisional; r=revised
37

Type of alarm (Table 2.5)
2.29In 2011-12, smoke alarms were present in the fire area in 28,600 dwelling fires. Of these fires, 41% had battery-operated alarms, while 57% had mains-powered.
Table 2.5: Dwelling1 fires where a smoke alarm was present by type of alarm, Great Britain, 2006/07-2011/12
Year |
2006/07 |
2007/08 |
2008/09 |
2009/10 |
2010/11r |
2011/12p |
Alarm type |
|
|
|
|
|
|
(number) |
|
|
|
|
|
|
Battery-powered |
12,381 |
12,072 |
11,725 |
- |
12,302 |
11,833 |
Mains-powered |
16,672 |
16,503 |
16,165 |
- |
15,961 |
16,380 |
Other/Unspecified |
163 |
287 |
142 |
- |
332 |
347 |
Total |
29,216 |
28,862 |
28,033 |
- |
28,595 |
28,560 |
Alarm type (%) |
|
|
|
|
|
|
Battery-powered |
42% |
42% |
42% |
- |
43% |
41% |
Mains-powered |
57% |
57% |
58% |
- |
56% |
57% |
Other/Unspecified |
1% |
1% |
1% |
- |
1% |
1% |
Total |
100% |
100% |
100% |
- |
100% |
100% |
1 Includes caravans, houseboats, mobile homes and other non-structure buildings used solely as a permanent dwelling (see explanatory notes).
p=provisional; r=revised
Discovery of fires (Table 2.6)
2.30In 2011-12, a smoke alarm raised the alarm in 37% of reported dwelling fires. This is slightly up compared to the previous year. Dwelling fires in which smoke alarms raise the alarm continue to:
•be discovered more rapidly (less than 5 minutes) after ignition.
•be associated with lower fatal casualty rates.
2.31Generally, the shorter the interval between ignition and discovery of a fire, the lower the death rate. Working smoke alarms tend to shorten the discovery time. In 2011-12, threefifths (58%) of dwelling fires where a smoke alarm raised the alarm were discovered in under 5 minutes. In contrast, where a smoke alarm did not raise the alarm, just over half (51%) of all dwelling fires were discovered in under 5 minutes. Consequently, fatality rates in dwelling fires in which smoke alarms raised the alarm are lower than those in which smoke alarms are either absent or did not raise the alarm (5 per 1,000 detected fires compared to 8 per 1,000 for undetected fires in 2011-12).
38

Table 2.6: Fires and casualties from fires in dwellings1 by smoke alarm presence and operation, by percentage discovered in under 5 minutes, Great Britain, 2006/07-2011/12
|
|
|
|
|
|
% of fires |
|
Year |
Fires |
Fatal |
Rate |
Non-fatal |
Rate |
discovered |
|
casualties |
casualties |
< 5 |
|||||
|
|
|
|
||||
|
|
|
|
|
|
minutes |
|
|
|
|
|||||
Fires where an alarm was present, operated and raised the alarm |
|
|
|||||
2006/07 |
19,322 |
60 |
3 |
3,965 |
205 |
63 |
|
2007/08 |
18,906 |
67 |
4 |
4,047 |
214 |
62 |
|
2008/09 |
17,715 |
67 |
4 |
3,836 |
217 |
61 |
|
2009/10 |
- |
- |
- |
- |
- |
- |
|
2010/11r |
16,382 |
83 |
5 |
3,787 |
231 |
58 |
|
2011/12p |
16,182 |
73 |
5 |
3,875 |
239 |
58 |
|
Fires where an alarm was absent or an alarm was present but failed to raise the alarm |
|||||||
2006/07 |
34,464 |
251 |
7 |
6,728 |
195 |
52 |
|
2007/08 |
31,502 |
286 |
9 |
6,443 |
205 |
52 |
|
2008/09 |
29,752 |
261 |
9 |
5,621 |
189 |
51 |
|
2009/10 |
- |
- |
- |
- |
- |
- |
|
2010/11r |
28,620 |
235 |
8 |
5,307 |
185 |
50 |
|
2011/12p |
27,269 |
214 |
8 |
5,051 |
185 |
51 |
|
1 Includes caravans, houseboats, mobile homes and other non-structured buildings used solely as a permanent dwelling (see
explanatory notes).
Rate per thousand fires
- Data not available due to incomplete records from one Fire and Rescue Authority in 2009/10 p=provisional; r= revised
Smoke alarm failures (Tables 2.7 to 2.9)
2.32In those dwelling fires where a smoke alarm was present, 27% of alarms in 2011-12 failed to operate. However, this overall figure makes a wide difference in performance between battery-powered alarms and mains-powered alarms: 39% of all battery-powered smoke alarms failed compared to just 19% of mains-powered alarms in 2011-12.
2.33The main reason for smoke alarms failing to activate in battery-powered alarms in 2011-12 was that the fire products did not reach the alarms (45%). Missing or flat batteries accounted for 30% of all failure in battery-powered smoke alarm. For mains-powered alarms, the main reason for alarm failure was also because the fire products (typically smoke) did not reach the alarms (51% of cases).
2.34The smoke alarm operated but did not raise the alarm in 4,520 fires in 2011-12. The main reasons were either a person raised the alarm before the smoke alarm operated (58%) or there was no person within earshot of the alarm (21%) or occupants failed to respond (14%).
39

Table 2.7: Smoke alarm failures in dwelling1 fires by type of alarm, Great Britain, 2006/07-2011/12
Year |
2006/07 |
2007/08 |
2008/09 |
2009/10 |
2010/11r |
2011/12p |
|
|
|
|
|
|
|
Alarm present2 |
29,216 |
28,862 |
28,033 |
- |
28,595 |
28,560 |
Alarm failed to |
|
|
|
|
|
|
operate |
6,688 |
6,735 |
6,760 |
- |
7,659 |
7,712 |
Failure rate (%) |
23 |
23 |
24 |
- |
27 |
27 |
Battery- |
|
|
|
|
|
|
powered |
|
|
|
|
|
|
Alarm present |
12,381 |
12,072 |
11,725 |
- |
12,302 |
11,833 |
Alarm failed to |
|
|
|
|
|
|
operate |
4,423 |
4,321 |
4,198 |
- |
4,596 |
4,583 |
Failure rate (%) |
36 |
36 |
36 |
- |
37 |
39 |
Mains- |
|
|
|
|
|
|
powered3 |
|
|
|
|
|
|
Alarm present |
16,672 |
16,503 |
16,165 |
- |
15,961 |
16,380 |
Alarm failed to |
|
|
|
|
|
|
activate |
2,217 |
2,327 |
2,504 |
- |
3,063 |
3,129 |
Failure rate (%) |
13 |
14 |
15 |
- |
19 |
19 |
1Includes caravans, houseboats, mobile homes and other non-permanent structures used solely as a permanent dwelling (see explanatory notes).
2Alarm present total does not sum to individual categories as a small number of alarms with other or an unspecified power source have been included.
3Mains-powered alarms include those powered by mains only or by both mains and battery
p=provisional; r=revised
40
Table 2.8: Fires in dwellings1 with a smoke alarm where alarm did not operate by type of alarm and reason for failure, Great Britain, 2006/07-2011/12
Year |
2006/07 |
2007/08 |
2008/09 |
2009/10 |
2010/11 |
2011/12 |
Type of alarm and reason for failure
Powered - Battery Missing battery Battery failure/flat
Other act preventing alarm from operating inc. turned off
Fire products did not reach alarm(s)
Poor sitting of alarm(s)
Faulty system / incorrectly installed
Other including not known e.g. where system too badly damaged
Total
Powered - Mains
Missing battery
Battery failure/flat
Other act preventing alarm from operating inc. turned off
Fire products did not reach alarm(s)
Poor sitting of alarm(s)
Faulty system / incorrectly installed
Other including not known e.g. where system too badly damaged
Total
40% |
37% |
32% |
- |
21% |
19% |
10% |
9% |
10% |
- |
10% |
11% |
5% |
5% |
4% |
- |
2% |
2% |
32% |
36% |
39% |
- |
44% |
45% |
3% |
4% |
2% |
- |
10% |
11% |
4% |
4% |
4% |
- |
4% |
3% |
5% |
5% |
8% |
- |
10% |
10% |
100% |
100% |
100% |
- |
100% |
100% |
4% |
5% |
3% |
- |
2% |
1% |
1% |
0% |
1% |
- |
1% |
1% |
25% |
24% |
22% |
- |
14% |
12% |
49% |
50% |
48% |
- |
48% |
51% |
2% |
1% |
1% |
- |
12% |
12% |
9% |
9% |
10% |
- |
9% |
9% |
11% |
11% |
15% |
- |
14% |
15% |
100% |
100% |
100% |
- |
100% |
100% |
1 Includes caravans, houseboats and other non-building structures used solely as a permanent dwelling (see Definitions section). -Data not available due to incomplete records from one Fire and Rescue Authority in 2009/10
41

Table 2.9: Fires in dwellings1 with a smoke alarm where alarm operated but did not raise the alarm by reason, Great Britain, 2006/07-2011/12
Year |
2006/07 |
2007/08 |
2008/09 |
2009/10 |
2010/11 |
2011/12 |
|
|
|
|
|
|
|
Reason
Occupant raised the alarm before the system operated
No person in earshot
Poor positioning of alarms meant person raised alarm
Occupants failed to respond
Faulty system inc. incorrectly installed
Other including not known e.g. where system too badly damaged
Total
55% |
59% |
55% |
- |
57% |
58% |
21% |
21% |
20% |
- |
20% |
21% |
2% |
2% |
1% |
- |
0% |
0% |
12% |
9% |
11% |
- |
15% |
14% |
1% |
1% |
1% |
- |
0% |
0% |
9% |
9% |
11% |
- |
7% |
7% |
100% |
100% |
100% |
- |
100% |
100% |
1 Includes caravans, houseboats and other non-building structures used solely as a permanent dwelling (see definitions section).
- Data not available due to incomplete records from one Fire and Rescue Authority in 2009/10
42

Deliberate fires (Tables 2, 24 and 2.10)
2.35Approximately 14% of all dwelling fires in 2011-12 were deliberate or suspected to be deliberately started. The number of deliberate dwelling fires fell for the eighth consecutive year - down by more than a half from 13,200 in 2003-04 to 5,900 in 2011-12. Of the total 32,496 deliberate fires in 2011-12, only 18% were in dwellings. The majority of deliberate fires (43%) involved road vehicles – 13,900 fires (see Chapter 4 for further details).
2.36In total there were 80 fatalities in deliberate fires in 2011-12, one more than in 2010-11. The majority of these occurred in dwelling fires, 43 in 2011-12. This accounts for 54% of the total fatalities in deliberate fires.
2.37There were a total of 1,700 non-fatal casualties as a result of deliberate fires in 2011-12 – slightly down from 2010-11. Most of these injuries (88%) were i) either hospital slight
(40%) or ii) injuries where first aid was given (27%) or iii) precautionary checks recommended (21%). More than two thirds of these injuries occurred in dwelling fires.
Table 2.10: Deliberate fires and casualties by location, Great Britain, 2010/11 and 2011/12
Deliberate fires |
|
2010/11 |
|
2011/12 |
|
Fatalities |
Non-fatal casualties |
Fatalities |
Non-fatal casualties |
Dwellings |
42 |
1,169 |
43 |
1,197 |
Other buildings |
8 |
332 |
6 |
265 |
Road vehicles |
22 |
64 |
11 |
76 |
Other |
7 |
157 |
20 |
162 |
Total |
79 |
1,722 |
80 |
1,700 |
2.38 The unrest during August 2011 led to some large fires which were widely reported in the media. An analysis of the number of fires and size of damage in building fires was published in Section 5 of the April to September 2011 Fire Statistics Monitor https://www.gov.uk/government/publications/fire-statistics-monitor-april-to-september- 2011. Table 5.1 shows that there were several hundred more fire incidents attendances recorded by Fire and Rescue Services during the unrest. This number is small compared to the annual totals and annual changes in the downward trends in the numbers of deliberate fires (see Fire Statistics Monitor spreadsheet tables 5a and 5d), and so does not affect interpretation of trends.
43
Chapter 3 – Other Buildings
Introduction (Tables 1b, 2 and 6)
3.1In 2011-12 there were 24,100 fires recorded in buildings other than dwellings, 4% fewer than 2010-11. This is the lowest figure recorded in more than a decade. The majority of fires occurred in:
•private garages and sheds (26%) – 6,200 fires
•retail distribution (15%) - 3,700 fires
•industrial premises (12%) - 2,900 fires
•restaurants, cafes, public houses etc (10%) - 2,500 fires
•recreational and other cultural services (6%) - 1,500 fires.
3.2In 2011-12, 25 people died in buildings fires other than dwellings – compared with 21 in
2010-11. Also, 1,200 injuries were sustained in other building fires in 2011-12 - little changed (1% lower) compared with 2010-11. These figures represent around 7% of all fire fatalities and 11% of non-fatal injuries.
Accidental fires (Table 2)
Trends
3.3Seventy per cent of all fires in other buildings were started accidentally compared to 86% of those in fires in dwellings. In 2011-12, a total of 16,800 accidental fires were recorded in other buildings, 5% fewer than in 2010-11. The overall trend in such fires over the last ten years has been downward, with the 2011-12 figure 27% lower than the 2001-02 figure of 23,000.
Cause of fire
3.4As in the previous year, the main cause of accidental fires in other buildings in 2011-12 was faulty appliances and leads. This represented 24% of all such fires. Fires from this cause reduced by 10% to 4,000 in 2011-12. Another key cause of accidental fires in other buildings was the misuse of equipments or appliances which accounted for 2,600, and was down by 9% on 2010-11.
44

Source of ignition (Table 3)
3.5Main sources of ignition in fires in other buildings are cooking appliances and other electrical appliances. They accounted for more than one third of accidental fires. The number of fires started by cooking appliances declined by 9% and fires from other electrical appliances declined by 7% in 2011-12. Other key changes relating to source of ignition from 2010-11 were:
•Smokers’ materials – increased by 6% to 1,200, while there were 261 fires started by cigarette lighters or matches;
•Electrical distribution (leads to appliances, wires and cables) – decreased by 7% to
2,800.
Deliberate fires (Tables 2 and 24, Figure 3.1)
Trends
3.67,300 (30%) other building fires were due to deliberate ignition, little changed from
2010-11. Over the last decade, the number of deliberate fires in other buildings has declined by more than a half. (See paragraph 1.10 and table 1.2).
Figure 3.1: Other building fires: proportion of deliberate fires by location, Great Britain, 2011/12
|
|
70 |
|
|
|
62 |
|
|
|
|
|
|
|
|
deliberate fires |
60 |
|
|
|
|
Proportion |
50 |
48 |
|
|
|
|
|
|
|
40 |
|||
40 |
|
|
|
|||
|
|
32 |
31 |
|||
30 |
|
25 |
||||
|
21 |
22 |
||||
|
|
17 |
||||
|
of |
20 |
|
|
15 |
|
|
11 |
11 |
|
|||
|
|
10 |
|
|
||
|
|
|
|
|
|
|
|
|
0 |
|
|
|
|
|
|
|
|
|
|
|
|
|
|
c |
|
|
g |
|
|
|
. |
|
|
|
|
|
|
. |
|
|
|
|
|
ls |
|
|
ion |
|
|
services |
premiseslpre |
ises |
|
|
|
||||||||||
|
|
|
|
|
|
e |
|
|
|
n |
|
|
|
|
|
rin |
|
|
tc |
|
|
|
Scho |
|
|
|
|
|
|
|
|||||||||||||||||||||
|
|
|
|
|
|
|
, |
|
na |
|
|
|
|
|
|
|
|
e |
|
|
|
|
|
|
|
|
|
|
|
|
o |
||||||||||||||||||||
|
|
|
|
|
|
|
|
|
|
livi |
|
|
|
|
|
|
|
|
|
|
|
|
|
|
|
|
|
|
|
|
|
|
|
|
|
||||||||||||||||
|
|
|
|
|
|
|
|
|
|
et |
|
|
|
|
|
|
|
|
|
|
|
|
|
|
|
distribution |
|
|
|
|
|
Educa |
|
|
|
|
|
|
|
|
wn |
||||||||||
|
|
|
|
, |
|
|
|
|
|
u |
|
|
|
|
etc |
e |
|
|
|
|
|
|
|
o |
|
Healthcare |
|
|
|
|
|
|
|
||||||||||||||||||
|
|
|
|
|
|
|
|
s |
|
|
l |
|
|
|
|
|
|
|
, |
|
|
|
|
|
|
|
|
|
|
|
|
|
|
|
|
|
|
|
|
|
m |
|
|
|
kn |
|
|||||
|
|
|
|
|
sh |
d |
|
|
|
|
|
B&B, |
|
|
|
|
g |
|
|
|
|
|
|
|
|
|
|
|
|
|
|
|
|
al |
|
|
|
|
|
|
|
not |
|
||||||||
e |
|
|
|
|
|
Comm |
|
|
|
|
|
|
|
|
|
|
|
|
|
e |
|
|
|
r |
|
|
|
other |
|
|
|
|
|
ildings |
|
|
|
|
|
||||||||||||
|
e |
|
|
|
|
|
|
|
Pu |
|
|
Cat |
|
|
|
|
|
|
|
|
|
h |
|
|
|
|
|
Agricultural |
|
|
|
|
s |
|
|
|
|||||||||||||||
|
|
|
|
|
|
|
|
|
|
|
|
|
|
|
|
|
|
|
|
|
|
|
|
|
|
|
|
|
|
|
|
|
tri |
|
|
|
|
|
|||||||||||||
|
ara |
|
s |
|
|
|
hostels, |
|
b |
|
|
|
|
Retail |
|
|
|
r, Hi |
|
e |
|
and |
|
cultu |
|
|
Indu |
|
|
|
|
|
e |
|
|
|
|||||||||||||||
|
g |
|
|
|
|
|
|
|
|
|
|
|
|
|
s |
|
|
|
|
|
|
|
|
|
|
|
|
g |
|
|
|
|
|
|
|
|
s |
|
/ |
|
|
|
|
|
|||||||
|
|
|
|
|
|
|
|
|
|
|
|
|
|
|
|
|
, |
|
|
|
|
|
|
|
|
|
F |
|
|
Hospitalsand |
|
|
|
|
|
|
|
u |
|
|
|
|
|||||||||
g |
|
|
|
|
|
|
Hotels, |
|
|
|
|
|
|
|
|
|
|
|
|
|
|
|
|
|
|
|
|
|
|
r |
|
|
|
|
|
|
|
|
|
||||||||||||
Privat |
|
|
|
|
|
|
|
|
|
|
|
|
|
|
|
|
|
|
|
|
|
|
|
urth |
|
|
|
|
|
|
al |
|
|
|
|
|
e |
b |
|
|
|
|
|
|
|
|
|||||
|
|
|
|
|
|
|
|
|
|
|
|
|
|
|
|
|
|
|
|
|
|
|
|
|
|
|
|
|
|
|
|
|
|
|
|
|
|
|
|
|
|
|
u |
|
|
|
|
|
|
|
|
|
|
|
|
|
|
|
|
|
|
|
|
|
|
|
|
|
|
|
|
|
|
|
|
|
|
|
ool, |
|
|
|
|
|
|
n |
|
|
|
|
Oth |
|
|
|
|
|
|
|
|
|
|
||
|
|
|
|
|
|
|
|
|
|
|
|
|
|
|
|
|
|
|
|
|
|
Pre |
|
h |
|
|
Recreatio |
|
|
|
|
|
|
|
|
|
|
|
|
|
|
|
|||||||||
|
|
|
|
|
|
|
|
|
|
|
|
|
|
|
|
|
|
|
|
|
|
|
|
-sc |
|
|
|
|
|
|
|
|
|
|
|
|
|
|
|
|
|
|
|
|
|
|
|
|
|
||
45

Location (Figure 3.1)
3.7A comparison of the number of deliberate fires in other building locations with the total fires shows that certain buildings are more prone to deliberate ignition than others. The main locations in 2011-12 were private garages and sheds (48%), recreational and other cultural services premises (40%); and schools (32%) and buildings whose use was not known or not categorised (62%),
Non-fatal casualties and Location (Figure 3.2)
3.8In 2011-12, the highest non-fatal casualty rates in deliberate fires in other buildings occurred in hotels, hostels or B&B (121 casualties per 1,000 fires). High non-fatal casualty rates were also recorded in communal living - (98 non-fatal casualties per 1,000 fires) and hospital and health cares (93 non-fatal casualties per 1,000 fires). The rate in schools and pub and catering areas are 54 and 48 per 1,000 fires respectively. The rate in all other building fires was 81 per 1,000 fires.
Figure 3.2: Deliberate fires in other buildings: Non-fatal casualty rates by location, Great Britain, 2011/12
|
|
|
|
140 |
|
|
|
|
|
|
|
|
|
|
|
|
|
|
|
|
|
|
|
|
|
|
|
|
|
|
|
|
|
|
|
|
|
|
|
|
|
|
|
|
|
|
|
|
|
|
|
|
|
|
|
|
|
|
|
|
|
|
|
|
|
|
|
|
|
|
|
|
|
|
|
|
|
|
|
|
|
|
|
|
|
|
|
|
|
|
|
|
|
|
|
|
|
|
|
|
|
|
|
|
|
|
|
|
|
|
|
|
|
|
|
|
|
|
|
|
|||||
|
|
|
|
120 |
|
|
|
|
|
|
|
|
|
|
|
|
|
|
|
|
|
|
121 |
|
|
|
|
|
|
|
|
|
|
|
|
|
|
|
|
|
|
|
|
|
|
|
|
|
|
|
|
|
|
|
|
|
|
|
|
|
|
|
|
|
|
|
|
|
|
|
|
|
|
|
|
|
|
|
|
|
|
|
|
|
|
|
|
|
|
|
|
|
|
|
|
|
|
|
|
|
|
|
|
|
|
|
|
|
|
|
|
|
|
|
|
|
|||||||||
|
|
|
|
|
|
|
|
|
|
|
|
|
|
|
|
|
|
|
|
|
|
|
|
|
|
|
|
|
|
|
|
|
|
|
|
|
|
|
|
|
|
|
|
|
|
|
|
|
|
|
|
|
|
|
|
|
|
|
|
|
|
|
|
|
|
|
|
|
|
|
|
|
|
|
|
|
|
|
|
|
|
|
|
|
|
|
|
|
|
|
|
|
|
|
|
|
|
|
|
|
|
|
|
|
|
|
|
|
|
|
|
|
|
|
|
|
|
|
|
||||||
|
|
|
|
100 |
|
|
|
|
|
|
|
|
|
|
|
98 |
|
|
|
|
|
|
|
|
|
|
|
|
|
|
|
|
|
|
|
|
|
|
|
|
|
|
|
|
|
|
|
|
|
|
|
|
|
|
|
|
|
|
|
|
|
|
|
|
|
|
|
|
|
|
|
|
93 |
|
|
|
|
|
|
|
|
|
|
|
|
|
|
|
|
|
|
|
|
|
|
|
|
|
|
|
|
|
|
|
|
|
|
|
|
|
|
|
|
|
|||||||||||
fires |
|
|
|
|
|
|
|
|
|
|
|
|
|
|
|
|
|
|
|
|
|
|
|
|
|
|
|
|
|
|
|
|
|
|
|
|
|
|
|
|
|
|
|
|
|
|
|
|
|
|
|
|
|
|
|
|
|
|
|
|
|
|
|
|
|
|
|
|
|
|
|
|
|
|
|
|
|
|
|
|
|
|
|
|
|
|
|
|
|
|
|
|
|
|
|
|
|
|
|
|
|
|
|
|
|
|
|
|
|
|
|
|
|
|
|
||||||||||
|
|
|
|
|
80 |
|
|
|
|
|
|
|
|
|
|
|
|
|
|
|
|
|
|
|
|
|
|
|
|
|
|
|
|
|
|
|
|
|
|
|
|
|
|
|
|
|
|
|
|
|
|
|
|
|
|
|
|
|
|
|
|
|
|
|
|
|
|
|
|
|
|
|
|
|
|
|
|
|
|
|
|
|
|
|
|
|
|
|
|
|
|
|
|
|
|
|
|
|
|
|
|
|
|
|
|
|
|
|
|
|
|
|
|
|
|
|
|
|
|
|
81 |
||||
per 1,000 |
|
|
|
|
|
|
|
|
|
|
|
|
|
|
|
|
|
|
|
|
|
|
|
|
|
|
|
|
|
|
|
|
|
|
|
|
|
|
|
|
|
|
|
|
|
|
|
|
|
|
|
|
|
|
|
|
|
|
|
|
|
|
|
|
|
|
|
|
|
|
|
|
|
|
|
|
|
|
|
|
|
|
|
|
|
|
|
|
|
|
|
|
|
|
|
|
|
|
|
|
|
|
|
|
|
|
|
|
|
|
|
|
|
|
|
|
|
|
|
|
|
||||
|
|
|
|
|
60 |
|
|
|
|
|
|
|
|
|
|
|
|
|
|
|
|
|
|
|
|
|
|
|
|
|
|
48 |
|
|
|
|
|
|
|
|
|
|
|
|
|
|
|
54 |
|
|
|
|
|
|
|
|
|
|
|
|
|
|
|
|
|
|
|
|
|
|
|
|
|
|
|
|
|
|
|
|
|
|
|
|
|
|
|
|
|
|
|
|
|
|
|
|
|
|
|
|
|
|
|
|
|
|
|
|
|
|
|
|
|
|
|
||||||||||
Rate |
|
|
|
|
|
|
|
|
|
|
|
|
|
|
|
|
|
|
|
|
|
|
|
|
|
|
|
|
|
|
|
|
|
|
|
|
|
|
|
|
|
|
|
|
|
|
|
|
|
|
|
|
|
|
|
|
|
|
|
|
|
|
|
|
|
|
|
|
|
|
|
|
|
|
|
|
|
|
|
|
|
|
|
|
|
|
|
|
|
|
|
|
|
|
|
|
|
|
|
|
|
|
|
|
|
|
|
|
|
|
|
|
|
|
|
|
|
|
|
|
|
||||
|
|
|
|
|
40 |
|
|
|
|
|
|
|
|
|
|
|
|
|
|
|
|
|
|
|
|
|
|
|
|
|
|
|
|
|
|
|
|
|
|
|
|
|
|
|
|
|
|
|
|
|
|
|
|
|
|
|
|
|
|
|
|
|
|
|
|
|
|
|
|
|
|
|
|
|
|
|
|
|
|
|
|
|
|
|
|
|
|
|
|
|
|
|
|
|
|
|
|
|
|
|
|
|
|
|
|
|
|
|
|
|
|
|
|
|
|
|
|
|
|
|
|
||||
|
|
|
|
|
|
|
|
|
|
|
|
|
|
|
|
|
|
|
|
|
|
|
|
|
|
|
|
|
|
|
|
|
|
|
|
|
|
|
|
|
|
|
31 |
|
|
|
|
|
|
|
|
|
|
|
|
|
|
|
|
|
|
|
|
|
|
|
|
|
|
|
|
|
|
|
|
|
|
|
|
|
|
|
|
|
|
|
|
|
|
|
|
|
|
|
|
|
|
|
|
|
|
|
|
|
|
|
|
|
|
|
|
|
|
|
|
|
|
|
|
||||||
|
|
|
|
|
|
|
|
|
|
|
|
|
|
|
|
|
|
|
|
|
|
|
|
|
|
|
|
|
|
|
|
|
|
|
|
|
|
|
|
|
|
|
|
|
|
|
|
|
|
|
|
|
|
|
|
|
|
|
|
|
|
|
|
|
|
|
|
|
|
|
|
|
|
|
|
|
|
|
|
|
|
|
|
|
|
|
|
|
|
|
|
|
|
|
|
|
|
|
|
|
|
|
|
|
|
|
|
|
|
|
|
|
|
|
|
|
|
|
|
|
|
|
|||
|
|
|
|
|
|
20 |
|
15 |
|
|
|
|
|
|
|
|
|
|
|
|
|
|
|
|
|
|
|
|
|
|
|
|
|
|
|
|
|
|
|
|
|
|
|
|
|
|
|
|
|
|
|
|
|
|
|
|
|
|
|
|
|
|
|
|
|
|
|
|
|
|
|
|
|
|
|
|
|
|
|
|
|
|
|
|
|
16 |
|
|
|
|
|
|
|
|
|
|
|
|
|
|
|
|
|
|
|
|
|
19 |
|
|
|
|
|
||||||||||||
|
|
|
|
|
|
|
|
|
|
|
|
|
|
|
|
|
|
|
|
|
|
|
|
|
|
|
|
|
|
|
|
|
|
|
|
|
|
|
|
|
|
|
|
|
|
|
|
|
|
|
|
|
|
|
|
|
|
|
|
|
|
|
|
|
|
|
|
|
|
|
|
|
|
|
|
|
|
|
|
|
|
|
|
|
|
|
|
|
|
|
11 |
|
|
|
|
|
|
|
|
|
|
|
|
|
|
|
|
|
|
|
|||||||||||||||
|
|
|
|
|
|
|
|
|
|
|
|
|
|
|
|
|
|
|
|
|
|
|
|
|
|
|
|
|
|
|
|
|
|
|
|
|
|
|
|
|
|
|
|
|
|
|
|
|
|
|
|
|
|
|
|
|
|
|
|
|
|
|
|
|
|
|
|
|
|
|
|
|
|
|
|
|
|
|
|
|
|
|
|
|
|
|
|
|
|
|
|
|
|
|
|
|
|
|
|
|
|
|
|
|
|
|
|
|
|
|
|
|
|
|
|
|
|
|
|
|
|
||||
|
|
|
|
|
|
|
0 |
|
|
|
|
|
|
|
|
|
|
|
|
|
|
|
|
|
|
|
|
|
|
|
|
|
|
|
|
|
|
|
|
|
|
|
|
|
|
|
|
|
|
|
|
|
|
|
|
|
|
|
|
|
|
|
|
|
|
|
|
|
0 |
|
|
|
|
|
|
|
|
|
|
|
|
|
|
|
|
|
|
|
|
|
|
|
|
|
|
|
|
|
|
|
|
|
|
|
|
|
|
|
|
|
|
|
|
|
|
|
|
|
|
|
|
|
|||
|
|
|
|
|
|
|
tc |
|
|
|
|
|
|
|
|
|
|
g |
|
|
|
|
|
. |
|
|
|
|
|
|
|
. |
|
|
|
|
|
|
|
|
|
|
n |
|
|
|
|
|
|
|
|
|
|
|
|
|
|
|
|
io |
|
|
|
|
|
|
|
|
|
|
|
|
re |
|
|
|
|
|
|
|
|
|
e |
s |
|
|
|
|
|
|
|
|
|
|
s |
|
|
|
|
|
|
|
|
|
|
|
|
|
|
s |
|
|
|
|
|
|
|
|
|
n |
|||||
|
|
|
|
|
|
|
|
|
|
|
|
|
|
|
|
|
|
|
|
|
|
|
|
|
|
|
|
|
|
|
|
|
|
|
|
|
|
|
|
|
|
|
|
|
|
|
|
|
|
|
|
|
|
|
|
|
|
|
|
|
|
|
|
|
|
|
|
|
|
|
|
|
|
|
|
|
|
|
|
|
|
|
|
|
|
|
|
|
|
|
|
|
|
|
|
|
|
|
|
|
|
|
|
|
|
|
|
|
|
|
|
||||||||||||||
|
|
|
|
|
|
|
|
|
|
|
|
|
|
|
|
|
|
in |
|
|
|
|
|
c |
|
|
|
|
|
|
|
tc |
|
|
|
|
|
|
|
|
io |
|
|
|
|
|
|
ls |
|
|
|
|
|
|
|
|
|
|
|
|
|
|
|
|
|
|
|
|
|
|
|
|
|
|
|
|
ic |
|
|
|
|
|
|
|
|
|
|
e |
|
|
|
|
|
|
|
|
|
|
|
|
e |
|
|
|
|
|
|
|
|
w |
|||||||||||||||
|
|
|
|
|
|
|
|
|
|
, e |
|
|
|
|
|
|
|
|
|
|
|
|
|
et |
|
|
|
|
|
|
|
|
|
|
|
|
|
|
|
|
|
|
|
|
|
|
|
|
|
|
|
|
|
|
t |
|
|
|
|
|
|
|
|
|
|
|
|
|
|
a |
|
|
|
|
|
|
|
|
|
|
|
|
|
|
|
|
|
|
s |
|
|
|
|
|
|
|
|
|
|
|
|
|
|
|
|
|
|
|
|
|
o |
|
|||||||||||||
|
|
|
|
|
|
|
|
|
|
|
|
|
|
|
|
|
iv |
|
|
|
|
|
|
|
|
|
|
|
|
|
|
|
e |
|
|
|
|
|
|
|
t |
|
|
|
|
|
|
|
|
o |
|
|
|
|
|
|
c |
a |
|
|
|
|
|
|
|
|
|
|
|
|
thc |
|
|
|
|
|
|
|
v |
|
|
|
|
|
|
|
|
|
|
|
|
|
|
|
|
|
|
|
|
|
|
is |
|
|
|
|
|
|
|
|
|
|
|
|
|||||||||||
|
|
|
|
|
|
|
|
|
|
s |
|
|
|
|
|
|
l |
|
|
|
|
|
|
&B, |
|
|
|
|
|
|
|
|
, |
|
|
|
|
|
|
ibu |
|
|
|
|
|
|
|
|
o |
|
|
|
|
|
|
u |
|
|
|
|
|
|
|
|
|
|
|
|
|
|
|
|
|
|
|
|
|
|
r |
|
|
|
|
|
|
|
|
|
|
m |
|
|
|
|
|
|
|
|
|
|
|
|
m |
|
|
|
|
|
|
|
|
|
|
|
n |
|
|
|
|||||||
|
|
|
|
|
|
|
|
|
d |
|
|
|
|
|
l |
|
|
|
|
|
|
|
|
|
|
|
|
|
|
|
g |
|
|
|
|
|
|
|
|
|
|
|
|
|
h |
|
|
|
|
|
|
|
|
|
|
|
|
|
|
|
|
|
|
|
|
|
|
|
|
|
|
|
e |
|
|
|
|
|
|
|
|
|
|
|
|
|
|
|
|
|
|
|
|
|
|
|
|
|
|
|
|
|
|
|
|
|
k |
|
|
|
|
||||||||||||||
|
|
|
|
|
|
|
|
|
|
|
|
|
|
|
a |
|
|
|
|
|
|
|
|
|
|
|
|
|
|
|
n |
|
|
|
|
|
|
|
|
|
|
|
|
|
|
|
|
|
|
|
d |
|
|
|
|
|
|
|
|
|
|
|
|
|
|
|
l |
|
|
|
|
|
|
|
s |
|
|
|
|
|
|
|
|
|
|
e |
|
|
|
|
|
|
|
|
|
|
|
e |
|
|
|
|
|
|
|
|
|
t |
|
|
|
|
|||||||||||||
|
|
|
|
|
|
|
|
e |
|
|
|
|
|
|
|
|
|
|
|
|
|
|
|
|
|
|
|
|
|
|
|
|
|
|
|
r |
|
|
|
|
|
|
|
|
|
|
|
|
|
|
E |
|
|
|
|
|
|
|
|
|
|
|
|
|
|
|
a |
|
|
|
|
|
|
|
|
|
|
|
|
|
|
|
|
|
|
|
|
|
|
|
|
|
|
|
|
|
|
|
r |
|
|
|
|
|
|
|
|
|
|
|
|
|
|
|
|||||||||||
|
|
|
|
|
|
|
|
|
|
|
|
|
un |
|
|
|
|
|
|
|
|
|
|
|
|
|
|
|
i |
|
|
|
|
|
t |
|
|
|
|
|
|
|
|
Sc |
|
|
|
|
|
|
|
|
|
|
|
|
|
|
|
|
|
|
|
|
|
e |
|
|
|
|
|
|
|
|
|
|
|
|
|
|
|
|
|
|
|
|
r |
|
|
|
|
|
|
|
|
|
|
|
|
|
|
|
|
|
|
|
|
|
|
o |
|
|
|
|
|
||||||||||
|
|
|
|
|
|
|
h |
|
|
|
|
|
|
|
|
|
|
|
|
|
|
B |
|
|
|
|
|
|
r |
|
|
|
|
|
|
is |
|
|
|
|
|
|
|
|
|
|
|
|
|
|
r |
|
|
|
|
|
|
|
|
|
|
|
|
|
|
|
|
|
|
|
|
|
|
|
al |
|
|
|
|
|
|
|
|
|
|
|
|
|
|
|
|
|
|
|
|
|
|
|
p |
|
|
|
|
|
|
|
|
|
|
n |
|
|
|
|
|
||||||||||
|
|
|
|
|
|
,s |
|
|
|
|
|
|
|
|
|
|
|
|
|
s, |
|
|
|
|
|
|
te |
|
|
|
|
|
|
|
|
|
|
|
|
|
|
|
|
|
|
|
|
|
|
|
|
|
|
|
|
|
|
|
|
|
|
|
|
H |
|
|
|
|
|
|
|
|
|
|
|
|
|
|
|
|
|
|
|
l |
p |
|
|
|
|
|
|
|
|
|
|
l |
|
|
|
|
|
|
|
|
|
|
|
|
|
|
|
|
|||||||||||||
|
|
|
|
|
|
|
|
|
|
|
|
m |
|
|
|
|
|
|
|
|
|
|
|
|
|
|
|
|
|
|
|
|
il |
d |
|
|
|
|
|
|
|
|
|
|
|
|
|
|
|
h |
e |
|
|
|
|
|
|
|
|
|
|
|
|
|
|
|
|
|
|
|
|
|
|
|
r |
|
|
|
|
|
|
|
|
|
|
|
|
|
|
|
|
|
|
|
|
|
|
|
|
|
|
|
|
|
|
|
|
|
e |
|
|
|
|
|
|
|
|||||||||
|
|
|
|
|
|
s |
|
|
|
|
|
m |
|
|
|
|
|
|
|
|
l |
|
|
|
|
|
|
C |
a |
|
|
|
|
|
|
|
|
|
|
|
|
|
|
|
|
|
|
|
|
|
|
|
|
|
|
|
|
|
|
|
|
|
|
|
|
|
d |
|
|
|
|
|
|
|
|
tu |
|
|
|
|
|
|
|
|
|
|
|
r |
a |
|
|
|
|
|
|
|
|
|
|
ia |
|
|
|
|
|
|
|
|
|
|
s |
|
|
|
|
|
|
|
|||||||
|
|
|
|
|
|
|
|
|
|
|
|
|
|
|
|
|
|
|
|
e |
|
|
|
|
|
|
|
|
|
|
|
|
|
|
|
|
|
|
|
|
|
|
|
|
|
|
|
|
|
|
g |
|
|
|
|
|
|
|
|
|
|
|
|
|
|
|
|
|
|
|
|
|
|
|
l |
|
|
|
|
|
|
|
|
|
|
|
|
|
|
|
|
|
|
|
|
|
|
r |
|
|
|
|
|
|
|
|
|
|
|
|
|
|
|
|
|
|
|
||||||||
|
|
|
|
|
e |
|
|
|
|
|
|
|
|
|
|
|
|
|
|
|
|
|
|
|
|
|
|
|
|
|
|
|
|
a |
|
|
|
|
|
|
|
|
|
|
|
|
|
|
|
|
|
|
|
|
|
|
|
|
|
|
|
|
|
|
n |
|
|
|
|
|
|
|
u |
|
|
|
|
|
|
|
|
|
|
|
|
u |
|
|
|
|
|
|
|
|
|
t |
|
|
|
|
|
|
|
|
|
|
|
u |
|
|
|
|
|
|
|
|
|
||||||||
|
|
|
|
|
|
|
|
|
|
|
|
|
|
|
|
|
|
o st |
|
|
|
|
|
|
|
, |
|
|
|
|
|
|
|
|
|
|
|
|
|
|
|
|
|
|
|
|
|
i |
|
|
|
|
|
|
|
|
|
|
|
|
|
|
|
|
|
|
|
|
|
|
|
|
|
|
|
|
|
|
|
|
|
|
|
|
|
|
|
|
|
|
|
|
|
|
|
|
|
|
|
|
|
|
|
|
|
|
|
|
|
|
|
|
|
||||||||||||
|
|
|
|
ag |
|
|
|
|
|
|
Co |
|
|
|
|
|
|
|
h |
|
|
|
|
|
|
b |
s |
|
|
|
|
|
R |
e |
|
|
|
|
|
|
|
|
|
|
|
|
|
|
, H |
|
|
|
|
|
|
|
|
|
|
|
|
|
|
s a |
|
|
|
|
|
|
|
|
r c |
|
|
|
|
|
|
|
|
|
|
|
l |
|
|
|
|
|
|
|
|
|
d |
us |
|
|
|
|
|
|
|
|
s |
/ |
|
|
|
|
|
|
|
|
|
|
|||||||||
|
|
|
ar |
|
|
|
|
|
|
|
|
|
|
|
|
|
|
, |
|
|
|
|
|
|
Pu |
|
|
|
|
|
|
|
|
|
|
|
|
|
|
|
|
|
|
|
|
er |
|
|
|
|
|
|
|
|
|
|
|
|
|
|
|
l |
|
|
|
|
|
|
|
|
e |
|
|
|
|
|
|
|
|
|
|
|
icu |
|
|
|
|
|
|
|
|
|
n |
|
|
|
|
|
|
|
|
|
g |
|
|
|
|
|
|
|
|
|
|
|
|
||||||||||
|
|
|
|
|
|
|
|
|
|
|
|
|
|
|
|
|
|
|
|
|
|
|
|
|
|
|
|
|
|
|
|
|
|
|
|
|
|
|
|
|
|
|
|
|
|
|
|
|
|
|
|
|
|
|
|
|
|
|
|
a |
|
|
|
|
|
|
|
|
h |
|
|
|
|
|
|
|
|
|
|
|
|
r |
|
|
|
|
|
|
|
|
|
|
|
|
|
|
|
|
|
|
|
|
|
|
|
|
|
|
|
|
|
|
|
|
|
||||||||||
|
|
g |
|
|
|
|
|
|
|
|
|
|
|
|
|
ls |
|
|
|
|
|
|
|
|
|
|
|
|
|
|
|
|
|
|
|
|
|
|
|
|
|
|
|
|
|
|
|
|
|
|
|
|
|
|
|
|
|
|
t |
|
|
|
|
|
|
|
|
t |
|
|
|
|
|
|
|
|
|
|
|
|
|
|
|
|
|
|
|
|
|
|
I |
|
|
|
|
|
|
|
|
in |
|
|
|
|
|
|
|
|
|
|
|
|
|
|
|
||||||||||
|
|
|
|
|
|
|
|
|
|
|
|
|
|
|
|
|
|
|
|
|
|
|
|
|
|
|
|
|
|
|
|
|
|
|
|
|
|
|
|
|
|
|
th |
|
|
|
|
|
|
|
|
|
|
|
|
|
|
i |
|
|
|
|
|
|
|
|
|
|
|
|
|
|
|
|
|
|
|
|
|
Ag |
|
|
|
|
|
|
|
|
|
|
|
|
|
|
|
|
|
|
|
|
|
|
|
|
|
|
|
|
|
|
|
|
|
|
|||||||||||
|
te |
|
|
|
|
|
|
|
|
|
|
|
|
|
|
|
|
|
|
|
|
|
|
|
|
|
|
|
|
|
|
|
|
|
|
|
|
|
|
|
|
|
|
|
|
|
|
|
|
|
|
|
|
|
s |
p |
|
|
|
|
|
|
|
|
d |
o |
|
|
|
|
|
|
|
|
|
|
|
|
|
|
|
|
|
|
|
|
|
|
|
|
|
|
|
|
|
|
ld |
|
|
|
|
|
|
|
|
|
|
|
|
|
|
|
|
||||||||||||
|
|
|
|
|
|
|
|
|
|
|
|
|
|
te |
|
|
|
|
|
|
|
|
|
|
|
|
|
|
|
|
|
|
|
|
|
|
|
|
|
|
|
|
|
|
|
, F |
ur |
|
|
|
|
|
|
|
|
|
Ho |
|
|
|
|
|
|
|
|
n |
|
|
|
|
|
|
|
|
|
|
|
|
|
|
|
|
|
|
|
|
|
|
|
|
|
|
|
|
|
|
|
|
|
i |
|
|
|
|
|
|
|
|
|
|
|
|
|
|
|
|
|
||||||||
|
iva |
|
|
|
|
|
|
|
|
|
|
|
H |
o |
|
|
|
|
|
|
|
|
|
|
|
|
|
|
|
|
|
|
|
|
|
|
|
|
|
|
|
|
|
|
|
|
|
|
|
|
|
|
|
|
|
|
|
|
|
|
|
|
|
|
l a |
|
|
|
|
|
|
|
|
|
|
|
|
|
|
|
|
|
|
|
|
|
|
|
|
|
|
|
|
|
|
|
|
r |
bu |
|
|
|
|
|
|
|
|
|
|
|
|
|
|
|
|
|
|
||||||||
|
Pr |
|
|
|
|
|
|
|
|
|
|
|
|
|
|
|
|
|
|
|
|
|
|
|
|
|
|
|
|
|
|
|
|
|
|
|
|
|
|
|
|
|
|
|
l |
|
|
|
|
|
|
|
|
|
|
|
|
|
|
|
|
|
|
|
|
|
|
|
|
|
|
|
|
|
|
|
|
|
|
|
|
|
|
|
|
|
|
|
|
|
|
|
|
|
|
|
|
|
|
|
|
|
|
|
|
|
|
|
|
|
|
|
|
|
|
|
|
|
|
||||||
|
|
|
|
|
|
|
|
|
|
|
|
|
|
|
|
|
|
|
|
|
|
|
|
|
|
|
|
|
|
|
|
|
|
|
|
|
|
|
|
|
|
|
|
|
|
oo |
|
|
|
|
|
|
|
|
|
|
|
|
|
|
|
|
|
|
|
|
|
n |
a |
|
|
|
|
|
|
|
|
|
|
|
|
|
|
|
|
|
|
|
|
|
|
|
|
|
|
|
|
|
|
|
|
he |
|
|
|
|
|
|
|
|
|
|
|
|
|
|
|
|
|
|
|
|
|||
|
|
|
|
|
|
|
|
|
|
|
|
|
|
|
|
|
|
|
|
|
|
|
|
|
|
|
|
|
|
|
|
|
|
|
|
|
|
|
|
|
|
|
|
|
|
ch |
|
|
|
|
|
|
|
|
|
|
|
|
|
|
|
|
|
|
|
|
|
io |
|
|
|
|
|
|
|
|
|
|
|
|
|
|
|
|
|
|
|
|
|
|
|
|
|
|
|
|
|
|
|
|
t |
|
|
|
|
|
|
|
|
|
|
|
|
|
|
|
|
|
|
|
|
|
|
||
|
|
|
|
|
|
|
|
|
|
|
|
|
|
|
|
|
|
|
|
|
|
|
|
|
|
|
|
|
|
|
|
|
|
|
|
|
|
|
|
|
|
|
|
|
|
|
|
|
|
|
|
|
|
|
|
|
|
|
|
|
|
|
|
|
|
|
|
|
|
|
|
|
|
|
|
|
|
|
|
|
|
|
|
|
|
|
|
|
|
|
|
|
|
|
|
|
|
|
O |
|
|
|
|
|
|
|
|
|
|
|
|
|
|
|
|
|
|
|
|
|
|
|
|||
|
|
|
|
|
|
|
|
|
|
|
|
|
|
|
|
|
|
|
|
|
|
|
|
|
|
|
|
|
|
|
|
|
|
|
|
|
|
|
|
|
|
|
|
|
s |
|
|
|
|
|
|
|
|
|
|
|
|
|
|
|
|
|
|
|
at |
|
|
|
|
|
|
|
|
|
|
|
|
|
|
|
|
|
|
|
|
|
|
|
|
|
|
|
|
|
|
|
|
|
|
|
|
|
|
|
|
|
|
|
|
|
|
|
|
|
|
|
|
|
|
|
|
|
|
||
|
|
|
|
|
|
|
|
|
|
|
|
|
|
|
|
|
|
|
|
|
|
|
|
|
|
|
|
|
|
|
|
|
|
|
|
|
|
|
|
|
|
|
|
- |
|
|
|
|
|
|
|
|
|
|
|
|
|
|
|
|
|
re |
|
|
|
|
|
|
|
|
|
|
|
|
|
|
|
|
|
|
|
|
|
|
|
|
|
|
|
|
|
|
|
|
|
|
|
|
|
|
|
|
|
|
|
|
|
|
|
|
|
|
|
|
|
|
|
|
|
|
|||||
|
|
|
|
|
|
|
|
|
|
|
|
|
|
|
|
|
|
|
|
|
|
|
|
|
|
|
|
|
|
|
|
|
|
|
|
|
|
|
|
|
|
Pr |
e |
|
|
|
|
|
|
|
|
|
|
|
|
|
|
|
|
|
|
|
|
|
|
|
|
|
|
|
|
|
|
|
|
|
|
|
|
|
|
|
|
|
|
|
|
|
|
|
|
|
|
|
|
|
|
|
|
|
|
|
|
|
|
|
|
|
|
|
|
|
|
|
|
|
|
|
|
|
|
||||
|
|
|
|
|
|
|
|
|
|
|
|
|
|
|
|
|
|
|
|
|
|
|
|
|
|
|
|
|
|
|
|
|
|
|
|
|
|
|
|
|
|
|
|
|
|
|
|
|
|
|
|
|
|
|
|
|
|
R |
ec |
|
|
|
|
|
|
|
|
|
|
|
|
|
|
|
|
|
|
|
|
|
|
|
|
|
|
|
|
|
|
|
|
|
|
|
|
|
|
|
|
|
|
|
|
|
|
|
|
|
|
|
|
|
|
|
|
|
|
|
|
|
|
||||
|
|
|
|
|
|
|
|
|
|
|
|
|
|
|
|
|
|
|
|
|
|
|
|
|
|
|
|
|
|
|
|
|
|
|
|
|
|
|
|
|
|
|
|
|
|
|
|
|
|
|
|
|
|
|
|
|
|
|
|
|
|
|
|
|
|
|
|
|
|
|
|
|
|
|
|
|
|
|
|
|
|
|
|
|
|
|
|
|
|
|
|
|
|
|
|
|
|
|
|
|
|
|
|
|
|
|
|
|
|
|
|
|
|
|
|
|
|
|
|
|
|
|
|
||
|
|
|
|
|
|
|
|
|
|
|
|
|
|
|
|
|
|
|
|
|
|
|
|
|
|
|
|
|
|
|
|
|
|
|
|
|
|
|
|
|
|
|
|
|
|
|
|
46 |
|
|
|
|
|
|
|
|
|
|
|
|
|
|
|
|
|
|
|
|
|
|
|
|
|
|
|
|
|
|
|
|
|
|
|
|
|
|
|
|
|
|
|
|
|
|
|
|
|
|
|
|
|
|
|
|
|
|
|
|
|
|
|
|
|
|
|
|
|
|
|
|
|
|
|
|
|

Automatic smoke alarm analyses in other buildings (Tables 3.1 to 3.3, Figure 3.3)
Introduction
3.9This section looks at the effectiveness of smoke alarms and the likely causes of failure on those occasions when alarms did not operate. The assessment and analysis presented here is based (as elsewhere in this report) on fires attended by the fire and rescue service.
Any fires involving alarms where no emergency call was made will not be recorded, meaning that effectiveness of automatic fire alarms may be understated. See paragraph 2.26 for further details in relation to domestic smoke alarms.
Automatic smoke alarm presence and operation
3.10Automatic smoke alarms were not present in 50% (12,500) of all other building fires in 2011-12. These fires resulted in 21 fatalities and a further 502 non-fatal casualties. For the remaining 49% of other building fires where an automatic smoke alarm was present:
•The automatic fire alarm operated and raised the alarm in 31% (7,600 fires);
•Operated but did not raise the alarm in 5% (1,200 fires);
•Failed to operate altogether in 12% (3,000 fires).
This follows a broadly similar pattern to that for dwelling fires (37%, 10% and 18% respectively).
Figure 3.3: Fires in other buildings by automatic smoke alarm presence and operation, Great Britain, 2011/12
Alarm operated but did not raise the alarm
5%
Alarm operated and raised the alarm
33%
Alarm not present 50%
Alarm did not operate 12%
47

3.11The number of fires in other buildings where the automatic smoke alarm failed to operate was 2,900 in 2011-12, slightly lower than the 3,000 in 2010-11. The main reason why automatic fire alarm failed to operate was due to fire products not reaching the alarms –
47% of such fires. Other reasons include other act which prevented alarm from operating (21%) and poor positioning of the alarm (13%).
3.12The number of fires in other buildings where the automatic fire alarm operated, but did not raise the alarm has increased slightly to 1,200 in 2011-12 from 1,100 in 2010-11. However, there was no fatality because of this in 2011-12. The main reasons in 2011-12 were that a person raised the alarm before the alarm operated (70%) or there was no-one within earshot of the alarm (19%).
Table 3.1: Fires and casualties from fires in other buildings by presence and operation of smoke alarm1, Great Britain, 2006/072011/12
Presence and operation of smoke alarm
Present, operated & raised the alarm
Present, |
Present, |
|
|
|
operated, but |
but did |
Absent & |
Total |
|
did not raise |
not |
Unspecified |
||
|
||||
the alarm |
operate |
|
|
Fires |
|
|
|
|
|
2006/07 |
8,915 |
941 |
2,335 |
19,558 |
31,749 |
2007/08 |
7,914 |
955 |
2,457 |
17,861 |
29,186 |
2008/09 |
7,631 |
1,002 |
4,530 |
12,910 |
26,074 |
2009/10 |
- |
- |
- |
- |
- |
2010/11 |
8,164 |
1,131 |
3,004 |
12,741 |
25,040 |
2011/12 |
7,554 |
1,197 |
2,930 |
12,462 |
24,143 |
Fatal casualties |
|
|
|
|
|
2006/07 |
6 |
2 |
1 |
21 |
30 |
2007/08 |
12 |
1 |
1 |
21 |
35 |
2008/09 |
10 |
0 |
2 |
5 |
17 |
2009/10 |
- |
- |
- |
- |
26 |
2010/11 |
5 |
1 |
2 |
11 |
19 |
2011/12 |
2 |
0 |
2 |
21 |
25 |
Non-fatal casualties |
|
|
|
|
|
2006/07 |
485 |
56 |
138 |
723 |
1,402 |
2007/08 |
442 |
56 |
102 |
629 |
1,229 |
2008/09 |
412 |
55 |
204 |
515 |
1,186 |
2009/10 |
- |
- |
- |
- |
- |
2010/11 |
531 |
77 |
132 |
502 |
1,242 |
2011/12 |
498 |
64 |
169 |
502 |
1,233 |
1includes smoke a very small number of other automatic alarms such as heat alarm
-Data not available due to incomplete records from one Fire and Rescue Authority in 2009/10.
48

Table 3.2 Fires in other buildings with fire alarm where alarm did not operate by reason, Great Britain, 2006/07-2011/12
Year |
2006/07 |
2007/08 |
2008/09 |
2009/10 |
2010/11 |
2011/12 |
|
|
|
|
|
|
|
|
|
Reason for not operating |
|
|
|
|
|
|
|
Missing battery |
2% |
1% |
1% |
- |
0% |
1% |
|
Battery failure / flat |
.. |
1% |
.. |
- |
0% |
0% |
|
Other act preventing alarm from |
8% |
8% |
6% |
- |
23% |
21% |
|
operating inc. turned off |
|||||||
|
|
|
|
|
|
||
Fire products did not reach detector(s) |
77% |
75% |
73% |
- |
44% |
47% |
|
Poor positioning of detector(s) |
.. |
1% |
1% |
- |
14% |
13% |
|
Faulty system inc. incorrectly installed |
4% |
4% |
3% |
- |
3% |
3% |
|
Insufficient detectors |
.. |
.. |
.. |
- |
.. |
.. |
|
Other reason (not act or omission) |
.. |
.. |
.. |
- |
.. |
.. |
|
System apparently operational after fire |
.. |
.. |
.. |
- |
.. |
.. |
|
Other1 |
9% |
10% |
15% |
- |
14% |
14% |
|
Unspecified |
0% |
0% |
1% |
- |
1% |
1% |
|
Total |
100% |
100% |
100% |
- |
100% |
100% |
|
|
|
|
|
|
|
|
|
1 Other includes 'not known' and 'system damaged by fire' |
|
|
|
|
|
|
|
.. Not applicable |
|
|
|
|
|
|
- Data not available due to incomplete records from one Fire and Rescue Authority in 2009/10
Table 3.3: Fires in other buildings with an automatic fire alarm where alarm operated but did not raise the alarm by reason, Great Britain, 2006/072011/12
Year |
2006/07 |
2007/08 |
2008/09 |
2009/10 |
2010/11 |
2011/12 |
Reason |
|
|
|
|
|
|
Person raised the alarm before |
|
|
|
|
|
|
system operated |
69% |
66% |
68% |
- |
71% |
70% |
No person in earshot |
14% |
17% |
14% |
- |
17% |
19% |
Poor positioning of alarm |
1% |
1% |
0% |
- |
0% |
0% |
Occupants failed to respond |
2% |
1% |
2% |
- |
2% |
1% |
Faulty system inc. incorrectly |
|
|
|
|
|
|
installed |
3% |
1% |
1% |
- |
0% |
0% |
Other including not known e.g. |
|
|
|
|
|
|
where system too badly damaged |
11% |
13% |
14% |
- |
10% |
10% |
Total |
100% |
100% |
100% |
- |
100% |
100% |
‘- Data not available due to incomplete record from one fire and rescue authority in 2009/10 |
|
|
|
|||
|
|
49 |
|
|
|
|

Chapter 4 – Road Vehicle Fires
Introduction (Table 16)
4.1Road vehicle fires in 2011-12 totalled 28,000 in 2011-12, down by 14% from 32,600 in
2010-11. The 2011-12 total represented the lowest in more than a decade and declined by nearly three quarters from its peak in 2001/02.
4.2A breakdown of the road vehicles figure shows that the majority (65%) of fires occurred in cars, 10% were in vans, 4% were in lorries and 2% in buses or minibuses. The number of car fires was 17% lower than in 2010-11 and 79% lower than in 2001-02.
Casualties (Table 6)
4.3The number of fatalities in road vehicle fires in 2011-12 was 37, down by 7 from 44 in
2010-11. This equates to 1.3 fatalities per 1,000 fires and contrasts with a fatality rate for dwellings of 6.6 fatalities per 1,000 fires. Time series data shows that road vehicle fire fatalities have been declined by nearly a half in over a decade.
Figure 4.1: Number of fatalities in fires in road vehicle, Great Britain, 2000/01 - 2011/12
|
80 |
|
|
|
|
|
|
|
|
|
|
|
|
|
|
|
|
|
70 |
|
|
|
|
|
|
|
|
|
|
|
|
|
|
|
|
of fatalities |
60 |
|
|
|
|
|
|
|
|
|
|
|
|
|
|
|
|
50 |
|
|
|
|
|
|
|
|
|
|
|
|
|
|
|
|
|
40 |
|
|
|
|
|
|
|
|
|
|
|
|
|
|
|
|
|
Number |
30 |
|
|
|
|
|
|
|
|
|
|
|
|
|
|
|
|
20 |
|
|
|
|
|
|
|
|
|
|
|
|
|
|
|
|
|
|
|
|
|
|
|
|
|
|
|
|
|
|
|
|
|
|
|
|
10 |
|
|
|
|
|
|
|
|
|
|
|
|
|
|
|
|
|
0 |
|
|
|
|
|
|
|
|
|
|
|
|
|
|
|
|
|
|
1 |
|
2 |
|
3 |
|
5 |
6 |
|
7 |
|
8 |
|
9 |
|
p |
|
|
/0 |
|
/0 |
|
/0 |
|
|
/0 |
|
/0 |
|
/0 |
|
/0 |
2 |
|
|
|
00 |
|
01 |
|
02 |
2003/04 |
2004/0 |
2005 |
|
06 |
|
07 |
|
08 |
2009/10 2010/11r 2011/1 |
|
|
0 |
0 |
0 |
0 |
0 |
0 |
|
||||||||||
|
2 |
|
2 |
|
2 |
|
2 |
|
2 |
|
2 |
|
|
||||
|
|
|
p=provisional; r= revised |
|
|
|
|
|
|
|
|
|
|||||
50
4.4The number of non-fatal casualties in road vehicle fires increased slightly to 600 in 2011-
12 from 520 in 2010-11. This is much lower than the levels recorded in 2000-01 (700 nonfatal cases). These latest figures equate to 21 non-fatal casualties per 1,000 fires, compared with 205 in dwellings and 51 in other buildings.
51

Chapter 5 – Outdoor Fires
Introduction (Tables 1c, 6 and 5.1)
5.1Primary and secondary3 outdoor fires totalled 193,300 in 2011-12. Of which 85,600 (44%) were refuse fires (including bonfires, refuse containers), 57,200 (30%) were grassland and heathland fires, 28,800 (14%) were road vehicle fires and 21,700 (11%) were other outdoor fires (including derelict buildings). Further details on road vehicle fires are given in
Chapter 4. The remainder of this chapter mainly covers other types of outdoor fires.
5.2Relatively fewer casualties occur in outdoor fires, other than road vehicle fires. In 2011-12 there were 31 fire related fatalities, and 540 non-fatal casualties in outdoor fires (excluding road vehicle fires), amounting to around one death and 25 non-fatal casualties per 1,000 outdoor fires.
Table 5.1: Primary and secondary3 outdoor fires by location, Great Britain, 2000/012011/12
Year |
Total |
Road |
Grassland, etc1 |
Refuse2 |
Other |
|
fires |
vehicles |
|
|
outdoor fires |
|
|
|
|
|
|
2000/01 |
323.9 |
90.9 |
50.8 |
139.2 |
43.1 |
2001/02 |
404.3 |
99.7 |
69.6 |
178.2 |
56.8 |
2002/031 |
395.0 |
93.0 |
81.4 |
166.0 |
54.6 |
2003/04 |
460.3 |
86.1 |
129.3 |
188.9 |
55.9 |
2004/05 |
311.1 |
67.9 |
54.8 |
148.0 |
40.5 |
2005/06 |
309.8 |
61.5 |
67.3 |
142.9 |
38.0 |
2006/07 |
318.2 |
55.6 |
84.8 |
140.8 |
37.1 |
2007/08 |
275.2 |
47.6 |
56.2 |
139.2 |
32.3 |
2008/09 |
202.0 |
42.4 |
34.9 |
101.0 |
23.8 |
2009/10 |
- |
- |
- |
- |
- |
2010/11 |
203.9 |
33.7 |
61.6 |
87.4 |
21.3 |
2011/12 |
193.3 |
28.8 |
57.2 |
85.6 |
21.7 |
1includes grasslands, woodland, heathland, scrub land, domestic garden, vegetation, straw and stubble burning.
2includes large and small refuse/rubbish container and landfill sites
Figures in thousand and figures are rounded and the components do not necessarily sum to the independently rounded table
- data not available due to incomplete records from one Fire and Rescue Authority in 2009/10
3 Whereas other sections of this publication focus on primary fires (those involving property and/or any casualties and/or five or more appliances and for which more detailed information is collected), this outdoor fires chapter considers all outdoor fires regardless of whether they qualified as being ‘primary fires’. Most outdoor fires are ‘secondary’ fires since they involved no property, no casualties and were not attended by five or more appliances.
52

5.3The number of grassland and heathland fires is dependent on persisting weather conditions. In 2011-12, there were 57,200 such fires recorded. This was 4,000 less than in
2010-11 and 72,000 less than the peak in 2003-04.
5.4Refuse fires decreased in 2011-12 to 85,600 from 87,400 in 2010 -11 and reached at the lowest level over the decade.
5.5There were 28,800 road vehicle fires in 2011-12, a decrease of 14% from 2010-11 which itself had been the lowest level for more than a decade.
When fires occur (Table 5.2)
5.6Outdoor fires exhibit a strong seasonal pattern mainly due to the effect of the weather on grassland fires. There was an average of 374 grassland fires per day in April 2011 compared with just 127 fires per day in September 2011. Between April and September there were 1,355 grassland fires compared with just 518 fires in the following six months. This coincides with the prevailing warm, sunny spring with below average rainfall before the wetter, duller days at average or below average temperatures later. Refuse fires showed a gradual decline from its peak of 346 fires in April to only 118 in December. Fires in dwellings showed a different, less distinct seasonal variation, with generally higher numbers of fires per day occurring in the winter months.
Table 5.2: Daily rates of fires by month and location, Great Britain, 2011/12
|
|
|
|
|
|
|
|
|
|
Chimney |
|
Total |
Buildings |
|
|
Outdoor Fires |
|
|
fires |
||
|
|
|
|
|
|
|
|
|
|
|
|
primary |
|
|
|
Road |
Grassland |
Refuse2 |
Other |
|
|
|
fires |
Dwellings |
Other |
|
vehicles |
etc1 |
Outdoor |
|
|
|
2011/12 |
745 |
121 |
74 |
79 |
157 |
234 |
59 |
21 |
||
Apr |
1152 |
132 |
87 |
93 |
374 |
346 |
98 |
21 |
||
May |
958 |
122 |
92 |
84 |
291 |
270 |
85 |
12 |
||
Jun |
738 |
117 |
79 |
81 |
158 |
231 |
66 |
6 |
||
Jul |
831 |
119 |
78 |
81 |
207 |
267 |
76 |
4 |
||
Aug |
821 |
113 |
78 |
93 |
198 |
264 |
69 |
5 |
||
Sep |
670 |
113 |
71 |
83 |
127 |
218 |
52 |
7 |
||
Oct |
738 |
119 |
74 |
77 |
132 |
256 |
64 |
16 |
||
Nov |
682 |
118 |
67 |
76 |
53 |
287 |
59 |
23 |
||
Dec |
455 |
129 |
61 |
63 |
23 |
118 |
24 |
37 |
||
Jan |
489 |
124 |
59 |
70 |
30 |
137 |
28 |
40 |
||
Feb |
580 |
132 |
68 |
74 |
57 |
165 |
33 |
51 |
||
Mar |
822 |
117 |
69 |
73 |
223 |
253 |
56 |
30 |
||
1 includes grasslands, woodland, heathland, scrub land, domestic garden, vegetation straw and stubble burning.
2 includes large and small refuse/rubbish container and landfill sites
53