

0229590_C6FC0_solomon_negash_michael_e_whitman_amy_b_woszczynski_handbook-1
.pdfous. However, in terms of enrollments, they are not anywhere close to those of some Asian giants such as China TV University (CTVU) and the Indira Gandhi National Open University (IGNOU). At IGNOU enrollment is now around 1.5 million and is present in 35 countries (IGNOU, 2007) and that could be true of CTVU too. In a sense, they could be dominant units in the domain of DL. The demand in general for DL is burgeoning and will continue to support the growth of new relatively smaller units. But considering that though the expectation is that enrollment would be global, in fact it has been largely local will the incremental market be large enough to support the new mega or huge (enrollment-wise) units? This is the main concern of this study.
On account of the exploratory nature of this study, all DL units, regardless of whether in the private or the public (government) sector, have been treated alike. The scope of this study does notallowtheundertakingofafull-fledgedsocial costbenefitanalysis(SCBA) of DL projects which would be virtually mandatory wherever tax dollars are drawn on. Also such an SCBA would take into account environmental factors such as minimizing carbon emissions and factor in other good externalities of DL as well.
Itwillbeincreasinglytrickytofind,ab initio, mega enrollments such as 100,000+ because of market segmentation in the USA, unless substantial population increases occur. Later we suggest afterastudyofthescale-relatedcoststhatmodular increments in DL gear and equipment, and also staff, to match enrollments would perhaps be a solution.
The phenomenal growth in DL raises several controversial questions that relate to the quality of education (Gibson, 1998) that is delivered predominantly by part-time instructors. Such instructors are not compensated at the same rate as full-time instructors and as such there could be differences in the quality of instruction. It is equally possible that part-timers do a much better job too, making it a great learning experience and
Economies of Scale in Distance Learning (DL)
an effective outcome for one’s efforts. The South African National Council on Higher Education found in 1996 that DL was more effective in learning outcomes than “face-to-face” education and the costs were lower too. (For conclusions quite the contrary see Ketterer & George, 2006.)
In response to an overall rapidly expanding market DL facilities at times have been overdimensioned at substantial costs in the hope of cheapening future expansion of the DL facility.
Not knowing the ramifications of such investments and economics of such decisions would be tantamount to rolling the die in regard to the economic viability of DL units. In-depth analysis of the options in this study could help moderate the risks. A review of the economics of scalability of DL facilities is thus an urgent and real need.
factoRs influencing scale-Related costs
Empirical data clearly establish that the technology employed to deliver DL weighs in heavily on average costs and scale-related cost savings. This is true wherever there is capital deepening with heavy upfront investment in technology. In the area of DL, for instance, while computer conferencing has the lowest costs, broadcast television has the highest. Audio cassette, videoconferencing, computer-based learning, and others fall in between (Harrison, 1999). All media costs keep declining even if insignificantly or flattenout,withoutcurvingupfordiseconomies.
The same fact has been observed at other mega universities.
Technology calls the shots in the scale of costs. Besides technology, economies of scale in DL depend on a variety of factors and no two locations or DL institutions seem to be the same. The variety begins with whether the DL school is for-profitoracharitableorstateunit.Thelatteris likely to be an established unit already endowed with its campus and buildings and other facilities

Economies of Scale in Distance Learning (DL)
forcoursedevelopment.Second,forcostpurposes, it does matter if it is a designated DL unit or an on-going university that is diversifying into DL. Third is the nature of the course: whether it is a highly technical one such as a C++ or an Oracle programming course, or a non-technical English literature course. The more technical or novel the course, the more expensive would be the cost of course development and delivery. Fourth, course development costs are also dependent on materials that would be made available to the DL student. Table 2 clearly brings out the very wide spread between a bare bones on line course and an all-input providing sumptuous course. The difference in costs with each additional material is striking.
Table 2 brings out that the more technological the medium of delivery, the more expensive also is the course development cost. Instructional technology impinges on the up-front investment costs which in turn influence scale-related economies or diseconomies. Distance education is multifaceted offering a multiplicity of courses from accounting to zoology through an assortment of Internet technology that is an intermix of snail-mail, voice-mail, immersive 3-D chatroom, blackboard, e-mail, customizable bulletin board, print materials, CD-ROMs, e-libraries and e-databases, instant message, videoconference, teleconference (Sims, 2006) and so forth. In some instancesitincludeson-campuslearningactivities
Table 2. Cost of developing a three-unit Internet course (US$) (Source: Rumble, 2001)
(Arizona Learning Systems, 1998)
Course Outlines and Assignments |
6,000 |
|
|
Text |
12,000 |
|
|
Text with Reference Material |
18,000 |
|
|
Text with Ref. Material and Images |
37,500 |
|
|
Audio and Video |
120,000 |
|
|
Simulations |
250,000 |
|
|
Virtual Reality |
1,000, 000 |
|
|
or testing. Additionally, there is also electronic networking through threaded discussions (Walls, 2006). And yet another option is synchronous or asynchronous environment in which to deliver education. The permutations possible with these several IT and non-IT media/techniques, say ten, are 10! (ten factorial) or 3,628,800. This diversity of choices in to reach DL to the student makes it obvious that costs too would be varied depending on the choice of instructional technology. No two DLprojectsarelikelytohaveidenticalcosts.Other critical factors impinging on DL costs are:
1.Instructor/tutor salaries: This expense varies widely from a mere 10% in developing countries such as India and China to a heavy 37% in the U.S. (PRG Inc., p. 115).
2.Faculty-student ratios: The larger the number of students per faculty person, the lower would be the costs and vice versa.
3.Course development costs: This has been discussed earlier. There are overlaps with instructor/tutor salaries above.
4.Teaching loads of faculty and whether faculty is full-time, or adjunct, or even graduate assistants.
5.Sacrificeoffacultytimeforresearchand service:DesignatedDLinstitutionsmaynot havefacultyundertakingresearch.However, at other campuses difficult choices would have to be made in this regard.
viability of Mega online univeRsity
Very large DL schools, one would speculate, have been hugely successful, going by their proliferation,bothfromtheeducationalandbusinesspoints of view. However, currently what is germane is whether in the coming years new online units, let alone mega units, can repeat such success. Will these trends continue? There is need for circumspection. The market eventually, sooner
than later at least in America, may not generate a large enough demand to justify new mega open universities of the IGNOU kind, or even of the University of Phoenix type. They may be significantly smaller, impacting on the viability of DL units.
The new qualms about the economic viability of DL are triggered, inter alia, by the emerging constraints on the scale of operations. Mega universities like the ones listed above cannot be replicated anymore and there would have to be garden variety, relatively smaller units that cater to local or at the most state-level populace. It is true that during the last academic year UMass enrollments jumped 23% to 23,682 despite there being no dearth of higher learning institutions in the state. What is noteworthy nevertheless, is that just 28% of students at UMass are out of state. UniversityofIllinoislauncheditsonlineprograms on the same lines with a goal of 10,000 students to be enrolled in 5 years and 50,000 in 10 years (Stokes, 2006; Inside Higher Education – Daily Update). The strategic point at this phase of distance education (DE) is that “most enrollments are local” (Primary Research Group, 1997). If that is so, even if a DL college or institution has world-wide capabilities, it would be a “college withoutboundaries”moreinnameandmuchless in student enrollment, unless it can be claimed that any reputed school can have a world-wide enrollment eventually raising it to the status of mega university. Essentially, they would be local to a geographical area and not at all global. In this sense, there would be a paradigm shift with a negative impact on their economics.
ThesoberingfindingsofthePrimaryResearch
Group,Inc.callforanewanalysisoftheeconomics of DL. The group stated that “40% of the distance education programs operate at a loss. 25% of such programsoperatewithaprofitmarginoflessthan
10% above costs while another 25% operate with a profitmarginbetween11%and30%abovecosts.
10%ofdistanceeducationprogramsearnbetween
Economies of Scale in Distance Learning (DL)
31% and 50% above costs” (PRG Inc., 1997a). Thanks to what appears to be an overcrowding of the DL business area, 40% of the institutions are in the red, and possibly more may join their ranks. While the University of Phoenix is a success, the New York University Online is considered not a success. The public policy implication would then be that when it becomes harder for DL units to resort to mass education and scale, and thereby minimizecosts,theeconomicsofbrickandmortar campuses become more appealing albeit the fact that they have much leeway to cover to catch up with DL units in costs and overall viability.
caPital deePening and oveR-diMensioning
If the growth of mega universities is thus predicated by waning numbers of out-of-state online students, let alone international students, and with state and local populace constituting the bulk of the online enrollments, new questions would arise about the size of such units, and their costs and revenues. Economies of scale account for a significant part of the relatively lower costs of online education, in particular for new institutions entering DL. If the numbers of students enrolling into them do not turn out to be large enough (e.g., the numbers required under a minimum efficient scale [MES] size unit such as 25,000 students), economies of scale may be lost and over-dimensioning of facilities is bound to occur. The choice of 25,000 as the MES, if sounds arbitrary or random, the explanation why it is not so, is simple. In 1971, when the UKOU was set up, the Open University started with 25,000 students and grew to 40,000 the second year (Daniel, 2003). Also in his 2004 study Anthony Dean mentions a threshold size of 20,000. Since then cost inflation would have been substantial.
Accordingly, for planning purposes, this author has increased the MES by 25% to 25,000, a ball-
Economies of Scale in Distance Learning (DL)
parkquantity.Capitalintensity,notlaterjustified bythenumberofstudentsregisteringforcourses at the DL institutions would result in heavier per capita capital costs and therefore higher per studentaveragetotalcosts,negativelyimpacting the bottom line of the DL providers. The savings thatemergefrombetterutilizationofmortar-brick campuses for DL projects would be lost.
As shown in Table 1, one could use the break even point (BEP) method to estimate the student enrollment necessary to break even. If, say, upfront investment is $50 million and the fee for a one-credithouris$125,andthevariablecostsare $25perstudentperhour,thecontributionmargin would be $100 (125-25) and the DL unit would have to vend 500,000 ($50,000,000/100) credit hours. If on an average, a typical student accepts a 25 credit hour instruction load during a year, there would have to be 20,000 students merely to break even. If the credit hours are less, say 20 hours per year, the students on the roll would have to be 25,000, and so forth. If a 20% return is expected on the upfront investment of $50 million, other things being the same, that is, the fee is $125, the contribution margin is $100, and 25 credit hour instruction per student is typical, there would have to be 24,000 {($50 million + 20%) / (100 * 25)} students on the rolls.
A minimum enrollment of 20,000 students is valid under the above assumptions relating to the upfront investment, minimum credit hours, the fees, and the returns. Even if any one of the assumptions is altered, the estimates need to be redone. The costs and course fees for different locations would indeed vary widely. The BEP could be as low as 5,000 and as high as 30,000 fee-paying students. It is unrealistic to postulate that larger the capacity of a DE facility, lower also would be the per student costs under all conditions. A look at the L-shaped average cost curve(AppendixA)shouldbringthispointhome. Keepingthisfactinmind,keyitemsofequipment ortechnologyforDLareidentifiedbelowinorder to pinpoint capital costs that would contribute to savings arising out of scale of operations.
The PRG Survey of
Technology Preference
The big-ticket items of expenditure are listed in the survey of 44 DL programs by the Primary Research Group (1998). The group states that four technological approaches dominate the DL market according to the technology selected: a) The Internet b) live or tape broadcast/wire technologybasedonsatellite,televisionorcable,and c) snail mail and phone.
Pareto analysis (arranging items in terms of percentage share) of the information on Table 3 wouldhighlightthatInternet(27.1%ofthe44units surveyeduseasthePrimaryMediumfortheirDE programs)followedbyinteractivevideo(23.95%) wouldbethemaintech-basedmediathatmayoffer opportunities for savings. Mail correspondence, rankingasthethirdlargestmedium, wouldoffer little, if any, scale-related economy in view of its variable cost nature, the total of such costs being afunctionofvolume.Opportunitiesforeconomy mayexistinafewothertechnology-basedmedia suchastapevideo,videocassette,tapeandcable broadcast,andsimilarmedia,butagainthescope for cutback on costs would not be large, in view of their semifixed nature.
IGNOU Case Study
Mega universities mentioned elsewhere such as The China TV University System with about a million student admissions per year, The Centre National d’Enseignement a Distance in France, with 350,000 students, Universitas Terbuka in Indonesia with 350,000 students, Payame Noor University in Iran with 120,000 students, University of South Africa with 150,000 students, and several others obviously enjoy economies of scale and economic viability. The relevant data for one such university, Indira Gandhi National Open University (IGNOU), is presented in Table 4 and in the charts in Appendix A.
339
Economies of Scale in Distance Learning (DL)
Table 3. Technology preferences of 44 units (Compiled PRG Inc., 1997)
Technology |
% using as Primary Medium |
% Intending Greater Use |
% Intending Lesser Use |
|
|
|
|
Mail Correspondence |
19.95 |
23 |
18 |
|
|
|
|
Fax |
5.73 |
38.5 |
7.7 |
|
|
|
|
Fax Broadcasting |
2.78 |
7.9 |
7.9 |
|
|
|
|
E-mail Correspondence |
17.61 |
75 |
2.5 |
|
|
|
|
Internet |
27.10 |
92.5 |
0 |
|
|
|
|
Audio Cassette |
3.90 |
7.7 |
12.8 |
|
|
|
|
Live Audio |
4.41 |
12.8 |
2.6 |
|
|
|
|
Live Radio |
0.05 |
2.6 |
5.1 |
|
|
|
|
Telephone |
10.27 |
20.5 |
7.7 |
|
|
|
|
Voice Mail |
7.17 |
43.6 |
2.5 |
|
|
|
|
Interactive Voice Response |
5.00 |
22.5 |
2.5 |
|
|
|
|
Videocassette |
14.31 |
36.8 |
7.9 |
|
|
|
|
Tape Video |
17.80 |
23 |
7.7 |
|
|
|
|
Tape Broadcast |
9.07 |
30.8 |
5.1 |
|
|
|
|
Tape Cablecast |
9.76 |
35.9 |
2.6 |
|
|
|
|
Tape Satellite |
2.49 |
23.1 |
2.5 |
|
|
|
|
Live Video |
9.12 |
28.9 |
2.6 |
|
|
|
|
Live Broadcast |
2.93 |
20.5 |
5.1 |
|
|
|
|
Live Cablecast |
3.46 |
20.5 |
2.5 |
|
|
|
|
Live Satellite |
2.51 |
23.7 |
2.6 |
|
|
|
|
Interactive Video |
23.95 |
64.1 |
5.1 |
|
|
|
|
Computer to Computer Video- |
0.05 |
59 |
2.6 |
conferencing |
|
|
|
|
|
|
|
CD-ROM |
0.61 |
56.4 |
0 |
|
|
|
|
In the initial stages the decline in costs is shown to be substantial, although at later stages with larger numbers such as 40,000 students and more particularly after 70,000 students, the declineincostsissmallthoughnotinsignificant.
The economies associated with scale are well demonstrated in the IGNOU study. The cost curve based on this study slopes downward. Savings in costs are based mostly on the modular build up of the technical architecture for DE. Size related economies of the firm are important too. The
LRACC is L-shaped with little incremental scalerelated economies after 100,000 students.
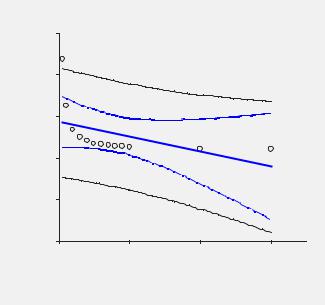
The least squares regression equation is Y = 4312.4 – 0.018X and the plot is shown in Appendix A (p < 0.0910). The good fit of the negative sloping regression line indicates that it is safe to work on the basis of overtones of significant association between the two variables under study. The L shape of the average cost curve could mean that after 100,000 student enrollments, there is not much of scale-related economies, the costs becoming somewhat constant. There needs to be no fears of increasing costs or diseconomies due to excess students either, considering DL units with more than a million students, too, are economically viable today.
0
Economies of Scale in Distance Learning (DL)
Table 4. Scale economies: IGNOU (Source: Rumble, 1997)
# of Students |
Total Costs |
Average |
% Decline in |
Marginal Cost |
|
|
|
|
|
|
|
|
Rupees |
Costs |
Decline in |
Ave. Costs |
Per |
|
(Millions) |
(Rupees) |
Ave. Costs |
Student |
|
|
|
||||
5000 |
59.522 |
11, 904.40 |
|
|
|
|
|
|
|
|
|
10000 |
62.508 |
6,250.80 |
5,653.60 |
47.49 |
597.2 |
|
|
|
|
|
|
20000 |
68.478 |
3,423.90 |
2,826.90 |
45.22 |
597.0 |
|
|
|
|
|
|
30000 |
74.449 |
2,481.63 |
942.27 |
27.52 |
597.1 |
|
|
|
|
|
|
40000 |
80.421 |
2,010.53 |
471.11 |
18.98 |
597.2 |
|
|
|
|
|
|
50000 |
87.521 |
1,750.42 |
260.11 |
12.94 |
710.0 |
|
|
|
|
|
|
60000 |
96.218 |
1,603.63 |
146.79 |
8.39 |
869.7 |
|
|
|
|
|
|
70000 |
104.916 |
1,498.80 |
104.83 |
6.54 |
869.8 |
|
|
|
|
|
|
80000 |
113.615 |
1,420.19 |
78.61 |
5.25 |
869.9 |
|
|
|
|
|
|
90000 |
122.313 |
1,359.03 |
61.15 |
4.31 |
869.8 |
|
|
|
|
|
|
100000 |
131.011 |
1,310.11 |
48.92 |
3.60 |
869.8 |
|
|
|
|
|
|
200000 |
217.993 |
1,089.97 |
220.15 |
16.80 |
869.8 |
|
|
|
|
|
|
300000 |
304.975 |
1,016.58 |
73.38 |
6.73 |
869.8 |
|
|
|
|
|
|
The relationship between costs and students is not necessarily linear and therefore calls for looking at other related variables, a conclusion this chapter has been promoting. The Pearson plot based on data in columns 1 and 3, linking average costs to number of students, does indicate cost economies. However, the computed r value of –0.4899 being lower than the critical r value of
0.5529indicatesthatthecorrelationcoefficientis not significant for n = 13. And yet the coefficient of determination (r2) being 21%, a sizeable part of the variation in costs, is explained by scaling.
The economies of scale witnessed in IGNOU may not be emblematic of DL elsewhere, given the vast differences in capital costs as well as in capital deepening. Most DL facilities are purposely over-dimensioned with the objective of reducing future expansion costs. By the same token, the economies gained by IGNOU may be relatively larger at other locations depending upon how much more capital intensive the DL operations are and also how much more pricey the cutting edge DL technology is.
conclusion
Technology would perhaps be the major capital cost for a unit that already has the brick and mortar configurationsuchasabuilding,organization,and staff. If DL is an extension of such a university edifice, a second major cost would be the cost of developing courses for online delivery. If such an online institution has a mother institution like the one described above, the costs of developing a course per student can be vastly reduced by means of online delivery of the course to thousands of students over several years.
Besides size-capital cost, or volume-capital cost relationship, that brings about much of the scale economies, there are also cost savings associated with the size of the operations. However, recent studies of Fortune 500 companies using simple ordinary least squares techniques to look into nonlinearities have established that there are no perceptible advantages to large firm size in terms of return on equity, return on assets, or in terms of profit margin. Quality of management,
adopting best practices, and so forth could undercut diseconomies. For an interesting and yet edifying narration of scale-related issues in Fortune 500 companies see Jerry Useem’s work (2007) as well as On-Line Game Services (2006).
There are several other factors that lend a modicum of validity to size-related savings in costs. For instance, environmental costs of oncampus education tilt the overall costs against such education. The Open University, UK study was concerned about greening of higher education by means of reducing environmental impacts such as savings in energy and lower emissions of CO2 arising out of mainly a reduction in commuting. (Roy, Potter, Yarrow, & Smith, 2005) Thus insufficientstudentregistrationforDL can prove to be doubly negative, deleteriously affecting education, and also making it a less sustainable means of higher education for both institutions and students.
While economies of scale are indeed valid and do materialize in DL, the diversity in this regard makes it hard to oversimplify in cost and revenue matters. One hat does not fit all units and qualitative variables such as basic design and environmental considerations, video-based systems, audio-based systems, computer-based systems, integrated-tech systems, educational standardscompliedwith,compensationtoinstructors,coursedevelopmentcosts,infrastructureand technologyandequipmentfixedcosts,labor-inten- sive or capital-intensive modes, and others have to be factored into the modus operandi. There is much uncertainty and only a nuts and bolts evaluation of each DL project would make available information that would enable decision making regarding profitability. Here Table1 would serve as a template to derive ex ante planning data.
futuRe ReseaRch
Inviewoftheconclusionofthischapterthateconomies of scale may not be achieved in the future
Economies of Scale in Distance Learning (DL)
thanks to factors inhibiting enrollments across boundaries, students and researchers should be encouraged to come up with Plan A, such as pragmatic case studies including cost estimates as per Table 1 for different locations, technological infrastructure, courses, and of course nonmega size hypothetical units. A bunch of such studies could then be summarized into a metastudy that couldprovideanswerstoquestionsaboutrealizing economies of scale, minimum efficient size, and viability of DL units. There could be quite a few wild card revelations.
Alternatively, Plan B would be the more arduous task: scout for cost data for existing units all over the USA, or globally, and examine the different technologies used and make them comparable and then sort them out for matching likes with likes, process them, and draw conclusions. Plan A would still trump with better answers.
RefeRences
Carnevale, D. (2006, September 27). Distance education: Keeping up with exploding demand.
The Chronicle of Higher Education. Retrieved February 13, 2008, from www.chronicle.com
Daniel, J.S.(1996).Mega-universities and knowledge media: Technology strategies for higher education. London: Kogan Page.
Daniel, J. S. (2003). Mega-Universities: Mega-
Impact on access cost and quality. Retrieved February 13, 2008, from http://portal.unesco.org/ education/en/ev.php-URL_ID=26277&URL_ DO=DO_TOPIC&URL_SECTION=201.html
Dean, F. A. (2004). Australian universities in the information economy: Electronic commerce and the business of distance education. Unpublished doctoral dissertation, University of Wollongong. Retrieved February 13, 2008, from www-library. uow.edu.au/adt-NWU/public/index.html
Gibson, C. C. (Ed.). (1998). Distance learners
Economies of Scale in Distance Learning (DL)
in higher education: Institutional responses for quality outcomes. Madison, WI: Atwood Publishing.
Golden, D. (2006). Degrees @StateU.edu. Retrieved May 9, 2006, from Wall Street Journal Online. Retrieved from http://online.wsj.com/article/ SB114713782171047386.html?modegooglenews_ wsj
Harrison, N. (1999). How to design self-directed and distance learning programs. McGraw-Hill.
IGNOU. (2007). Retrieved February 13, 2008, from http://www.ignou.ac.in/
Inside Higher Ed -- Daily Update (on-line edition) frequently carries interesting information about DE and data regarding UMass and U of Illinois are compiled from different issues. http://newsroom@insidehighered.com
Ketterer, J. J., & George, E. M., II. (2006, Spring). Re-conceptualizing intimacy and distance in instructional models. Online Journal of Distance Learning Administration, 9(1).
Louisiana Department of Education. (2003)
Small school districts and economies of scale.
Retrieved February 13, 2008, from www.doe. state.la.us/LDE/uploads/3475.pdf
On-Line game services. (2006). Retrieved February 13, 2008, from http://www-306.ibm. com/software/success/cssdb.nsf/CS/MCAG6WNQRG?OpenDocument&Site
Primary Research Group (PRG), Inc. (1997a). Ibid (p. 18). Author.
Primary Research Group(PRG), Inc. (1997b). The survey of distance learning programs in higher education (p. 97). Author.
Primary Research Group (PRG), Inc. (1998). Profiles of college and university distance learning programs. Author.
Roy, R., Potter, S., Yarrow, K., & Smith, M.
(2005, March). Final report on towards sustainable higher education: Environmental impacts of campus-based and distance higher education systems. The Open University, Design Innovation Group.
Rumble, G. (1997). The costs and economics of open and distance learning. London: Kogan Page.
Rumble, G. (2001). The costs and costing of networked learning. Journal of Asynchronous Networks.SloanPublications.RetrievedFebruary13, 2008, from www.sloan-c.org/publications/jaln
Sims, D. (2006). TMC net, teleconferencing and distance learning: An inside look. Retrieved February 13, 2008, from http://www. tmcnet. com/channels
Spellings, M. (2006). Secretary of education while addressing the National Press Club on the commission on higher education in October 2006. Retrieved February 13, 2008, from http://www. ed.gov/news/speeches/2006
Stokes, P. (2006). Consultant for the Illinois State on-lineeducationprojectquotedinInside Higher Education – Daily Update. Retrieved February 13,2008,fromhttp://newsroom@insidehighered. com
UK Open University. (2007). Retrieved February 13, 2008, from http://www.open.ac.uk/about/ou/ p7.shtml
UNESCO.(2007).Descriptionofmegauniversity. Retrieved February 13, 2008, from
ht t p://por t al.u nesco.org /educat ion /en / ev.php-URL_ID=42857&URL_DO=DO_ TOPIC&URL_SECTION=201.html
Useem, J. (2007). Is scale an asset or liability? The case of Fortune 500 companies.
Retrieved February 13, 2008, from http:// money.cnn.com/magazines/fortune/fortune_archive/2007/04/30/8405390/index.htm
Vice-Chancellor, UKOU. (2007). Retrieved
February 13, 2008, from http://www.open.ac.uk/ vice-chancellor/News_3a00_Insights/Insights- 2007-April/Our_founding_fathers_would_ be_proud_of_the_achievements_of_the_OU_ around_the_world.html
Walls, C. M. (2006). Some strategies for balancing economies of scale and interaction in online/distance education courses. Oregon State University. Retrieved February 13, 2008, from drwalls@orst.edu
additional Reading
Bates, A. W. (2005). Technology, e-learning and distanceeducation,studiesindistanceeducation.
Routledge Falmer.
Bates, A. W., & Poole, G. (2003). Effective teaching with technology in higher education: Foundations for success. The Jossey-Bass higher and adult education series.
Bodain, Y., & Robert, J.-M. (2000). Investigating distance learning on the Internet. Retrieved February 13, 2008, from http://www.isoc.org/ inet2000/cdproceedings/6a/6a_4.htm
Claude, G. (Ed). (2003). Usability evaluation of online learning programs. Hershey, PA: Information Science Pub.
Compora, D. P. (2003, Summer). Current trends
Economies of Scale in Distance Learning (DL)
in distance education: An administrative model.
Online Journal of Distance Learning Administration, 6(2).
Duffy, T. M., & Kirkley, J. R. (Eds.). (2004).
Learner-centered theory and practice in distance education: Cases from higher education.
L. Erlbaum.
Jones,R.(2001).Arecommendationformanaging the predicted growth in college enrollment at a time of adverse economic conditions. Retrieved February 13, 2008, from http://www.westga. edu/~distance/ojdla/spring61/jones61.htm
Ko, S., & Rossen, S. (2001). Teaching online: A practical guide. Houghton Mifflin.
Mohammed, R., Fisher, R. J., Jaworski, B. J., & Cahill, A. (2002). Internet marketing (1st ed.). New York: McGraw-Hill.
Moore, M. G., & Anderson, B. (2003). The handbook of distance education. Routledge.
Morgan, B. M. (2000). Determining the costs of onlinecourses.RetrievedFebruary13,2008,from http://www.marshall.edu/distance/
Palloff, R. M., & Pratt, K. (2001). Lessons from the cyberspace classroom: The realities of online teaching. Jossey-Bass.
Valentine, D. (2002, Fall). Distance learning: Promises, problems, and possibilities. Online Journal of Distance Learning Administration, 5(3).
Economies of Scale in Distance Learning (DL)
aPPendix a: RegRession analysis of i.g. national oPen univeRsity cost data in table 4
|
N = 13 |
|
|
|
|
|
|
|
|
|
|
R |
0.4899 |
|
|
|
|
|
|
|
|
|
|
R2 |
0.24 |
|
|
|
|
|
|
|
|
|
|
|
|
|
|
|
|
Adjusted R2 |
0.17 |
|
|
|
|
SE |
2790.8823 |
|
|
|
|
|
|
|
|
|
|
Term |
Coefficient |
SE |
p |
95% CI of Coefficient |
|
|
|
|
|
|
|
Intercept |
4312.4 |
1103.6 |
0.0024 |
1883.42 |
to 6741.4 |
|
|
|
|
|
|
Slope |
-0.0180 |
0.0097 |
0.0910 |
-0.0393 |
to 0.0034 |
|
|
|
|
|
|
Source of variation |
SSq |
DF |
MSq |
F |
P |
|
|
|
|
|
|
Due to regression |
26,723,727.2 |
1 |
26,723,727.2 |
3.43 |
0.0910 |
|
|
|
|
|
|
About regression |
85,679,263.4 |
11 |
7,789,023.9 |
|
|
|
|
|
|
|
|
Total |
112,402,990.6 |
12 |
|
|
|
|
|
|
|
|
|
Economies of scale based on IGNOU data *Note. The curve with rings is the Average Cost Curve and has an L shape. The thick middle line is the forecast regression line.
|
000 |
y = -0.0 x + . |
|
|
|
|
0000 |
|
|
|
|
costs |
000 |
|
|
|
|
|
|
|
|
|
|
average |
0 |
|
|
|
|
|
|
|
|
|
|
|
- 000 |
|
|
|
|
|
- 0000 |
|
|
|
|
|
|
0 |
00000 |
00000 |
00000 |
# students