

Agricultural commodity markets
.pdfvk.com/id446425943
THE STATE OF AGRICULTURAL COMMODITY MARKETS 2018
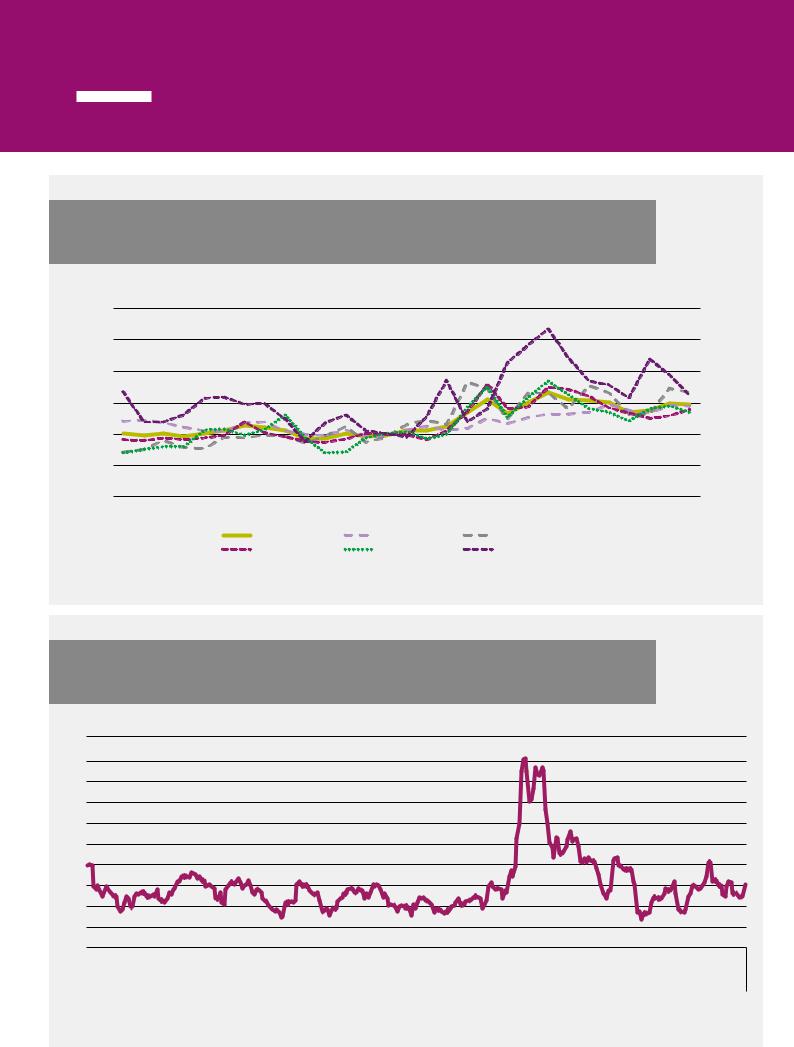
FIGURE 1.1
WORLD MERCHANDISE TRADE VALUE AND WORLD GDP: ANNUAL GROWTH RATES, 2000–2016
MERCHANDISE TRADE VALUE GROWTH RATE, %
40 |
|
|
|
|
|
|
|
|
|
|
|
|
|
|
|
|
|
|
|
|
|
|
|
|
|
|
|
|
|
|
|
|
|
|
|
|
|
|
|
5 |
|
|
|
|
|
|
|
|
|
|
|
|
|
|
|
|
|
|
|
|
|
|
|
|
|
|
|
|
|
|
|
|
|
|
|
|
|
|
|
||
30 |
|
|
|
|
|
|
|
|
|
|
|
|
|
|
|
|
|
|
|
|
|
|
|
|
|
|
|
|
|
|
|
|
|
|
|
|
|
|
|
|
|
|
|
|
|
|
|
|
|
|
|
|
|
|
|
|
|
|
|
|
|
|
|
|
|
|
|
|
|
|
|
|
|
|
|
|
4 |
||||
|
|
|
|
|
|
|
|
|
|
|
|
|
|
|
|
|
|
|
|
|
|
|
|
|
|
|
|
|
|
|
|
|
|
|
|
|
||||
20 |
|
|
|
|
|
|
|
|
|
|
|
|
|
|
|
|
|
|
|
|
|
|
|
|
|
|
|
|
|
|
|
|
|
|
|
|
|
|
|
|
|
|
|
|
|
|
|
|
|
|
|
|
|
|
|
|
|
|
|
|
|
|
|
|
|
|
|
|
|
|
|
|
|
|
|
|
3 |
||||
10 |
|
|
|
|
|
|
|
|
|
|
|
|
|
|
|
|
|
|
|
|
|
|
|
|
|
|
|
|
|
|
|
|
|
|
|
|
||||
|
|
|
|
|
|
|
|
|
|
|
|
|
|
|
|
|
|
|
|
|
|
|
|
|
|
|
|
|
|
|
|
|
|
|
|
|
|
|
|
|
|
|
|
|
|
|
|
|
|
|
|
|
|
|
|
|
|
|
|
|
|
|
|
|
|
|
|
|
|
|
|
|
|
|
|
|
2 |
||||
0 |
|
|
|
|
|
|
|
|
|
|
|
|
|
|
|
|
|
|
|
|
|
|
|
|
|
|
|
|
|
|
|
|
|
|
|
|
||||
|
|
|
|
|
|
|
|
|
|
|
|
|
|
|
|
|
|
|
|
|
|
|
|
|
|
|
|
|
|
|
|
|
|
|
|
|
|
|
|
|
-10 |
|
|
|
|
|
|
|
|
|
|
|
|
|
|
|
|
|
|
|
|
|
|
|
|
|
|
|
|
|
|
|
|
|
|
|
|
|
|
|
1 |
|
|
|
|
|
|
|
|
|
|
|
|
|
|
|
|
|
|
|
|
|
|
|
|
|
|
|
|
|
|
|
|
|
|
|
|
|
|
|||
-20 |
|
|
|
|
|
|
|
|
|
|
|
|
|
|
|
|
|
|
|
|
|
|
|
|
|
|
|
|
|
|
|
|
|
|
|
|
|
|
|
|
|
|
|
|
|
|
|
|
|
|
|
|
|
|
|
|
|
|
|
|
|
|
|
|
|
|
|
|
|
|
|
|
|
|
|
|
0 |
||||
|
|
|
|
|
|
|
|
|
|
|
|
|
|
|
|
|
|
|
|
|
|
|
|
|
|
|
|
|
|
|
|
|
|
|
|
|
||||
-30 |
|
|
|
|
|
|
|
|
|
|
|
|
|
|
|
|
|
|
|
|
|
|
|
|
|
|
|
|
|
|
|
|
|
|
|
|
|
|
|
|
|
|
|
|
|
|
|
|
|
|
|
|
|
|
|
|
|
|
|
|
|
|
|
|
|
|
|
|
|
|
|
|
|
|
|
|
-1 |
||||
-40 |
|
|
|
|
|
|
|
|
|
|
|
|
|
|
|
|
|
|
|
|
|
|
|
|
|
|
|
|
|
|
|
|
|
|
|
|
||||
|
|
|
|
|
|
|
|
|
|
|
|
|
|
|
|
|
|
|
|
|
|
|
|
|
|
|
|
|
|
|
|
|
|
|
|
|
|
|
|
|
|
|
|
|
|
|
|
|
|
|
|
|
|
|
|
|
|
|
|
|
|
|
|
|
|
|
|
|
|
|
|
|
|
|
|
|
-2 |
||||
-50 |
|
|
|
|
|
|
|
|
|
|
|
|
|
|
|
|
|
|
|
|
|
|
|
|
|
|
|
|
|
|
|
|
|
|
|
|
||||
|
|
|
|
|
|
|
|
|
|
|
|
|
|
|
|
|
|
|
|
|
|
|
|
|
|
|
|
|
|
|
|
|
|
|
|
|
|
|
|
|
-60 |
|
|
|
|
|
|
|
|
|
|
|
|
|
|
|
|
|
|
|
|
|
|
|
|
|
|
|
|
|
|
|
|
|
|
|
|
|
|
|
-3 |
2001 |
2002 |
2003 |
2004 |
2005 |
2006 |
2007 |
2008 |
2009 |
|
2010 |
2011 |
2012 |
2013 |
2014 |
2015 |
2016 |
|
|||||||||||||||||||||||
GDP GROWTH RATE, %
|
Agriculture |
|
Fuel and mining products |
|
Manufacturing products |
|
GDP Growth |
SOURCE: FAO calculations using WTO Statistics and World Development Indicators, (World Bank). Agricultural trade comprises products covered by the Agreement on Agriculture, Annex 1, that is, it includes food and agricultural raw materials and excludes fish and forestry.
trade and commodity prices significantly. The unprecedented growth in demand for agricultural products over the last decade was fuelled by growth in China and increases in biofuel production worldwide. The recent slowdown in Chinese income and demand growth, and the decline in the propensity of households to spend additional income on food, in turn, led to a decline in global agricultural trade by 11 percent in 2015, although this rebounded to show a
1 percent increase in 2016.
Prices reflect the fundamental forces of supply and demand and shape global trade. Since 2000,
increasing prices of agricultural commodities, as well as the 2008 and 2011 price surges, were the result of structural changes in global agricultural markets (Figure 1.2). Strong demand for food and feed, declining stock-to-use ratios and expanding production in biofuels combined to give rise to market shocks and price volatility. Since then, agricultural prices have declined, although they are still higher than in 2007. In 2015 and 2016, world prices also reflected the appreciation of the US dollar. Markets are also calmer and price volatility has declined significantly compared with the violent price episodes of 2008–11 (Figure 1.3). »
| 3 |
vk.com/id446425943
PART 1 AGRICULTURAL TRADE: KEY DYNAMICS AND TRENDS
FIGURE 1.2
AGRICULTURAL PRICE INDICES, 1990–2018 (2002–2004=100)
300
250
200
150
100
50
0
1990 |
1991 |
1992 |
1993 |
1994 |
1995 |
1996 |
1997 |
1998 |
1999 |
2000 |
2001 |
2002 |
2003 |
2004 |
2005 |
2006 |
2007 |
2008 |
2009 |
2010 |
2011 |
2012 |
2013 |
2014 |
2015 |
2016 |
2017 |
2018 |
|
|
|
|
|
|
|
Food Price Index |
|
|
|
Meat Price Index |
|
|
|
Dairy Price Index |
|
|
|
|
|
|
|
||||||
|
|
|
|
|
|
|
Cereals Price Index |
|
|
Oils Price Index |
|
|
|
Sugar Price Index |
|
|
|
|
|
|
|
|||||||
SOURCE: FAO Food Price Index, World Food Situation (http://www.fao.org/worldfoodsituation/foodpricesindex/en/)
FIGURE 1.3
FOOD PRICE INDEX VOLATILITY, JANUARY 1991–DECEMBER 2017 (PERCENT)
PERCENT
10
9
8
7
6
5
4
3
2
1
0
1/1991 5/1991 9/1991 1/1992 5/1992 9/1992 1/1993 5/1993 9/1993 1/1994 5/1994 9/1994 1/1995 5/1995 9/1995 1/1996 5/1996 9/1996 1/1997 5/1997 9/1997 1/1998 5/1998 9/1998 1/1999 5/1999 9/1999 1/2000 5/2000 9/2000 1/2001 5/2001 9/2001 1/2002 5/2002 9/2002 1/2003 5/2003 9/2003 1/2004 5/2004 9/2004 1/2005 5/2005 9/2005 1/2006 5/2006 9/2006 1/2007 5/2007 9/2007 1/2008 5/2008 9/2008 1/2009 5/2009 9/2009 1/2010 5/2010 9/2010 1/2011 5/2011 9/2011 1/2012 5/2012 9/2012 1/2013 5/2013 9/2013 1/2014 5/2014 9/2014 1/2015 5/2015 9/2015 1/2016 5/2016 9/2016 1/2017 |
5/2017 |
9/2017 |
|||||||||||||||||||||||||||||||||||||||||||||||||||
|
1992 |
|
1993 |
|
1994 |
|
1995 |
|
1996 |
|
1997 |
|
1998 |
|
1999 |
|
2000 |
|
2001 |
|
2002 |
|
2003 |
|
2004 |
|
2005 |
|
2006 |
|
2007 |
|
2008 |
|
2009 |
|
2010 |
|
2011 |
|
2012 |
|
2013 |
|
2014 |
|
2015 |
|
2016 |
|
2017 |
||
|
1991 |
|
|
|
|
|
|
|
|
|
|
|
|
|
|
|
|
|
|
|
|
|
|
|
|
|
|||||||||||||||||||||||||||
SOURCE: FAO, monthly food price indices (2002−2004=100), computed every 12 months
| 4 |

vk.com/id446425943
THE STATE OF AGRICULTURAL COMMODITY MARKETS 2018
TABLE 1.1
MAJOR IMPORTERS OF AGRICULTURAL PRODUCTS: SHARE OF TOTAL IMPORT VALUE, 2016 AND 2000
|
2016 |
|
|
|
2000 |
|
|
Rank |
Share |
|
Rank |
Share |
|
European Union |
1 |
39.1 |
European Union |
1 |
45.3 |
|
(Member Organization) |
(Member Organization) |
|||||
|
|
|
|
|||
|
|
|
|
|
|
|
United States of America |
2 |
10.1 |
United States of America |
2 |
10.1 |
|
|
|
|
|
|
|
|
China |
3 |
8.2 |
Japan |
3 |
8.7 |
|
|
|
|
|
|
|
|
Japan |
4 |
4.2 |
Canada |
4 |
2.8 |
|
|
|
|
|
|
|
|
Canada |
5 |
2.7 |
Mexico |
5 |
2.3 |
|
|
|
|
|
|
|
|
Mexico |
6 |
2 |
China |
6 |
2.3 |
|
|
|
|
|
|
|
|
China, Hong Kong SAR |
7 |
1.9 |
China, Hong Kong SAR |
7 |
2 |
|
|
|
|
|
|
|
|
India |
8 |
1.9 |
Republic of Korea |
8 |
2 |
|
|
|
|
|
|
|
|
Republic of Korea |
9 |
1.9 |
Russian Federation |
9 |
1.7 |
|
|
|
|
|
|
|
|
Russian Federation |
10 |
1.9 |
Saudi Arabia |
10 |
1.2 |
|
|
|
|
|
|
|
|
Indonesia |
11 |
1.4 |
Switzerland |
11 |
1.2 |
|
|
|
|
|
|
|
|
Viet Nam |
12 |
1.3 |
Indonesia |
12 |
1 |
|
|
|
|
|
|
|
|
United Arab Emirates |
13 |
1.2 |
Brazil |
13 |
0.9 |
|
|
|
|
|
|
|
|
Malaysia |
14 |
1.1 |
Malaysia |
14 |
0.8 |
|
|
|
|
|
|
|
|
Australia |
15 |
1 |
Egypt |
15 |
0.8 |
|
|
|
|
|
|
|
|
Turkey |
16 |
1 |
Turkey |
16 |
0.8 |
|
|
|
|
|
|
|
|
Switzerland |
17 |
0.9 |
India |
17 |
0.7 |
|
|
|
|
|
|
|
|
Singapore |
18 |
0.9 |
Thailand |
18 |
0.7 |
|
|
|
|
|
|
|
|
Thailand |
19 |
0.9 |
Philippines |
19 |
0.6 |
|
|
|
|
|
|
|
|
Saudi Arabia |
20 |
0.9 |
Algeria |
20 |
0.6 |
|
|
|
|
|
|
|
|
Total |
|
84.5 |
Total |
|
86.5 |
|
|
|
|
|
|
|
SOURCE: FAO calculations using data from World Integrated Trade Solution (accessed February 2018). Agricultural trade comprises products covered by the Agreement on Agriculture, Annex 1.
»The increasing importance of emerging economies has been a major development in global agricultural markets since 2000. China’s share of world imports increased from 2.3 percent in 2000 to 8.2 percent in 2016, placing it third in the ranking of the top twenty importers after the United States of America and the European Union (Member Organization) (Table 1.1). Between 2000 and 2016, other emerging economies, such as India, Indonesia, and the Russian Federation increased their aggregate share in global imports from 3.4 percent to 5.2 percent. Developed economies such as the European Union (Member Organization) and Japan experienced a decline in their share of total global import value, although they remained high up the ranking of the top twenty importers.
Changes in export patterns clearly underline the increasing importance of emerging economies in global agricultural markets (Table 1.2). Although traditional exporters such as the European Union (Member Organization) and the United States of America remain at the top of the ranking in terms of the share of total export value, Brazil increased its share from 3.2 percent in 2000 to 5.7 percent in 2016. China became the fourth most important exporter, increasing its share of total export value from 3.0 percent in 2000 to 4.2 percent in 2016.
Together with Brazil and China the emerging economies of India and Indonesia have increased their agricultural exports substantially. In 2016, these four countries accounted for 14.5 percent of global export value compared with 8.5 percent in 2000.
| 5 |

vk.com/id446425943
PART 1 AGRICULTURAL TRADE: KEY DYNAMICS AND TRENDS
TABLE 1.2
MAJOR EXPORTERS OF AGRICULTURAL PRODUCTS: SHARE OF TOTAL EXPORT VALUE, 2016 AND 2000
|
2016 |
|
|
|
2000 |
|
|
Rank |
Share |
|
Rank |
Share |
|
European Union |
1 |
41.1 |
European Union |
1 |
46.9 |
|
(Member Organization) |
(Member Organization) |
|||||
|
|
|
|
|||
|
|
|
|
|
|
|
United States of America |
2 |
11 |
United States of America |
2 |
14 |
|
|
|
|
|
|
|
|
Brazil |
3 |
5.7 |
Canada |
3 |
3.9 |
|
|
|
|
|
|
|
|
China |
4 |
4.2 |
Australia |
4 |
3.7 |
|
|
|
|
|
|
|
|
Canada |
5 |
3.4 |
Brazil |
5 |
3.2 |
|
|
|
|
|
|
|
|
Argentina |
6 |
2.8 |
China |
6 |
3.0 |
|
|
|
|
|
|
|
|
Australia |
7 |
2.5 |
Argentina |
7 |
2.7 |
|
|
|
|
|
|
|
|
Indonesia |
8 |
2.4 |
Mexico |
8 |
1.9 |
|
|
|
|
|
|
|
|
Mexico |
9 |
2.3 |
New Zealand |
9 |
1.6 |
|
|
|
|
|
|
|
|
India |
10 |
2.2 |
Thailand |
10 |
1.5 |
|
|
|
|
|
|
|
|
Thailand |
11 |
2.0 |
Malaysia |
11 |
1.4 |
|
|
|
|
|
|
|
|
Malaysia |
12 |
1.8 |
India |
12 |
1.2 |
|
|
|
|
|
|
|
|
New Zealand |
13 |
1.6 |
Indonesia |
13 |
1.1 |
|
|
|
|
|
|
|
|
Viet Nam |
14 |
1.3 |
Turkey |
14 |
0.9 |
|
|
|
|
|
|
|
|
Turkey |
15 |
1.3 |
Colombia |
15 |
0.7 |
|
|
|
|
|
|
|
|
Russian Federation |
16 |
1.1 |
Chile |
16 |
0.7 |
|
|
|
|
|
|
|
|
Chile |
17 |
0.9 |
Singapore |
17 |
0.7 |
|
|
|
|
|
|
|
|
Singapore |
18 |
0.8 |
Viet Nam |
18 |
0.6 |
|
|
|
|
|
|
|
|
Switzerland |
19 |
0.7 |
South Africa |
19 |
0.6 |
|
|
|
|
|
|
|
|
South Africa |
20 |
0.7 |
Switzerland |
20 |
0.6 |
|
|
|
|
|
|
|
|
Total |
|
89.8 |
Total |
|
90.9 |
|
|
|
|
|
|
|
SOURCE: FAO’s calculations using data from World Integrated Trade Solution (accessed February 2018). Agricultural trade comprises products covered by the Agreement on Agriculture, Annex 1.
During the same period, the combined share in total export value of the United States of America, the European Union (Member Organization), Australia and Canada – all traditional exporters – declined by ten percentage points from 68.5 percent in 2000 to 58.0 percent in 2016.
The increased participation of emerging economies in global agricultural trade reflects the pace of structural change along the development path. During the last two decades, rapid economic growth and increases in per capita income in these economies fuelled the demand for agricultural products and, in conjunction with their large populations, led to significant increases in imports.
For example in India, GDP per capita increased from USD 770 in 2000 to USD 1 751 in 2015 (measured in 2010 prices). Between 2004 and 2011, the poverty headcount ratio – the proportion of the population living on less than USD 1.90 a day – declined from 38.2 percent to 21.2 percent. Such income increases paired with poverty reduction boosted the demand for food and resulted in increased agricultural imports. Between 2000 and 2015, GDP per capita in China increased from USD 1 771 to USD 6 498 (measured in 2010 prices), while a significant number of people were lifted out of poverty – the poverty headcount ratio declined from
31.9 percent in 2002 to 1.8 percent in 2013. These emerging economies will remain significant
| 6 |
vk.com/id446425943
THE STATE OF AGRICULTURAL COMMODITY MARKETS 2018
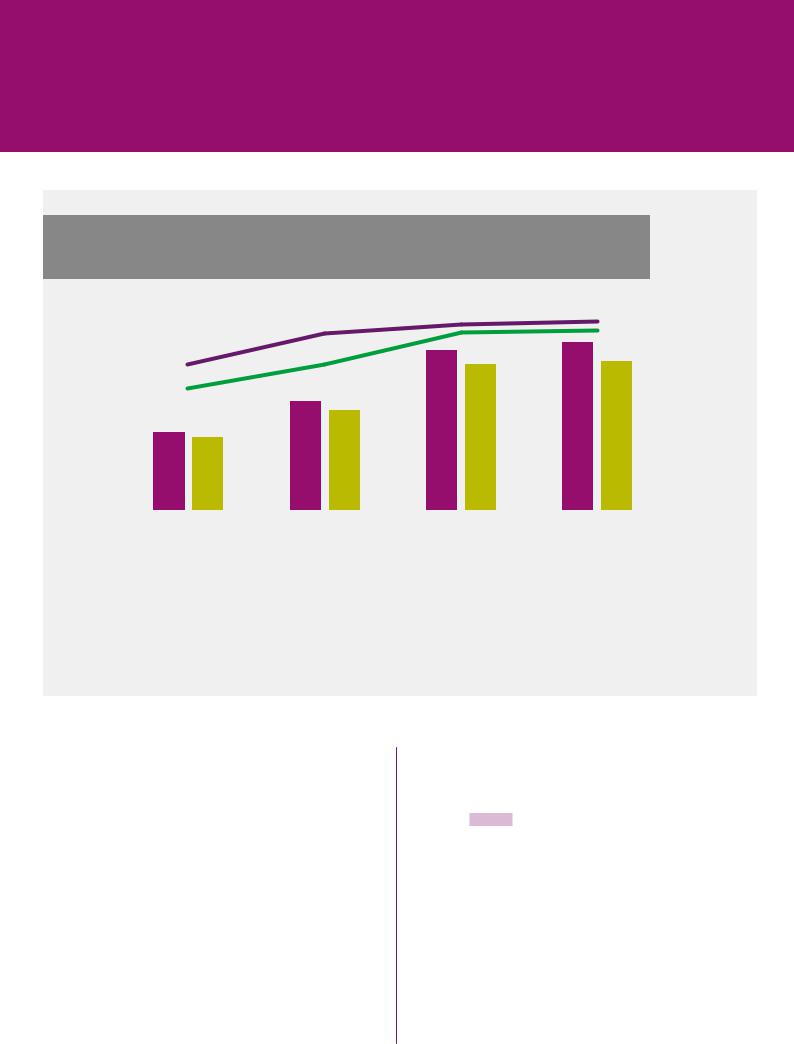
FIGURE 1.4
EVOLUTION OF SOUTH–SOUTH AGRICULTURAL TRADE, 2000–2015
PERCENTAGE OF GLOBAL TRADE VALUE
25 |
|
|
|
|
60 |
|
|
|
|
||
20 |
|
|
|
50 |
|
|
|
|
|
|
|
|
|
|
40 |
||
|
|
|
|
||
15 |
|
|
|
|
|
|
|
|
30 |
||
|
|
|
|
||
10 |
|
|
|
|
|
|
|
|
20 |
||
|
|
|
|
||
5 |
|
|
|
|
|
|
|
|
10 |
||
|
|
|
|
||
0 |
|
|
|
|
0 |
|
|
|
|
||
2000 |
2005 |
2010 |
2015 |
|
|
|
Lowand middle-income countries' exports (percent of global value) |
|
South−South exports (percent of lowand middle-income countries’ total trade) |
|
|
Lowand middle-income countries' imports (percent of global value) |
|
|
South−South imports (percent of lowand middle-income countries’ total trade) |
PERCENTAGE OF LOWAND MIDDLE-INCOME COUNTRIES' TOTAL TRADE
SOURCE: FAO calculations using data from World Integrated Trade Solution (accessed February 2018). South countries comprise the World Bank country groups of middleand low-income countries and non-WTO countries. Agricultural trade comprises products covered by the Agreement on Agriculture, Annex 1.
importers of agricultural products, although their imports are likely to grow at a slower pace, as the propensity to spend additional income on food diminishes with higher per capita income.
At the same time, agricultural productivity growth in emerging economies fuelled production and exports. In Brazil, agricultural value added per worker more than doubled between 2000 and 2015
– from USD 4 578 to USD 11 149 (measured in 2010 prices) – with the country’s global export value share also rising. Increases in productivity in the agricultural sectors of China, India and Indonesia also boosted production and exports, further increasing the participation of these countries in global agricultural trade.
Exports from middleand low-income countries increased from 9.4 percent of global agricultural
trade value in 2000 to 20.1 percent in 2015. Imports followed a similar trend – large emerging economies, in particular Brazil, China, India and Indonesia, have been the main engines of this growth (Figure 1.4).
A key feature of the increased participation of middleand low-income countries in global agricultural markets has been the rapid growth of South–South trade — that is, trade in agricultural products within the middleand low-income countries group. The share of imports by middleand low-income countries sourced from other middleand low-income countries increased from 41.9 percent in 2000 to 54.4 percent in 2015. During the same period, exports followed a similar trend. By 2015, about half of the exports of middleand low-income countries were destined for other ‘South’ countries.
| 7 |
vk.com/id446425943
PART 1 AGRICULTURAL TRADE: KEY DYNAMICS AND TRENDS
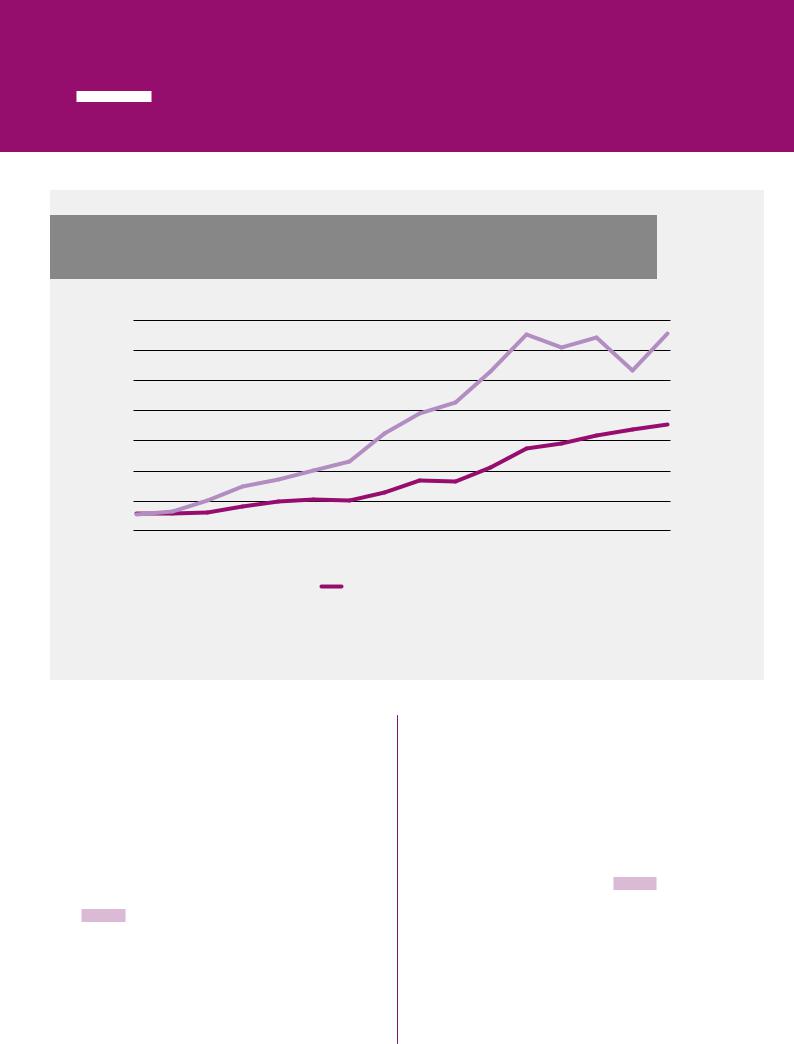
FIGURE 1.5
LEAST DEVELOPED COUNTRIES: AGRICULTURAL TRADE (USD BILLION), 2000–2015
BILLIONS USD
35
30
25
20
15
10
5
0
2000 |
2001 |
2002 |
2003 |
2004 |
2005 |
2006 |
2007 |
2008 |
2009 |
2010 |
2011 |
2012 |
2013 |
2014 |
2015 |
Export |
|
Import |
|
SOURCE: FAO calculations using data from World Integrated Trade Solution (accessed February 2018). Data have been aggregated in line with the list of Least Developed Countries as identified by the United Nations Committee for Development Policy, Development Policy and Analysis Division, Department of Economic and Social Affairs. Agricultural trade comprises products covered by the Agreement on Agriculture, Annex 1.
Within this group, Least Developed Countries (LDCs) face significant challenges. Agriculture is central to LDCs, accounting for between 30 and 60 percent of GDP, providing employment for more people than any other economic sector and underpinning their food security, export earnings and development.
The agricultural imports of LDCs saw a huge increase from about USD 2.5 billion in 2000 to about USD 32.8 billion in 2015, accounting for 2.5 percent of global agricultural import value (Figure 1.5). Exports exhibited a weaker trend, amounting to just 1.4 percent of global export value and widening the LDCs’ trade deficit in agricultural products to about USD 15 billion in 2015. LDCs export mostly unprocessed and predominantly primary agricultural commodities, including coffee, tea, cotton, jute, spices and bananas.
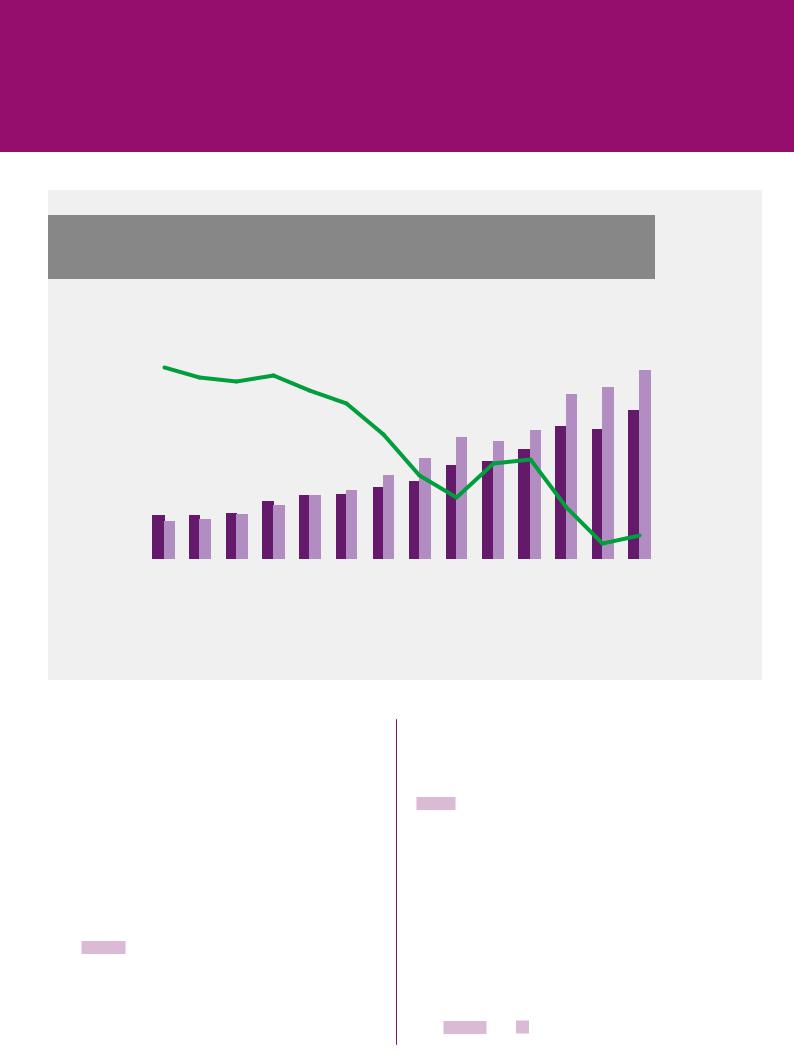
Income grew by roughly 3.4 percent per annum for the LDC group as a whole. However, it was primarily population growth, averaging
2.4 percent per annum, that strengthened the demand for food and boosted imports. In fact, sluggish agricultural productivity that could not keep pace with population growth is the reason why, over the years, most LDCs have changed from being net agricultural exporters to net agricultural importers. This is particularly evident for sub-Saharan Africa (Figure 1.6). LDCs continue to experience limited gains in productivity and competitiveness. Poor infrastructure, lack of productive technologies, lack of access to inputs and weak institutions combine to hinder productivity growth. Productivity levels are significantly below what could be achieved by using the best practices and technology available. Since 2000, agricultural productivity growth has been weak. In LDCs as a whole, value added per worker in
| 8 |
vk.com/id446425943
THE STATE OF AGRICULTURAL COMMODITY MARKETS 2018
FIGURE 1.6
SUB-SAHARAN AFRICA: NET AGRICULTURAL TRADE (USD BILLION), 2000–2013
VALUE OF EXPORTS AND IMPORTS
60 |
|
|
|
|
|
|
|
|
|
|
|
|
|
|
|
|
|
|
|
|
|
|
|
|
|
|
|
|
|
|
|
|
|
4 |
|||
|
|
|
|
|
|
|
|
|
|
|
|
|
|
|
|
|
|
|
|
|
|
|
|
|
|
|
|
|
|
|
|
|
|||||
50 |
|
|
|
|
|
|
|
|
|
|
|
|
|
|
|
|
|
|
|
|
|
|
|
|
|
|
|
|
|
|
|
|
2 |
||||
|
|
|
|
|
|
|
|
|
|
|
|
|
|
|
|
|
|
|
|
|
|
|
|
|
|
|
|
|
|
|
|
|
|
|
|
|
|
|
|
|
|
|
|
|
|
|
|
|
|
|
|
|
|
|
|
|
|
|
|
|
|
|
|
|
|
|
|
|
|
0 |
|||||
|
|
|
|
|
|
|
|
|
|
|
|
|
|
|
|
|
|
|
|
|
|
|
|
|
|
|
|
|
|
|
|
|
|||||
40 |
|
|
|
|
|
|
|
|
|
|
|
|
|
|
|
|
|
|
|
|
|
|
|
|
|
|
|
|
|
|
|
|
|
|
|
|
|
|
|
|
|
|
|
|
|
|
|
|
|
|
|
|
|
|
|
|
|
|
|
|
|
|
|
|
|
|
|
|
|
-2 |
|||||
|
|
|
|
|
|
|
|
|
|
|
|
|
|
|
|
|
|
|
|
|
|
|
|
|
|
|
|
|
|
|
|
|
|||||
30 |
|
|
|
|
|
|
|
|
|
|
|
|
|
|
|
|
|
|
|
|
|
|
|
|
|
|
|
|
|
|
|
|
|
|
|
-4 |
|
|
|
|
|
|
|
|
|
|
|
|
|
|
|
|
|
|
|
|
|
|
|
|
|
|
|
|
|
|
|
|
|
|
|
||||
20 |
|
|
|
|
|
|
|
|
|
|
|
|
|
|
|
|
|
|
|
|
|
|
|
|
|
|
|
|
|
|
|
|
-6 |
||||
|
|
|
|
|
|
|
|
|
|
|
|
|
|
|
|
|
|
|
|
|
|
|
|
|
|
|
|
|
|
|
|
|
|
|
|
|
|
|
|
|
|
|
|
|
|
|
|
|
|
|
|
|
|
|
|
|
|
|
|
|
|
|
|
|
|
|
|
|
|
-8 |
|||||
|
|
|
|
|
|
|
|
|
|
|
|
|
|
|
|
|
|
|
|
|
|
|
|
|
|
|
|
|
|
|
|
|
|||||
10 |
|
|
|
|
|
|
|
|
|
|
|
|
|
|
|
|
|
|
|
|
|
|
|
|
|
|
|
|
|
|
|
|
|
|
|
|
|
|
|
|
|
|
|
|
|
|
|
|
|
|
|
|
|
|
|
|
|
|
|
|
|
|
|
|
|
|
|
|
|
-10 |
|||||
|
|
|
|
|
|
|
|
|
|
|
|
|
|
|
|
|
|
|
|
|
|
|
|
|
|
|
|
|
|
|
|
|
|||||
0 |
|
|
|
|
|
|
|
|
|
|
|
|
|
|
|
|
|
|
|
|
|
|
|
|
|
|
|
|
|
|
|
|
|
-12 |
|||
|
|
|
|
|
|
|
|
|
|
|
|
|
|
|
|
|
|
|
|
|
|
|
|
|
|
|
|
|
|
|
|
|
|||||
2000 |
2001 |
2002 |
2003 |
2004 |
2005 |
2006 |
2007 |
2008 |
2009 |
2010 |
2011 |
2012 |
2013 |
|
|
||||||||||||||||||||||
VALUE OF NET TRADE
|
Export |
|
Import |
|
Net |
SOURCE: FAO calculations using FAOSTAT data on crop and livestock products trade.
agriculture increased by 2.0 percent a year, from USD 490 in 2000 to USD 657 in 2015. n
AGRICULTURAL POLICY TRENDS
The expansion of agricultural trade since 2000 was also facilitated by improvements in market access as a result of the 1995 WTO AoA. Average applied tariff levels declined as countries met their commitments under the Agreement, but also as a result of bilateral and regional trade agreements and unilateral policy changes
(Figure 1.7). Nevertheless, this average hides considerable variation in border protection on individual products across countries. A number of countries have maintained substantially high import barriers for products such as dairy, rice and sugar, which have historically been highly protected.3
Trade-distorting domestic support in major developed countries has fallen since 2000 with the implementation of the AoA, which limits expenditure on such measures through the Total Aggregate Measurement of Support (see Table 3.1). Support that distorts trade, such as market price support or payments coupled with output and input subsidies, declined particularly in the European Union (Member Organization), where around 68 percent of its support consisted of minimally or
non-distorting decoupled payments in 2014, compared with around 35 percent in 2000.4
In some developed economies, such as those within the European Union (Member Organization), the reduction of trade-distorting support was accompanied by an increase in expenditure on so-called ‘Green Box’ measures (see Tables 3.1 and 4.1), such as direct payments to farmers that are decoupled from production. »
| 9 |
vk.com/id446425943
PART 1 AGRICULTURAL TRADE: KEY DYNAMICS AND TRENDS
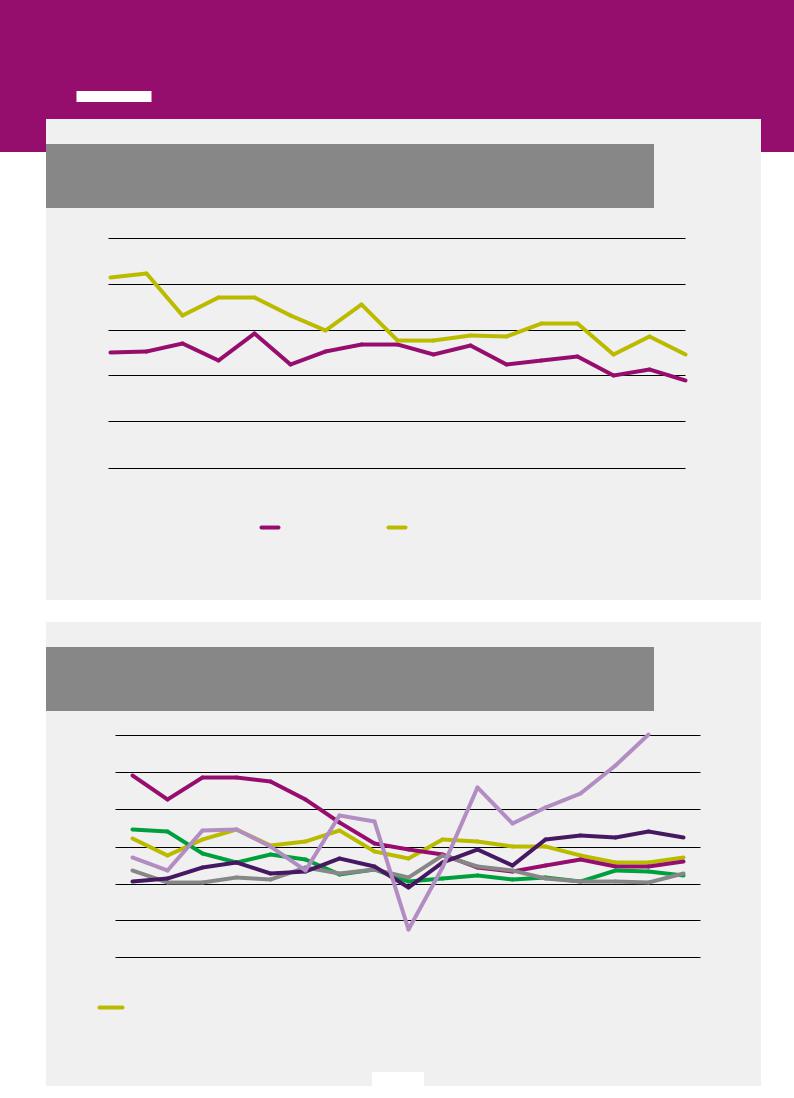
FIGURE 1.7
AVERAGE AGRICULTURAL APPLIED TARIFF RATES, WEIGHTED AVERAGE (PERCENT), 2000–2016
25
20
15
10
5
0
2000 2001 2002 2003 2004 2005 2006 2007 2008 2009 2010 2011 2012 2013 2014 2015 2016
High-income countries Lowand middle-income countries
SOURCE: FAO calculations using data from World Integrated Trade Solution (accessed February 2018). Definitions of high-income, and middleand low-income countries follow the classification of the World Bank.
FIGURE 1.8
PRODUCER NOMINAL PROTECTION COEFFICIENT, 2000–2016
1.4
1.3
1.2
1.1
1
0.9
0.8
2000 |
2001 |
2002 |
2003 |
2004 |
2005 |
2006 |
2007 |
2008 |
2009 |
2010 |
2011 |
2012 |
2013 |
2014 |
2015 |
2016 |
|
Canada |
|
|
European Union |
(Member Organization) |
|
United States of America |
|
Brazil |
|
China |
|
Indonesia |
|||||
|
|
|
|
|
|
||||||||||||
NOTE: Producer Nominal Protection Coefficient is the ratio between the average price received by producers (at farm gate), including payments per tonne of current output, and the border price (measured at farm gate).
SOURCE: OECD.
| 10 |

vk.com/id446425943
THE STATE OF AGRICULTURAL COMMODITY MARKETS 2018
»During the same period, in some emerging and developing economies higher levels of development, increasing income per capita and the need to stimulate production, have led to increased support to farmers, in some cases through trade-distorting measures, such as market price support. Figure 1.8 shows the trend in the Producer Nominal Protection Coefficient for selected countries, reflecting the effect of border measures, as well as payments coupled to production on the domestic producer price level.
In addition, there were significant reductions in the use of export subsidies by developed countries under the AoA, facilitated by the higher level of agricultural commodity prices between 2000 and 2008. The implementation of the agreement at the December 2015 Nairobi WTO Ministerial Conference to eliminate export subsidies on agricultural products will contribute to a more level playing field in trade for both emerging economies and developing countries. n
| 11 |

vk.com/id446425943
TERA, BAJIRGA, NIGER
Women in the field preparing for the next rainy season by digging mid-moon dams to save water, part of an FAO, European Development Fund, and African, Caribbean and Pacific Group of States (ACP) project to promote sustainable land management and restore drylands and degraded soils. ©FAO/Giulio Napolitano