

Agricultural commodity markets
.pdfvk.com/id446425943
THE STATE OF AGRICULTURAL COMMODITY MARKETS 2018
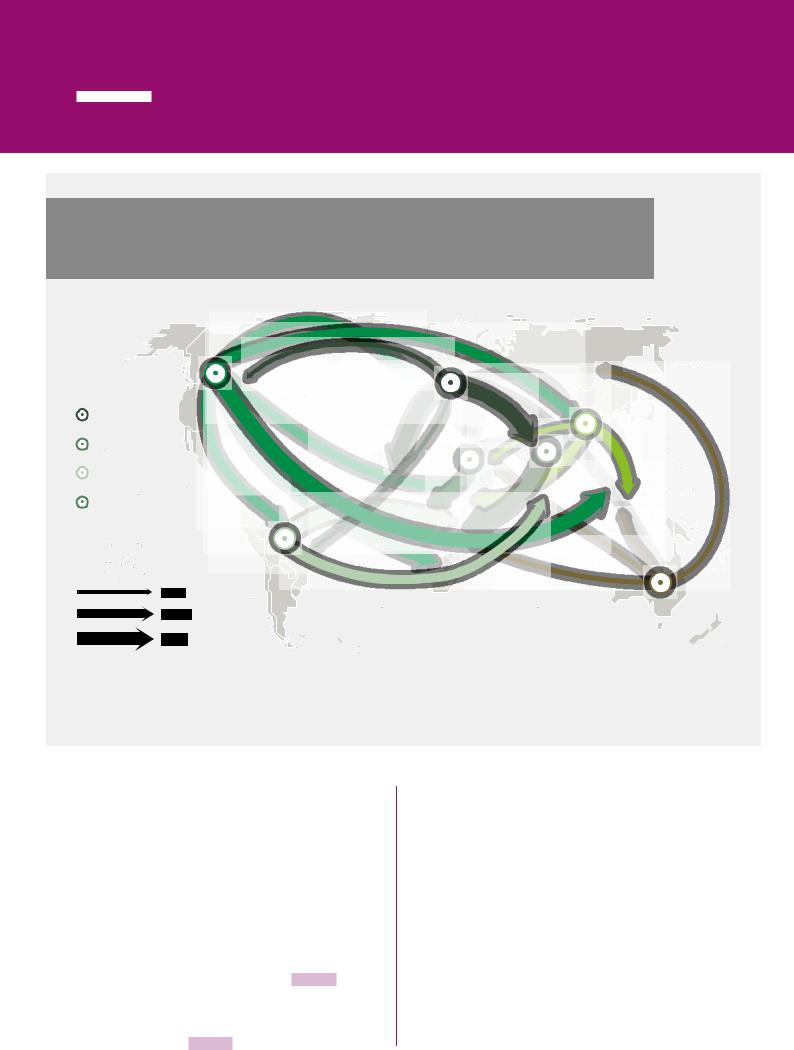
FIGURE 2.3
CHANGES IN AGRICULTURAL NET TRADE IN 2050: CLIMATE CHANGE SCENARIO
RELATIVE TO THE BASELINE (IN BILLION USD, 2011 CONSTANT PRICES)
|
|
|
|
|
|
|
|
|
|
|
|
|
|
|
|
|
|
|
|
|
|
|
|
|
|
|
|
|
|
|
|
|
|
|
|
Rest of |
|
|
|
|
|
|
|
|
|
|
|
|
|
|
|
|
|
|
|
|
|
|
|
|
|
|
|
|
|
|
|
|||||||||||
|
|
|
|
|
|
|
|
|
|
|
|
|
|
|
|
|
|
|
|
|
|
|
|
|
|
|
|
|
|
|
|
|
|
|
|
|
|
|
|
|
|
|
|
|
|
|
|
Russian Federation |
|
|
|
|
|
|
|
|
||||||||||||||||||||||
|
|
|
|
|
|
|
|
|
|
|
|
|
|
|
|
|
|
|
|
|
|
|
|
|
|
|
|
|
|
|
|
|
|
|
|
|
|
|
|
|
|
|
|
|
|
|
|
|
|
|
|
|
|
|
|
|||||||||||||||||||||||
|
|
|
|
|
|
|
|
|
|
|
|
|
|
|
|
|
|
|
|
|
|
|
|
|
|
|
|
|
|
|
|
|
|
|
|
Western Europe |
|
|
|
|
|
|
|
|
|
|
|
|
and the Caucasus |
|
|
|
|
|
|
|
|
|||||||||||||||||||||
|
|
|
|
|
|
|
|
Canada |
|
|
|
|
|
|
|
|
|
Rest of Eastern |
|
|
|
|
|
|
|
|
|
|
|
|
|
|
|
|
|
|
|
|
|
|
|
|
|
|
|
|
|
|
|
|||||||||||||||||||||||||||||
|
|
|
|
|
|
|
|
|
|
|
|
|
|
|
|
|
|
|
|
|
|
|
|
|
|
|
|
|
|
|
|
|
|
|
|
|
|
|
|
|
|
|
|
|
|
|
|
|
|
|
|
|
|
|
|
|
|
|
|
|
|
|
|
|
|
|
||||||||||||
|
United States of |
|
|
|
|
|
|
|
|
|
|
|
|
|
|
|
|
|
|
|
|
|
|
|
|
Western |
|
|
|
|
|
Europe |
|
|
Central |
|
|
|
|
|
|
|
|
|||||||||||||||||||||||||||||||||||
|
|
|
|
|
|
|
|
|
|
|
|
|
|
|
|
|
|
|
|
|
|
|
|
|
|
|
|
|
|
|
|
|
|
|
|
|
|
|
||||||||||||||||||||||||||||||||||||||||
|
|
|
|
|
|
|
|
|
|
|
|
|
|
|
|
|
|
|
|
|
|
|
|
|
Europe |
|
|
|
|
|
Eastern |
|
|
Asia |
|
|
|
|
|
|
|
|
|
|
|
|
|
|
|
|
|
|
Rest of |
|||||||||||||||||||||||||
|
America and |
|
|
|
|
|
|
|
|
|
|
|
|
|
|
|
|
|
|
|
|
|
|
|
|
|
|
|
|
|
|
|
|
|
Europe |
|
|
|
|
|
|
|
|
|
|
|
|
|
|
|
|
|
|
|
|
|
|
|
|
|
East Asia |
|||||||||||||||||
|
Rest of North America |
|
|
|
|
|
|
|
|
|
|
|
|
|
|
|
|
|
|
|
|
|
|
|
|
|
|
|
Rest of |
|
|
|
|
|
|
|
|
|
|
|
|
|
|
|
|
|
|
|
|
China and |
|
|
|
|||||||||||||||||||||||||
|
|
|
|
|
|
|
|
|
|
|
|
|
|
|
|
|
|
|
|
|
|
|
|
|
|
|
|
|
|
|
|
|
|
|
|
|
|
Turkey |
|
|
|
|
|
|
|
|
|
|
|
|
|
|
|
|
|
|
|
|
|
|
|
|
||||||||||||||||
|
|
|
|
|
|
|
|
|
|
|
|
|
|
|
|
|
|
|
|
|
|
|
|
|
|
|
|
|
Central |
Europe |
|
|
|
|
|
|
|
|
|
|
|
|
|
|
|
|
|
|
|
|
|
|
|
|
|
|
|
East Asia |
|
|
|
|
|
|
|
|
||||||||||||
|
|
|
|
|
|
|
|
|
|
|
|
|
|
|
|
|
|
|
|
|
|
|
|
|
|
|
|
|
|
|
|
|
|
|
|
|
|
|
|
|
|
|
|
|
|
|
|
|
|
|
|
|
|
|
|
|
|
|
|
|
Rest of |
|
|
|
|
|
|
|||||||||||
|
|
|
|
|
|
|
|
|
|
|
|
|
|
|
|
|
Central |
|
|
North |
|
|
|
|
|
|
|
|
|
|
|
|
Middle |
|
|
|
|
|
|
|
|
|
|
|
|
|
|
Japan |
||||||||||||||||||||||||||||||
|
|
|
|
|
|
|
|
|
|
|
|
|
|
|
|
|
|
|
|
|
|
|
|
|
|
|
|
|
|
|
|
|
|
|
|
|
|
|
|
|
|
|
|
|
||||||||||||||||||||||||||||||||||
|
|
|
|
|
|
|
|
|
|
|
|
|
|
|
|
|
|
|
|
|
|
|
|
|
|
|
|
|
|
|
East |
|
|
|
|
|
|
|
|
|
|
|
|
South Asia |
|
|
|
|
|
|
|
|
||||||||||||||||||||||||||
|
Mexico |
|
|
|
|
|
|
|
|
|
|
|
|
|
|
|
|
|
|
|
|
|
|
|
|
|
|
|
|
|
|
|
|
|
|
|
|
|
|
|
|
|
|
|
|
|
|
|
|
|
|
|
|
|
|
|||||||||||||||||||||||
|
|
|
|
|
|
|
|
|
|
|
|
|
|
America |
|
|
Africa |
|
|
|
|
|
|
|
|
|
|
|
|
|
|
|
|
|
|
|
|
|
|
|
|
|
|
|
|
|
|
|
|
|
|
|
|
Southeast |
||||||||||||||||||||||||
|
|
|
|
|
|
|
|
|
|
|
|
|
|
|
|
|
|
|
|
|
|
|
|
|
|
|
|
|
|
|
|
|
|
|
|
|
|
|
|
|
|
|
|
East Africa |
|
|
|
|
|
|
|
|
|
|
|
|
|
|
|
|
|
|
|
|
||||||||||||||
|
|
|
|
|
|
|
|
|
|
|
|
|
|
|
|
|
|
|
|
|
|
|
|
|
|
|
|
|
|
|
|
|
|
|
|
|
|
|
|
|
|
|
|
|
|
|
|
|
|
|
|
|
|
|
|
|
|
|
|
|
|
|
|
|||||||||||||||
|
|
|
|
|
|
|
|
|
|
|
|
|
|
|
|
|
|
|
|
|
|
|
|
|
|
|
|
|
|
|
|
|
|
|
|
|
|
|
|
|
|
|
|
|
|
|
|
|
|
|
|
|
|
|
|
|
|
|
|
|
|
|
|
Asia |
||||||||||||||
|
|
|
|
|
|
|
|
|
|
|
|
|
|
|
|
|
|
|
|
|
|
|
|
|
|
|
|
|
|
|
|
|
|
|
|
|
|
|
|
|
|
|
|
|
|
|
|
|
|
|
|
|
|
|
|
|
|
|
|
|
|
|
|
|||||||||||||||
|
|
|
|
|
|
|
|
|
|
|
|
|
|
|
|
|
|
|
|
|
|
|
|
|
|
|
|
West |
|
|
|
|
|
|
|
Rest of |
|
|
|
|
|
|
|
|
|
|
|
|
|
|
|
|
|
|
|
|
|
|
|
Indonesia and |
||||||||||||||||||
|
|
|
|
|
|
|
|
|
|
|
|
|
|
|
|
|
|
|
|
|
|
|
|
|
|
|
|
|
|
|
|
|
|
|
|
|
|
|
|
|
|
|
|
|
|
|
|
|
|
|
|
|
|
|
|
|
|
|||||||||||||||||||||
|
|
|
|
|
|
|
|
|
|
|
|
|
|
|
|
|
|
|
|
|
|
|
|
|
|
|
|
|
|
|
|
|
|
|
|
|
|
|
|
|
|
|
|
|
|
|
|
|
|
|
|
|
|
|
|
|
|
|||||||||||||||||||||
|
|
|
|
|
|
|
|
|
|
|
|
|
|
|
|
|
|
|
|
|
|
|
|
|
|
|
|
|
|
|
|
|
|
|
|
|
|
|
|
|
|
India |
|
|
||||||||||||||||||||||||||||||||||
|
|
|
|
|
|
|
|
|
|
|
|
|
|
|
|
|
|
|
|
|
|
|
|
|
|
|
|
Africa |
|
|
|
|
|
|
|
|
|
|
|
|
|
|
|
|
Southeast Pacific |
|||||||||||||||||||||||||||||||||
|
|
|
|
|
|
|
|
|
|
|
|
|
|
|
|
|
|
|
|
|
|
Brazil |
|
|
|
|
|
|
|
|
|
|
|
|
|
|
|
|||||||||||||||||||||||||||||||||||||||||
|
Net Exporters |
|
|
|
|
|
|
|
|
|
|
|
|
|
|
|
|
|
|
|
|
|
|
|
|
|
|
|
|
|
Southern Africa |
|
|
|
|
|
|
|
|
|
|
|
|
|
|
|
|
|
|
|
|
|
|
|
|
|||||||||||||||||||||||
|
|
|
|
|
|
|
|
Rest of |
|
|
|
|
|
|
|
|
|
|
|
|
|
|
|
|
|
|
|
|
|
|
|
|
|
|
|
|
|
|
|
|
|
|
|
|
|
|
|
|
|
|
|
|
|
|
|
|
|
|
|
|
||||||||||||||||||
|
Net Importers |
|
|
|
|
South America |
|
|
|
|
|
|
|
|
|
|
|
|
|
|
|
|
|
|
|
|
|
|
|
|
|
|
|
|
|
|
|
|
|
|
|
|
|
|
|
|
|
|
|
|
|
|
|
|
|
|
|
|
|
|
|
|
|
|
|
|
||||||||||||
|
|
|
|
|
|
South |
|
|
|
|
|
|
|
|
|
|
|
|
|
|
|
|
|
|
|
|
|
|
|
|
|
|
|
|
|
|
|
|
|
|
|
|
|
|
|
|
|
|
|
|
||||||||||||||||||||||||||||
|
Increase in net exports |
|
|
|
|
|
|
|
|
|
|
|
|
|
|
|
|
|
|
|
|
|
|
|
|
|
|
|
|
|
|
|
|
|
|
|
|
|
|
|
|
|
|
|
|
|
|
|
|
|
|
|
|
|
|
|
|
|
|
|
|
|
|
|
|
|
|
|
|
|
|
|
||||||
|
|
|
|
|
|
|
|
|
|
|
|
|
|
|
|
|
|
|
|
|
|
|
|
|
|
|
|
|
|
|
|
|
|
|
|
|
|
|
|
|
|
|
|
|
|
|
|
|
|
|
|
|
|
|
|
|
|
|
|
|
|
|
|
|
|
|
|
|
|
|
||||||||
|
|
|
|
|
|
|
|
|
|
|
|
|
|
|
|
|
|
|
|
|
|
|
|
|
|
|
|
|
|
|
|
|
|
|
|
|
|
|
|
|
|
|
|
|
|
|
|
|
|
|
|
|
|
|
|
|
|
|
|
|
|
|
|
|
|
Oceania |
||||||||||||
|
|
|
|
|
|
|
|
|
|
|
|
|
|
|
|
|
|
|
|
|
|
|
|
|
|
|
|
Africa |
|
|
|
|
|
|
|
|
|
|
|
|
|
|
|
|
|
|
|
|
|
|
|
|
|
|
|
|
|
|
|
|
|
|
|
|
|
|||||||||||||
|
Decrease in net exports |
|
|
|
|
|
|
|
|
|
|
|
|
|
|
|
|
|
|
|
|
|
|
|
|
|
|
|
|
|
|
|
|
|
|
|
|
|
|
|
|
|
|
|
|
|
|
|
|
|
|
|
|
|
|
|
|
|
|
|
|
|
|
|
|
|
|
|
|
|
|
|||||||
|
|
|
|
|
|
|
|
|
|
|
|
|
|
|
|
|
|
|
|
|
|
|
|
|
|
|
|
|
|
|
|
|
|
|
|
|
|
|
|
|
|
|
|
|
|
|
|
|
|
|
|
|
|
|
|
|
|
|
|
|
|
|
|
|
|
|
|
|
|
|
|
|
|
|
|
|||
USD billions |
|
|
|
|
|
|
|
|
|
|
|
|
|
|
|
|
|
|
|
|
|
|
|
|
|
|
|
|
|
|
|
|
|
|
|
|
|
|
|
|
|
|
|
|
|
|
|
|
|
|
|
|
|
|
|
|
|
|
|
|
|
|
|
|
|
|
|
|
|
|
|
|
|
|
|
|||
(Constant prices 2011) |
|
|
|
|
|
|
|
|
|
|
|
|
|
|
|
|
|
|
|
|
|
|
|
|
|
|
|
|
|
|
|
|
|
|
|
|
|
|
|
|
|
|
|
|
|
|
|
|
|
|
|
|
|
|
|
|
|
|
|
|
|
|
|
|
|
|
|
|
|
|
|
|
|
|
|
|||
NOTE: The final boundary between the Republic of the Sudan and the Republic of South Sudan has not yet been determined. Final status of the Abyei area has not yet been determined.
SOURCE: Based on data provided by Wageningen Economic Research. 2018. Climate Change and Global Market Integration: Implications for global economic activities, agricultural commodities and food security. SOCO 2018 Background Paper, FAO, Rome
FIGURE 2.4
CHANGES IN AGRICULTURAL PRODUCTION AND NET EXPORTS IN SELECTED COUNTRIES AND REGIONS IN 2050: CLIMATE CHANGE SCENARIO RELATIVE TO THE BASELINE
PERCENT
40
30
20
10
0
-10
-20
-30
Canada |
Russian Federation |
North Africa |
Rest of South Asia |
India |
West Africa |
|||
|
and the Caucasus |
|
|
|
|
|
|
|
|
|
|
Agri-food production |
|
|
Agri-food net exports |
|
|
|
|
|
|
|
|
|||
SOURCE: Based on data provided by Wageningen Economic Research. 2018. Climate Change and Global Market Integration: Implications for global economic activities, agricultural commodities and food security. SOCO 2018 Background Paper, FAO, Rome.
| 23 |
vk.com/id446425943
PART 2 THE LINKAGES BETWEEN AGRICULTURAL TRADE, FOOD SECURITY AND CLIMATE CHANGE
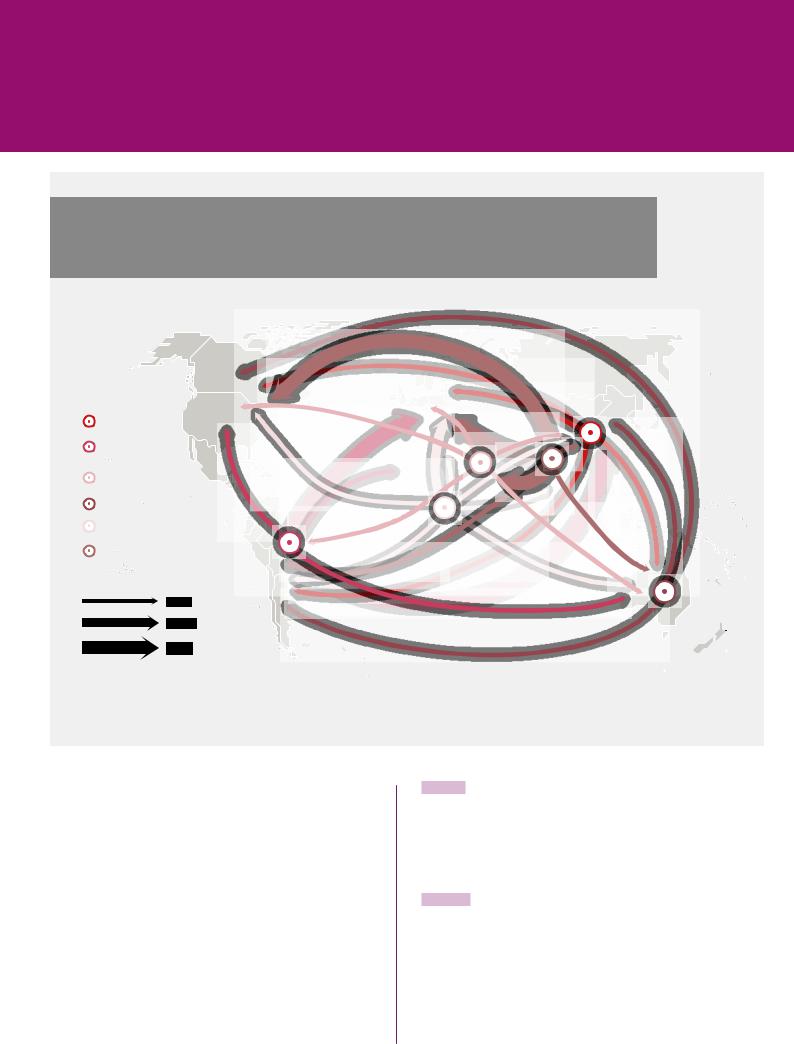
FIGURE 2.5
INCREASES IN EXPORTS OF AGRICULTURAL PRODUCTS IN 2050: CLIMATE CHANGE RELATIVE TO THE BASELINE (IN BILLION USD, 2011 CONSTANT PRICES)
 China and East Asia
Europe and
Central Asia
South and
Southeast Asia
Latin America and the Caribbean
Near East and
North Africa  North America
  Oceania
USD billions (Constant prices 2011)
0 − 0.5
0.5 − 0.9
≥ 0.9
SOURCE: Based on data provided by Wageningen Economic Research. 2018. Climate Change and Global Market Integration: Implications for global economic activities, agricultural commodities and food security. SOCO 2018 Background Paper, FAO, Rome.
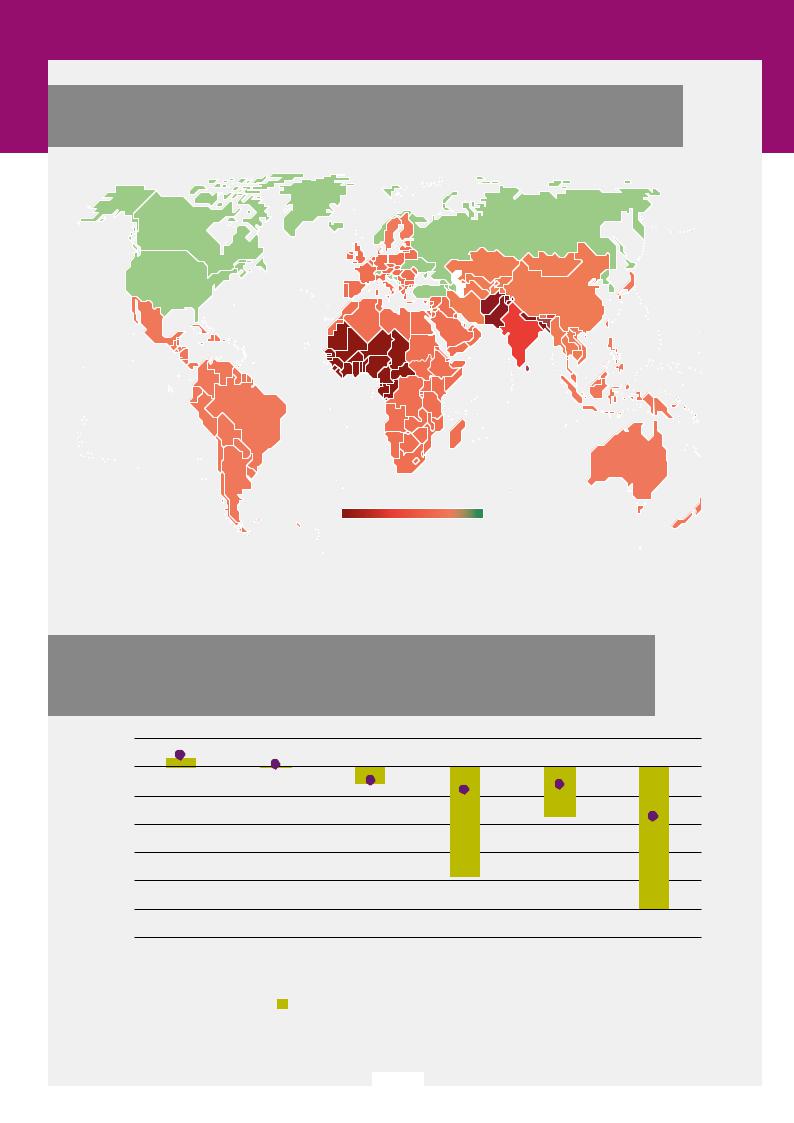
»While some regions may to some extent benefit from climate change, such as in the northern latitudes, GDP could decline significantly in Africa and South Asia, with losses of up to
2.5 percent and 1.9 percent respectively relative to the baseline.
The impact of changing climate on GDP can largely be understood as the joint effect of two major contributing factors. The first factor relates to the direction and magnitude of climate change effects on crops as defined by climate-induced crop yield shocks (Figure 2.2). The second revolves around how important the arable sector is to the economy, reflected by the share of crops in the value of output of all economic sectors (Figure 2.8). Developing
economies are found to be hit harder partly due to higher climate-induced crop yield losses, and due to their economic structure, in which crops typically account for a relatively large share of total value of output.
By 2050 the value of crops in developing countries is expected to account for an average of 3.5 percent of the output value of all sectors – contrasting with an average of only 0.6 percent in developed economies – due to a combination of their projected path to development and climate change. West Africa for example is projected to have over 23 percent of its agricultural and food processing output value generated from crops in 2050. This heavy reliance on crops renders developing economies more vulnerable to
| 24 |
vk.com/id446425943
THE STATE OF AGRICULTURAL COMMODITY MARKETS 2018
FIGURE 2.6
DECREASES IN EXPORTS OF AGRICULTURAL PRODUCTS IN 2050: CLIMATE CHANGE RELATIVE TO THE BASELINE (IN BILLION USD, 2011 CONSTANT PRICES)
China and East Asia
Latin America and
the Caribbean
Near East and
North Africa
Oceania
Sub-Saharan Africa
South and
Southeast Asia
USD billions
(Constant prices 2011)
0 − 0.5
0.5 − 0.9
≥ 0.9
SOURCE: Based on data provided by Wageningen Economic Research. 2018. Climate Change and Global Market Integration: Implications for global economic activities, agricultural commodities and food security. SOCO 2018 Background Paper, FAO, Rome.
extreme weather events and underlines the importance of structural transformation in adapting to climate change.
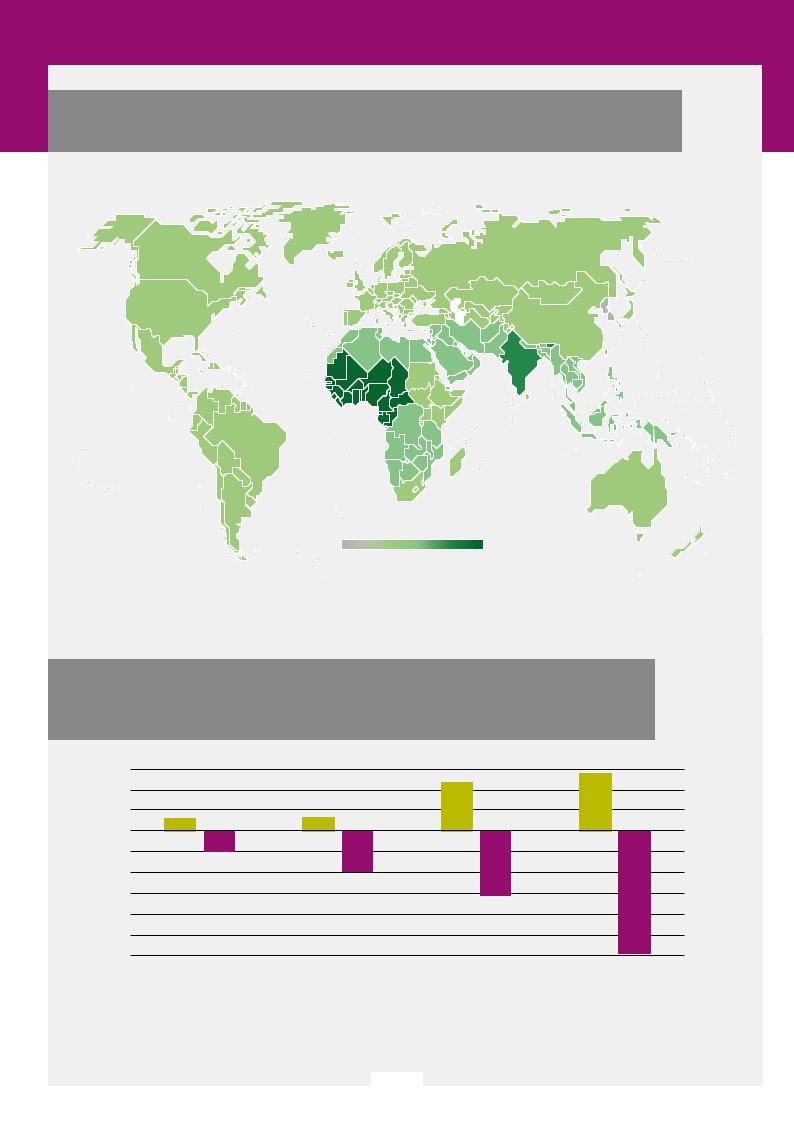
At the global level, the decrease in agricultural production due to climate change is expected to result in a relatively small increase in world food market prices. Nevertheless, across regions food price changes will differ depending on the uneven impact of climate change on agricultural production and the extent to which countries and regions adjust to changing climate in terms of GDP, wages and trade. Food consumer prices are expected to increase relative to the baseline in many regions, such as West Africa (5.6 percent), India (4.6 percent), the Rest of South Asia
(1.3 percent), and North Africa (1.2 percent)
(Figure 2.9). These changes in food prices will have an impact on food purchasing power – an indicator of access to food, calculated by the ratio of the price of food over the wage rate – posing a significant threat to food security. In West Africa for example, food purchasing power could decline by nearly 12 percent due to climate change
(Figure 2.10). In India, food purchasing power is expected to decline by 6.2 percent. Poor rural households are likely to be hit hardest by declines in food purchasing power. Specific interventions that can strengthen their capacity to adapt, such as linking climate-smart policies to social protection mechanisms, will be necessary. n
| 25 |
vk.com/id446425943
PART 2 THE LINKAGES BETWEEN AGRICULTURAL TRADE, FOOD SECURITY AND CLIMATE CHANGE
FIGURE 2.7
CHANGES IN GDP IN 2050: CLIMATE CHANGE SCENARIO RELATIVE TO THE BASELINE
Decrease |
Increase |
NOTE: The final boundary between the Republic of the Sudan and the Republic of South Sudan has not yet been determined. Final status of the Abyei area has not yet been determined.
SOURCE: Based on data provided by Wageningen Economic Research. 2018. Climate Change and Global Market Integration: Implications for global economic activities, agricultural commodities and food security. SOCO 2018 Background Paper, FAO, Rome.
FIGURE 2.8
CHANGES IN GDP IN SELECTED COUNTRIES AND REGIONS IN 2050: CLIMATE CHANGE SCENARIO RELATIVE TO THE BASELINE
PERCENT
0.5
0.0
-0.5
-1.0
-1.5
-2.0
-2.5
-3.0
Canada |
Russian Federation |
North Africa |
Rest of South Asia |
India |
West Africa |
|
and the Caucasus |
|
|
|
|
GDP  Climate-induced yield change weighted by crops output value share
SOURCE: Wageningen Economic Research. 2018. Climate Change and Global Market Integration: Implications for global economic activities, agricultural commodities and food security. SOCO 2018 Background Paper, FAO, Rome.
| 26 |
vk.com/id446425943
THE STATE OF AGRICULTURAL COMMODITY MARKETS 2018
FIGURE 2.9
CHANGES IN FOOD PRICES IN 2050: CLIMATE CHANGE SCENARIO RELATIVE TO THE BASELINE
Decrease |
Increase |
NOTE: The final boundary between the Republic of the Sudan and the Republic of South Sudan has not yet been determined. Final status of the Abyei area has not yet been determined.
SOURCE: Based on data provided by Wageningen Economic Research. 2018. Climate Change and Global Market Integration: Implications for global economic activities, agricultural commodities and food security. SOCO 2018 Background Paper, FAO, Rome.
FIGURE 2.10
CHANGES IN FOOD PRICES AND FOOD PURCHASING POWER IN SELECTED COUNTRIES/REGIONS IN 2050: CLIMATE CHANGE SCENARIO RELATIVE TO THE BASELINE
PERCENT
6
4
2
0
-2
-4
-6
-8
-10
-12
North Africa |
|
Rest of South Asia |
|
India |
West Africa |
|
|
Food consumer prices |
|
Food purchasing power |
|
|
|
|
|
SOURCE: Wageningen Economic Research. 2018. Climate Change and Global Market Integration: Implications for global economic activities, agricultural commodities and food security. SOCO 2018 Background Paper, FAO, Rome.
| 27 |

vk.com/id446425943
PART 2 THE LINKAGES BETWEEN AGRICULTURAL TRADE, FOOD SECURITY AND CLIMATE CHANGE
BOX 2.5
THE IMPACT OF CLIMATE CHANGE ON FISHERIES
Fish and fish products are among the most highly traded foods. In 2016, about 35 percent of global fish production was traded, and in general it is estimated that as much as 78 percent is exposed to foreign competition. International fish trade, measured in total real export value, has grown substantially over the past four decades. Between 1976 and 2016, total traded value increased fourfold from USD 33.1 billion to USD 142.5 billion. The international trade in fish made up 52 percent of total animal protein trade value in 2016.
The impacts of climate change on both fisheries and aquaculture are also expected to be significant, but are subject to uncertainty. Fish will be exposed to a complex mix of changing abiotic conditions, such as changes in temperature, salinity, oxygen and water pH. There will also be changes in biotic conditions, related to shifting distribution and migration patterns, species compositions, and abundance of predators and prey, among other things. These changes may affect the physiology, phenology, and behaviour of fish at any life-history stage, and can increase or reduce local abundance. However, adaptive capacity will vary across species. A recent study by FAO suggests that by 2050 climate change (as reflected by the Representative Concentration Pathway 2.6 [RCP2.6]) may result in decreases in the maximum catch potential in the world’s exclusive economic zones of between 2.8 percent and 5.3 percent. A more severe climate change scenario (RCP8.5) suggests decreases between 7.0 percent and 12.1 percent. The effects of climate change in catch potential are expected to vary substantially between regions. These projections reflect changes in the capacity of oceans to produce fish and do not take into account adaptation measures that may offset climate change effects.
In general, fish production is expected to increase at high northern latitudes, and less so at high southern latitudes, particularly in the South Pacific. Changes in production and distribution patterns have already started to create international jurisdiction issues and caused challenges to the governance structure of fisheries management at both international and
national level. Such is the case regarding the migration of cod and mackerel stocks in the north Atlantic and of fish stocks shifting to the management zone of new regional fisheries management councils in the United States of America.
Competition for scarce water resources often undervalues the significant contributions of inland fisheries to food security. Inland fisheries in Iraq, Morocco, Pakistan and Spain already face high stress levels that are expected to become even higher in future. In other countries – such as Cambodia, Colombia, Myanmar, the Central African Republic and the Congo – inland fisheries are, at present, characterized by low stress and it is expected that they will remain so in the future. The implications of climate change for individuals, communities and countries dependent on inland fisheries can be expected to be significant.
Aquaculture has been the world´s fastest growing food production system since the 1970s. Growth in aquaculture production has been supported by new technologies that have facilitated the domestication of new species and the development of more productive strains. Higher water temperatures due to climate change may increase the rate of growth of cultured stock, which may enhance aquaculture production. However, when temperatures rise above the optimal range, they could lead to reduced feed intake and feed utilization efficiency. For coastal species, extreme weather events and sea-level rises may be the most important challenges, and increases in temperature could also accelerate the rate of eutrophication and harmful algal blooms as well as the spread of bacterial diseases, negatively affecting fish health and production. For pond-raised species, the salinity of soil may create an additional challenge. In general, however, the adaptive capacity of aquaculture is perceived to be higher than in fisheries, as the control over the production processes facilitates the shift in production to more suitable locations and species.
Our knowledge of the impacts of climate change on livelihoods revolving around fisheries and aquaculture is more limited. However, a study on the
| 28 |

vk.com/id446425943
THE STATE OF AGRICULTURAL COMMODITY MARKETS 2018
BOX 2.5
(CONTINUED)
vulnerability of 132 national economies to the climate change impact on fisheries, suggests that the most vulnerable communities tend to be in tropical Africa, north-western South America and in Asia, where fish consumption makes up a very high share of the protein and nutrients in diet. These countries have also struggled with the additional challenges posed by overfishing and declining fisheries landings, underlining the fact that the effects of climate change on societies and food security are not confined to the direct physical impacts. More than 33 percent of global marine stocks monitored by FAO are being overexploited. There is
some evidence that severe overfishing makes stocks much more vulnerable to climate change, rendering fisheries management systems important in adaptation efforts. Fisheries and aquaculture are critically important for millions of people in coastal, riverine, insular and inland regions whose livelihoods depend on the sector. These population groups are the most vulnerable to the impacts of climate change, and particular attention needs to be given to them while designing adaptation measures if the fisheries sector is to continue to contribute to meeting global goals of poverty reduction and zero hunger.
SOURCE: Adapted from Asche, F. 2018. Impacts of climate change on the production and trade of fish and fishery products. SOCO 2018 Background Paper, Rome, FAO; Barange, M., Bahri, T., Beveridge, M.C.M., Cochrane, K.L., Funge-Smith, S. & Poulain, F., eds. 2018. Impacts of climate change on fisheries and aquaculture: synthesis of current knowledge, adaptation and mitigation options. FAO Fisheries and Aquaculture Technical Paper No. 627. Rome, FAO. 628 pp.; FAO, 2018. The State of World Fisheries and Aquaculture 2018. Rome.
| 29 |

vk.com/id446425943
VIET NAM
Early morning fish market ©FAO/TM Dien.

vk.com/id446425943
PART 3 AGRICULTURAL TRADE AND CLIMATE CHANGE: EXPLORING THE POLICY SPACE
Key points
1 In principle, there is no fundamental conflict between climate change policies
and multilateral trade rules. Various provisions of the WTO can accommodate the implementation of climate-related policies of the Paris Agreement.
2 There is scope for countries to pursue environmental protection objectives under
WTO rules. However, the interpretation and application of these rules with regard to the treatment of identical food products that differ solely in their carbon footprint remains untested. An internationally agreed definition of carbon footprint could facilitate the implementation of policies for climate change adaptation and mitigation.
3 Discussions should be pursued at the juncture of the Paris Agreement and the
WTO agreements to strengthen their mutually supportive approach. This can contribute to reducing agricultural emissions globally.

vk.com/id446425943
PART 3
AGRICULTURAL TRADE AND CLIMATE CHANGE: EXPLORING THE POLICY SPACE
PARIS AGREEMENT AND THE WORLD TRADE ORGANIZATION (WTO) AGREEMENTS
The uneven impact of climate change on agricultural production across regions will heighten the role of trade in adaptation and in contributing to food security. To a large extent, this potential will depend on a well-functioning trading system and consequently on domestic policies and border measures. The Paris Agreement has succeeded in reaching a political consensus around tackling the challenges of climate change collectively. However, its effectiveness in promoting adaptation and mitigation in agriculture will depend on specific actions that are yet to be discussed. This discussion will have to take place on the basis, inter alia, of the Paris Agreement and the WTO agreements – in particular the AoA, which covers agricultural policy instruments – and seek to identify how to strengthen the mutually supportive approach of both accords.35
Paris Agreement
The adoption of the Paris Agreement in December 2015 marked a major step forward in global efforts to tackle climate change. The landmark agreement, reached by 196 participating Parties to the United Nations Framework Convention on Climate Change (UNFCCC), was hailed as a fresh approach to international cooperation reflecting the evolving thinking on how countries can address climate change collectively.36 While the Kyoto Protocol – the predecessor climate accord scheduled to elapse at the end of 2020 – operated on a rigid
distinction in responsibilities between different groups of countries37 on account of past GHG emissions, the Paris Agreement marks a departure from this approach. This new climate accord acknowledges that the geographic distribution of global economic activities has changed (see Part 1), and that there is a need for the participation of a broader set of countries responsible for an increasing share of GHG emissions to effectively manage the threat of climate change in the future.
The Paris Agreement recognizes the growing role and potential of the developing world to contribute to climate change mitigation efforts, but it also remains true to the UNFCCC principle of “common but differentiated responsibilities and respective capabilities.”38 Specifically, the Agreement recognizes that countries differ not only in their historical and current emissions, in relative and absolute terms, but also in their priorities and capacity to pursue adaptation and mitigation measures in line with global efforts to address climate change.
The balance between universal participation and differentiated responsibilities in the Paris Agreement is achieved by allowing far greater autonomy in the way countries can contribute to the collective target of keeping the rise in global average temperature to significantly below 2 °C. This contrasts with the Kyoto Protocol, which laid out concrete individual targets (for developed countries) in terms of reducing emissions over a well-defined timeline, and
stipulated market-based instruments and enforcement mechanisms formulated through top-down decision-making processes (Box 3.1).
The flexibility allowed under the Paris Agreement is reflected in the system of Nationally Determined Contributions (NDCs) – national
| 32 |