


vk.com/id446425943
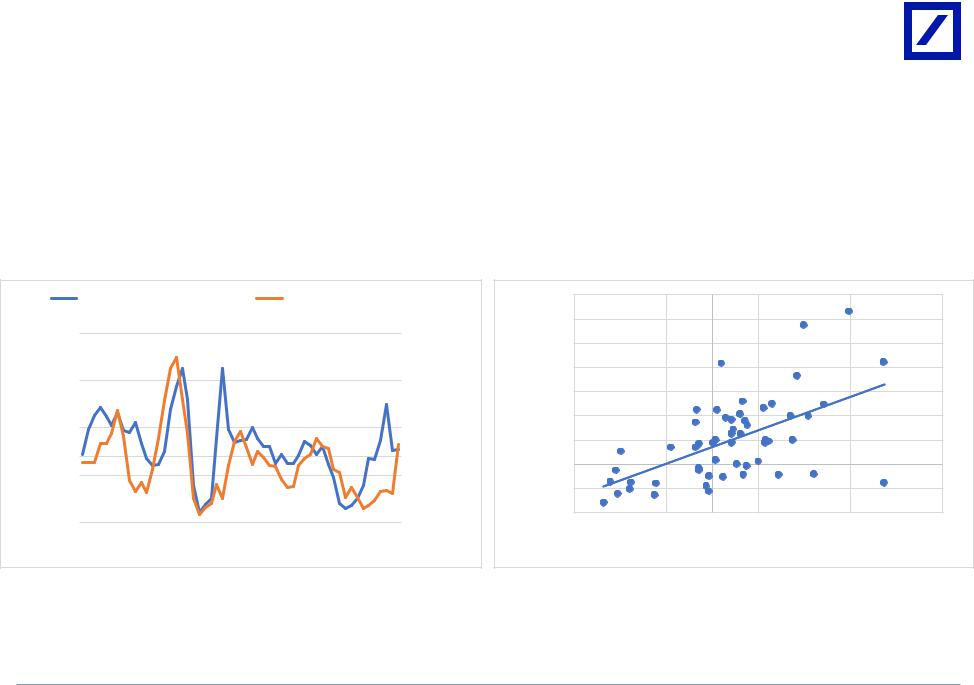
Especially most recently, leverage has become a burden
|
|
Unlevered names have generally outperformed levered names |
|
|
|
|
|
Net Debt/EBITDA as of latest quarter |
|
|
|||||||||||||||||
|
|
|
|
|
|
|
|
Unlevered |
|
Levered |
|
|
|
|
|
|
9.0x |
|
|
|
|
|
|
|
|
||
110% |
|
|
|
|
|
|
|
|
|
|
|
|
|
|
|
|
|
|
8.0x |
|
|
|
|
|
|
|
|
|
|
|
|
|
|
|
|
|
|
|
|
|
|
|
|
|
|
|
|
|
|
|
|
|
|
|
|
105% |
|
|
|
|
|
|
|
|
|
|
|
|
|
|
|
|
|
|
7.0x |
|
|
|
|
|
|
|
|
|
|
|
|
|
|
|
|
|
|
|
|
|
|
|
|
|
|
|
|
|
|
|
|
|
|
|
|
100% |
|
|
|
|
|
|
|
|
|
|
|
|
|
|
|
|
|
|
6.0x |
|
|
|
|
|
|
|
|
95% |
|
|
|
|
|
|
|
|
|
|
|
|
|
|
|
|
|
|
5.0x |
|
|
|
|
|
|
|
|
90% |
|
|
|
|
|
|
|
|
|
|
|
|
|
|
|
|
|
|
4.0x |
|
|
|
|
|
|
|
|
85% |
|
|
|
|
|
|
|
|
|
|
|
|
|
|
|
|
|
|
3.0x |
|
|
|
|
|
|
|
|
80% |
07/06/2018 |
07/12/2018 |
07/18/2018 |
07/24/2018 |
07/30/2018 |
08/03/2018 |
08/09/2018 08/15/2018 |
08/21/2018 08/27/2018 08/31/2018 |
09/07/2018 |
09/13/2018 |
09/19/2018 09/25/2018 |
10/01/2018 10/05/2018 |
10/11/2018 10/17/2018 |
10/23/2018 |
10/29/2018 11/02/2018 |
11/08/2018 11/14/2018 |
11/20/2018 |
|
2.0x |
NWL |
COTY |
KDP |
TAP |
COT |
STZ |
VVV |
EPC |
06/29/2018 |
|
SPB |
|||||||||||||||||||||||||
|
|
|
|
|
|
|
|
|
|
|
|
|
|
|
|
|
|
|
1.0x |
|
|
|
|
|
|
|
|
|
|
|
|
|
|
|
|
|
|
|
|
|
|
|
|
|
|
|
0.0x |
|
|
|
|
|
|
|
|
|
|
|
|
|
|
|
HY Credit spreads have widened |
|
|
|
|
|
|
|
|
2H stock price performance |
|
|
|
||||||||
500 bps |
|
|
|
|
|
|
|
|
|
|
|
|
|
|
|
|
|
|
30% |
|
|
|
|
|
|
|
|
400 bps |
|
|
|
|
|
|
|
|
|
|
|
|
|
|
|
|
|
|
20% |
|
|
|
KDP, the notable outperformer |
||||
|
|
|
|
|
|
|
|
|
|
|
|
|
|
|
|
|
|
|
10% |
|
|
|
amongst levered names |
|
|||
300 bps |
|
|
|
|
|
|
|
|
|
|
|
|
|
|
|
|
|
|
|
|
|
|
|
|
|
|
|
|
|
|
|
|
|
|
|
|
|
|
|
|
|
|
|
|
|
|
|
|
|
|
|
|
|
|
|
|
|
|
|
|
|
|
|
|
|
|
|
|
|
|
|
|
|
|
0% |
|
|
|
|
|
|
|
|
200 bps |
|
|
|
|
|
|
|
|
|
|
|
|
|
|
|
|
|
|
-10% |
|
|
|
|
|
|
|
|
|
|
|
|
|
|
|
|
|
|
|
|
|
|
|
|
|
|
|
|
|
|
|
|
|
|
|
|
100 bps |
|
|
|
|
|
|
|
|
|
|
|
|
|
|
|
|
|
|
-20% |
|
|
|
|
|
|
|
|
|
|
|
|
|
|
|
|
|
|
|
|
|
|
|
|
|
|
|
|
|
|
|
|
|
|
|
|
0 bps |
|
|
|
|
18 |
|
18 |
|
|
|
|
|
18 |
|
18 |
|
|
18 |
-30% |
|
|
|
|
|
|
|
|
17 |
|
18 |
|
|
18 |
18 |
|
18 |
18 |
|
18 |
|
-40% |
|
|
|
|
|
|
|
|
||||||
Dec |
|
Jan |
|
Feb |
|
Mar |
Apr |
May |
|
Jun |
Jul |
Aug |
|
Sep |
Oct |
|
Nov |
|
|
|
|
|
|
|
|
||
|
|
|
|
|
|
-50% |
|
|
|
|
|
|
|
|
|||||||||||||
|
|
|
|
|
|
|
HY Consumer |
|
|
IG Consumer |
|
|
|
|
|
|
|
|
|
|
|
|
|
||||
|
|
|
|
|
|
|
|
|
|
|
|
|
|
SPB |
NWL |
COTY |
KDP |
TAP |
COT |
STZ |
VVV |
EPC |
|||||
Levered names as shown. Unlevered names include: PG, KO, PEP, MO,CL, KMB, MNST, EL, CLX, CHD, CCEP, and NUS. Credit spreads data includes consumer products USD-denominated debt for high yield and investment grade issuers on an options-adjusted basis.
Source: FactSet, Deutsche Bank analysis
Deutsche Bank |
Steve Powers | (+1) 212 250-5480 | stephen.powers@db.com |
|
Research |
Faiza Alwy | (+1) 212 250-7611 | faiza.alwy@db.com |
9 |

vk.com/id446425943
Mirroring the broader market, CPG “Growth” names have lost their luster
CPG growth names like EL, STZ, MNST, BF.B saw their stock prices and valuation multiples expand from mid-2017 through 1H18; however, performance stalled in 2H18 due to elevated global growth fears
|
|
|
|
|
|
|
|
Indexed stock price performance |
|
|
|
|
|
|
|
|
|
||||||||||||
|
|
|
|
|
|
|
EL |
|
|
BF.B |
|
|
STZ |
|
|
MNST |
|
|
|
|
|
|
|||||||
220% |
|
|
|
|
|
|
|
|
|
|
|
|
|
|
|
|
|
|
|
|
|
|
|
|
|
|
|
|
|
200% |
|
|
|
|
|
|
|
|
|
|
|
|
|
|
|
|
|
|
|
|
|
|
|
|
|
|
|
|
multiples |
180% |
|
|
|
|
|
|
|
|
|
|
|
|
|
|
|
|
|
|
|
|
|
|
|
|
|
|
|
|
|
|
|
|
|
|
|
|
|
|
|
|
|
|
|
|
|
|
|
|
|
|
|
|
|
|
|
|
|
GrowthCPG |
|
160% |
|
|
|
|
|
|
|
|
|
|
|
|
|
|
|
|
|
|
|
|
|
|
|
|
|
|
|
|
|
|
|
|
|
|
|
|
|
|
|
|
|
|
|
|
|
|
|
|
|
|
|
|
|
|
|
|
|
|
|
140% |
|
|
|
|
|
|
|
|
|
|
|
|
|
|
|
|
|
|
|
|
|
|
|
|
|
|
|
|
|
120% |
|
|
|
|
|
|
|
|
|
|
|
|
|
|
|
|
|
|
|
|
|
|
|
|
|
|
|
|
|
100% |
|
|
|
|
|
|
|
|
|
|
|
|
|
|
|
|
|
|
|
|
|
|
|
|
|
|
|
|
|
80% |
|
|
|
|
|
|
|
|
|
|
|
|
|
|
|
|
|
|
|
|
|
|
|
|
|
|
|
|
|
11/23/2016 |
12/19/2016 |
01/13/2017 |
02/08/2017 |
03/06/2017 |
03/29/2017 |
04/24/2017 |
05/17/2017 |
06/12/2017 |
07/06/2017 |
07/31/2017 |
08/23/2017 |
09/18/2017 |
10/11/2017 |
11/03/2017 |
11/29/2017 |
12/22/2017 |
01/19/2018 |
02/13/2018 |
03/09/2018 |
04/04/2018 |
04/27/2018 |
05/22/2018 |
06/15/2018 |
07/11/2018 |
08/03/2018 |
08/28/2018 |
09/21/2018 |
10/16/2018 |
11/08/2018 |
|
|
|
|
|
|
|
NTM valuation multiples |
|
|
|
|
|
|
|
|
|||||||||
Average of CPG growth names (LHS) |
|
|
Vs. S&P 500 multiple (RHS) |
|||||||||||||||||||||
|
|
|
|
|
|
|
|
|
|
|
|
|
|
|
|
|
|
|
|
|
|
|
2.0x |
|
32.0x |
|
|
|
|
|
|
|
|
|
|
|
|
|
|
|
|
|
|
|
|
|
|
|
|
|
|
|
|
|
|
|
|
|
|
|
|
|
|
|
|
|
|
|
|
|
|
|
1.9x |
|
30.0x |
|
|
|
|
|
|
|
|
|
|
|
|
|
|
|
|
|
|
|
|
|
|
1.8x |
multiples |
|
|
|
|
|
|
|
|
|
|
|
|
|
|
|
|
|
|
|
|
|
|
|
||
|
|
|
|
|
|
|
|
|
|
|
|
|
|
|
|
|
|
|
|
|
|
|
1.7x |
|
28.0x |
|
|
|
|
|
|
|
|
|
|
|
|
|
|
|
|
|
|
|
|
|
|
Vs.market |
|
|
|
|
|
|
|
|
|
|
|
|
|
|
|
|
|
|
|
|
|
|
|
1.6x |
||
|
|
|
|
|
|
|
|
|
|
|
|
|
|
|
|
|
|
|
|
|
|
|
|
|
26.0x |
|
|
|
|
|
|
|
|
|
|
|
|
|
|
|
|
|
|
|
|
|
|
|
|
|
|
|
|
|
|
|
|
|
|
|
|
|
|
|
|
|
|
|
|
|
|
|
1.5x |
|
24.0x |
|
|
|
|
|
|
|
|
|
|
|
|
|
|
|
|
|
|
|
|
|
|
1.4x |
|
|
|
|
|
|
|
|
|
|
|
|
|
|
|
|
|
|
|
|
|
|
|
|
|
|
22.0x |
|
|
|
|
|
|
|
|
|
|
|
|
|
|
|
|
|
|
|
|
|
|
1.3x |
|
11/23/2016 |
12/23/2016 |
01/26/2017 |
02/27/2017 |
03/28/2017 |
04/27/2017 |
05/26/2017 |
06/27/2017 |
07/27/2017 |
08/25/2017 |
09/26/2017 |
10/25/2017 |
11/24/2017 |
12/26/2017 |
01/26/2018 |
02/27/2018 |
03/28/2018 |
04/27/2018 |
05/29/2018 |
06/27/2018 |
07/27/2018 |
08/27/2018 |
09/26/2018 |
10/25/2018 |
|
Source: FactSet, Deutsche Bank analysis
Deutsche Bank |
Steve Powers | (+1) 212 250-5480 | stephen.powers@db.com |
|
Research |
Faiza Alwy | (+1) 212 250-7611 | faiza.alwy@db.com |
10 |

vk.com/id446425943
So, where do we go from here? Fundamentally, on top-line...
US/Europe |
China |
6.0%
5.0%
4.0%
3.0%
2.0%
1.0%
0.0%
(1.0%)
HPC/Bev Organic Growth Coinciding with Strong US Retail SSS
(0.5%) 2.3% |
0.0% 4.2% |
1.8% 3.7% |
1.6% 3.2% |
3.2% 3.3% |
2.2% 3.6% |
3.3% 5.4% |
2.5% 3.8% |
|
|
|
|
|
|
|
|
|
|
|
|
|
|
|
|
|
|
|
1Q17 |
2Q17 |
3Q17 |
4Q17 |
1Q18 |
2Q18 |
3Q18 |
4Q18E |
|
9.0%
7.5%
6.0%
4.5%
3.0%
1.5%
0.0%
(1.5%)
Growth in China remains robust for many despite trade war rhetoric
(PEP +DD; EL +DD; PG +4%; KO “strong”)
|
HPC |
|
Beverages |
|
Retail SSS (RHS) |
|
|
|
US trends improving but how much of US strength is because economy at a peak?
Will pricing stick?
Europe benefited from weather in ’18, and fears of Brexit’s impact loom in the nearto mid-term
But tariff risks loom:
“And as the President has also made clear, we will levy even more tariffs, with the possibility of substantially more than doubling [$250B], unless a fair and reciprocal deal is made.” – VP Pence
Source: FactSet, Company filings, Deutsche Bank analysis
Brazil
Volatile macro in Brazil led to more mixed performance recently
On one hand, MNST +32%; KMB +High teens; PEP +DD; PG +HSD.
On the other hand, CL, EL, and AVP each cited declines and a tough environment
However, even as economy remains distressed, there is some hope of pricing flowing through, as well as hope of stabilization amidst a new government
Deutsche Bank |
Steve Powers | (+1) 212 250-5480 | stephen.powers@db.com |
|
Research |
Faiza Alwy | (+1) 212 250-7611 | faiza.alwy@db.com |
11 |

vk.com/id446425943
Where do we go from here?
Lower oil prices fuelling optimism on GM expansion…
While oil prices have declined recently, natural gas prices have |
Typically, there is a 2-quarter lag between oil price changes and GM |
|
increased materially, likely muting the positive impact on margins (along |
||
change on a quarterly basis |
||
with pulp contracts at higher rates and other cost inflation – e.g., freight) |
||
|
|
|
|
|
|
|
|
Indexed price change since 1/1/17 |
|
|
|
|
|
|
|
|
|
|
YoY % chg. In WTI Crude (LHS) |
YoY % Chg. In GM (RHS) |
||||||
175% |
|
|
|
|
|
|
|
|
Natural Gas |
|
|
|
Crude Oil |
|
|
|
|
|
|
|
Lag |
|
(100%) |
4.0% |
|
|
|
|
|
|
|
|
|
|
|
|
|
|
|
|
|
|
|
|
|
|
|
||||
155% |
|
|
|
|
|
|
|
|
|
|
|
|
|
|
|
|
|
|
|
|
|
|
(80%) |
3.0% |
|
|
|
|
|
|
|
|
|
|
|
|
|
|
|
|
|
|
|
|
|
|
Qtr |
|
(60%) |
||
|
|
|
|
|
|
|
|
|
|
|
|
|
|
|
|
|
|
|
|
|
|
2.0% |
|||
|
|
|
|
|
|
|
|
|
|
|
|
|
|
|
|
|
|
|
|
|
|
|
(40%) |
||
135% |
|
|
|
|
|
|
|
|
|
|
|
|
|
|
|
|
|
|
|
|
|
Chg%in Oil, 2 |
(inverted) |
||
|
|
|
|
|
|
|
|
|
|
|
|
|
|
|
|
|
|
|
|
|
(20%) |
1.0% |
|||
|
|
|
|
|
|
|
|
|
|
|
|
|
|
|
|
|
|
|
|
|
|
||||
|
|
|
|
|
|
|
|
|
|
|
|
|
|
|
|
|
|
|
|
|
|
60% |
|||
115% |
|
|
|
|
|
|
|
|
|
|
|
|
|
|
|
|
|
|
|
|
|
|
|
0% |
0.0% |
|
|
|
|
|
|
|
|
|
|
|
|
|
|
|
|
|
|
|
|
|
|
|
|
20% |
|
95% |
|
|
|
|
|
|
|
|
|
|
|
|
|
|
|
|
|
|
|
|
|
|
|
40% |
(1.0%) |
75% |
|
|
|
|
|
|
|
|
|
|
|
|
|
|
|
|
|
|
|
|
|
YoY |
|
80% |
(2.0%) |
|
|
|
|
|
|
|
|
|
|
|
|
|
|
|
|
|
|
|
|
|
|
|
|||
11/01/17 |
11/15/17 |
11/29/17 |
12/13/17 |
12/27/17 |
01/10/18 |
01/24/18 |
02/07/18 |
02/21/18 |
03/07/18 03/21/18 04/04/18 04/18/18 05/02/18 |
05/16/18 |
05/30/18 |
06/13/18 |
06/27/18 07/11/18 07/25/18 |
08/08/18 |
08/22/18 |
09/05/18 |
09/19/18 |
10/03/18 |
10/17/18 |
10/31/18 |
11/14/18 |
|
100% |
(3.0%) |
|
|
1Q04 4Q04 3Q05 2Q06 1Q07 4Q07 3Q08 2Q09 1Q10 4Q10 3Q11 2Q12 1Q13 4Q13 3Q14 2Q15 1Q16 4Q16 3Q17 2Q18 |
||||||||||||||||||||||||
YoY Chg in Avg. Quarterly GM
On an LTM basis, there is an R-square of 46% between change in reported GM and changes in oil prices (since 2005) with a 2-qtr lag
Approximately 37% of the YoY change in quarterly GM can be explained by YoY change in quarterly oil prices (with 2-qtr lag)
|
2.5% |
|
|
y = -0.024x + 0.0021 |
|
|
4.0% |
|
|
|
|
|
2.0% |
|
|
|
GM |
3.0% |
|
|
y = -0.0207x + 0.002 |
||
GMLTMinChgYoY |
1.5% |
|
|
R² = 0.4593 |
|
|
|
R² = 0.3703 |
|
||
|
|
|
|
QuarterlyinChgYoY |
(2.0%) |
|
|
|
|||
|
1.0% |
|
|
|
|
|
2.0% |
|
|
|
|
|
0.5% |
|
|
|
|
|
1.0% |
|
|
|
|
|
0.0% |
|
|
|
|
|
|
|
|
|
|
|
|
|
|
|
|
0.0% |
|
|
|
|
|
|
(0.5%) |
|
|
|
|
|
|
|
|
|
|
|
|
|
|
|
|
|
|
|
|
|
|
|
(1.0%) |
|
|
|
|
|
(1.0%) |
|
|
|
|
|
(1.5%) |
|
|
|
|
|
|
|
|
|
|
|
(2.0%) |
|
|
|
|
|
|
|
|
|
|
|
(2.5%) |
|
|
|
|
|
(3.0%) |
|
|
|
|
|
(75%) |
(25%) |
25% |
75% |
125% |
|
(75%) |
(25%) |
25% |
75% |
125% |
|
|
YoY % Chg in LTM Oil, 2 Qtr Lag |
|
|
|
|
YoY % Chg in Oil, 2 Qtr Lag |
|
|
||
CPG companies include: PG, KMB, CLX, CHD (from 2011), CL, and PEP |
|
|
|
|
|
|
|
||||
Source: FactSet, Company filings, Deutsche Bank analysis |
|
|
|
|
|
|
|
|
|||
Deutsche Bank |
Steve Powers | (+1) 212 250-5480 | stephen.powers@db.com |
|
Research |
Faiza Alwy | (+1) 212 250-7611 | faiza.alwy@db.com |
12 |

vk.com/id446425943
Where do we go from here?
However, the market typically prices lower oil in real-time…meaning current stock prices may already be reflecting much of these benefits
|
|
Crude Oil WTI ($/bbl) YoY chg. LHS |
|
|
|
||
|
75% |
YoY CPG Relative Price Performance vs. S&P - RHS |
-25% |
S&P |
|||
|
|
|
|
|
|||
|
65% |
|
|
|
|
|
|
YoY($/bbl)WTIchg. |
|
|
|
|
-20% |
PerformancePricevs. |
|
55% |
|
|
|
|
|||
|
|
|
|
|
|||
|
|
|
|
|
|
|
|
|
45% |
|
|
|
|
-15% |
|
|
35% |
|
|
|
|
-10% |
|
|
|
|
|
|
|
|
|
|
25% |
|
|
|
|
|
|
CrudeOil |
15% |
|
|
|
|
-5% |
RelativeCPG |
|
|
|
|
|
|||
5% |
|
|
|
|
0% |
||
|
|
|
|
|
|
||
|
-5% |
|
|
|
|
5% |
|
|
-15% |
|
|
|
|
YoY |
|
|
|
|
|
|
|
||
|
|
|
|
|
|
|
|
|
-25% |
|
|
|
|
10% |
|
|
07/09/2018 |
08/06/2018 |
09/04/2018 |
10/02/2018 |
10/30/2018 |
|
|
Crude Oil WTI ($/bbl) YoY chg. LHS
|
100% |
YoY CPG Relative Price Performance vs. S&P - RHS |
-30% |
S&P |
||
|
|
|||||
chg.YoY($/bbl)WTIOilCrude |
90% |
|
|
|
-25% |
PerformancePriceRelativeCPGvs. |
20% |
|
|
|
|||
|
|
|
|
|||
|
80% |
|
|
|
-20% |
|
|
70% |
|
|
|
|
|
|
|
|
|
|
|
|
|
60% |
|
|
|
-15% |
|
|
|
|
|
|
|
|
|
50% |
|
|
|
-10% |
|
|
40% |
|
|
|
-5% |
|
|
|
|
|
|
|
|
|
30% |
|
|
|
0% |
|
|
|
|
|
|
|
|
|
10% |
|
|
|
5% |
YoY |
|
0% |
|
|
|
10% |
|
|
03/02/2010 |
03/30/2010 |
04/28/2010 |
05/26/2010 |
|
|
|
20% |
|
|
Crude Oil WTI ($/bbl) YoY chg. LHS |
|
|
|
|
-20% |
|
|||||||
|
10% |
|
|
YoY CPG Relative Price Performance vs. S&P - RHS |
|
|
S&P |
||||||||||
|
|
|
|
|
|
|
|
|
|
|
|
|
|
|
-15% |
||
|
|
|
|
|
|
|
|
|
|
|
|
|
|
|
|
||
|
|
|
|
|
|
|
|
|
|
|
|
|
|
|
|
PerformancePriceRelativeCPGvs. |
|
chg.YoY($/bbl)WTIOilCrude |
0% |
|
|
|
|
|
|
|
|
|
|
|
|
|
|
-10% |
|
-10% |
|
|
|
|
|
|
|
|
|
|
|
|
|
|
|||
|
|
|
|
|
|
|
|
|
|
|
|
|
|
|
|
||
|
|
|
|
|
|
|
|
|
|
|
|
|
|
|
|
|
|
|
-20% |
|
|
|
|
|
|
|
|
|
|
|
|
|
|
-5% |
|
|
-30% |
|
|
|
|
|
|
|
|
|
|
|
|
|
|
0% |
|
|
-40% |
|
|
|
|
|
|
|
|
|
|
|
|
|
|
5% |
|
|
-50% |
|
|
|
|
|
|
|
|
|
|
|
|
|
|
|
|
|
|
|
|
|
|
|
|
|
|
|
|
|
|
|
|
|
|
|
-60% |
|
|
|
|
|
|
|
|
|
|
|
|
|
|
10% |
|
|
|
|
|
|
|
|
|
|
|
|
|
|
|
|
|
|
|
|
-70% |
|
|
|
|
|
|
|
|
|
|
|
|
|
|
15% |
YoY |
|
07/01/2014 |
07/30/2014 |
08/27/2014 |
09/25/2014 |
10/23/2014 |
11/20/2014 |
12/19/2014 |
01/21/2015 |
02/19/2015 |
03/19/2015 |
04/17/2015 |
05/15/2015 |
06/15/2015 |
07/14/2015 |
08/11/2015 |
|
|
|
135% |
|
|
|
Crude Oil WTI ($/bbl) YoY chg. LHS |
|
|
|
|
0% |
|
||||||
|
|
|
|
YoY CPG Relative Price Performance vs. S&P - RHS |
|
S&P |
|||||||||||
|
|
|
|
|
|
|
|||||||||||
|
|
|
|
|
|
|
|
|
|
|
|
|
|
|
|
5% |
|
|
115% |
|
|
|
|
|
|
|
|
|
|
|
|
|
|
PerformancePriceRelativeCPGvs. |
|
YoY($/bbl)WTIOilCrudechg. |
|
|
|
|
|
|
|
|
|
|
|
|
|
|
|
||
95% |
|
|
|
|
|
|
|
|
|
|
|
|
|
|
10% |
||
|
|
|
|
|
|
|
|
|
|
|
|
|
|
|
|
||
|
|
|
|
|
|
|
|
|
|
|
|
|
|
|
|
|
|
|
75% |
|
|
|
|
|
|
|
|
|
|
|
|
|
|
15% |
|
|
|
|
|
|
|
|
|
|
|
|
|
|
|
|
|
|
|
|
|
|
|
|
|
|
|
|
|
|
|
|
|
|
|
20% |
|
|
55% |
|
|
|
|
|
|
|
|
|
|
|
|
|
|
25% |
|
|
|
|
|
|
|
|
|
|
|
|
|
|
|
|
|
|
|
|
35% |
|
|
|
|
|
|
|
|
|
|
|
|
|
|
30% |
|
|
|
|
|
|
|
|
|
|
|
|
|
|
|
|
|
|
|
|
15% |
|
|
|
|
|
|
|
|
|
|
|
|
|
|
35% |
YoY |
|
|
|
|
|
|
|
|
|
|
|
|
|
|
|
|
||
|
|
|
|
|
|
|
|
|
|
|
|
|
|
|
|
|
|
|
-5% |
|
|
|
|
|
|
|
|
|
|
|
|
|
|
40% |
|
|
06/09/2008 |
|
07/08/2008 |
|
08/05/2008 |
|
09/03/2008 |
|
10/01/2008 |
|
|
||||||
CPG companies include: PG, KMB, CHD, CLX, CL, and PEP. Changes based on daily price movements. Source: FactSet, Company filings, Deutsche Bank analysis
Deutsche Bank |
Steve Powers | (+1) 212 250-5480 | stephen.powers@db.com |
|
Research |
Faiza Alwy | (+1) 212 250-7611 | faiza.alwy@db.com |
13 |
vk.com/id446425943
Where do we go from here?
Looking further ahead, pricing tends to ultimately follow oil as well…
Will current efforts to take price ultimately be dealt back?
We see the possibility of 1-2 “perfect” quarters next year if pricing sticks while lower commodities flow through, but would ultimately expect outsized deflationary benefits to be dealt back through lower pricing and/or higher promotions
Typically, a 3 to 4-quarter lag between oil price change and pricing |
32% of quarterly pricing can be explained by YoY changes in quarterly |
|
oil price changes (since 2005) on a 4-quarter lag |
||
|
YoY Oil Price % Ch, 4-quarter lag
WTI Crude % Ch YoY (LHS) |
|
|
|
Average CPG Pricing (RHS) |
|
|
7.0% |
|
|
|
|
||||
|
|
|
|
|
|
|
|
8.0% |
|
|
6.0% |
|
|
y = 0.0277x + 0.0072 |
|
130% |
|
|
|
|
|
|
|
|
|
|
|
|
|
R² = 0.322 |
|
|
|
|
|
|
|
|
|
|
|
5.0% |
|
|
|
||
|
|
|
|
|
|
|
|
|
|
|
|
|
|
|
|
80% |
|
|
|
|
|
|
|
6.0% |
(%) |
Pricing(%) |
4.0% |
|
|
|
|
|
|
|
|
|
|
|
|
PricingCPG |
3.0% |
|
|
|
|
||
|
|
|
|
|
|
|
|
4.0% |
|
|
|
|
|||
|
|
|
|
|
|
|
|
|
|
|
|
|
|
||
|
|
|
|
|
|
|
|
|
|
2.0% |
|
|
|
|
|
30% |
|
|
|
|
|
|
|
|
|
|
|
|
|
|
|
|
|
|
|
|
|
|
2.0% |
|
|
1.0% |
|
|
|
|
|
|
|
|
|
|
|
|
|
Average |
|
|
|
|
|
||
(20%) |
|
|
|
|
|
|
|
0.0% |
|
0.0% |
|
|
|
|
|
|
|
|
|
|
|
|
|
|
|
|
|
|
|
||
|
|
|
|
|
|
|
|
|
|
(1.0%) |
|
|
|
|
|
|
|
|
|
|
|
|
|
|
|
|
|
|
|
|
|
(70%) |
|
|
|
|
|
|
|
(2.0%) |
|
|
(2.0%) |
|
|
|
|
|
|
|
|
|
|
|
|
|
(75%) |
(25%) |
25% |
75% |
125% |
||
1Q05 |
4Q05 3Q06 2Q07 1Q08 4Q08 3Q09 2Q10 1Q11 |
4Q11 |
3Q12 |
2Q13 |
1Q14 4Q14 3Q15 |
2Q16 1Q17 |
4Q17 |
3Q18 |
|
|
|||||
|
|
|
YoY change in crude oil prices |
|
|
||||||||||
CPG companies include: PG, KMB, CHD (since 1Q10), and CLX (since 3Q06) based on data available. CPG Price=price + mix where available Source: FactSet, Company filings, Deutsche Bank analysis
Deutsche Bank |
Steve Powers | (+1) 212 250-5480 | stephen.powers@db.com |
|
Research |
Faiza Alwy | (+1) 212 250-7611 | faiza.alwy@db.com |
14 |

vk.com/id446425943
Where do we go from here?
Will the retailer détente continue?
Macro Backdrop
“New” Retail
Considerations
(e.g., Amazon,
Aldi/Lidl)
Traditional Retail
Considerations
(e.g., Walmart,
Kroger)
CPG
Fundamentals
End of 2017 /
Early 2018
•Late-cycle, slow-growth recovery
•Still-muted consumer demand
•Minimal/moderate inflation (some lingering concerns even of deflation)
•AMZN customer acquisition-focused
•Goal to “win” in grocery—with “winning” defined by market share
•Steep discounting / aggressive pricing
•Deep price cuts / heavy promotions to keep up with AMZN/hard discounters
•Elevated focus on private label
•Intensified scrutiny of branded CPG assortment and service levels
•Minimal CPG pricing power
•Margin pressure as a result of price cuts, rising cost inflation
•Shelf-space challenges
•“Balance of Power” shifting to retailers
Mid-2018 to Today |
Looking Ahead |
•Rising signs of inflation & recent rollover in oil prices
•Low unemployment, growing consumer confidence (partly aided by tax cuts)
•Tax cuts aid corporate P&Ls
•De-emphasis of pure customer acquisition at AMZN
•More focus on profitability; moderation in extreme pricing
•Slower hard discounter expansion
•Traffic/demand/SSS improving
•Easing of “new” competition; relative equilibrium reached
•Relatively less competitive pressure allowing for pockets of price increases
•Less overt pressure from retailers
•Organic growth showing signs of improvement (especially in US)
•Hopes of future GM stabilization/ expansion given plans to raise price
•Potential slowdown in consumer confidence and economic growth
•Potential difficulty lapping the 2018 tax cut
•Potential reacceleration of elevated competition
•With slowing demand; focus again could turn to market share wins
•AMZN to reinvest in price again?
•Potential return to more competitive dynamic if aggregate demand slows or AMZN reasserts itself
•Potential re-emphasis on pricing
•Growth/margin disappointment if:
•Consumer demand slows
•Oil/commodities re-inflate
•Rekindled pressure from retail competition erodes pricing power
Source: Deutsche Bank analysis
See also: AMZN/Retailers vs. CPG Suppliers : Equilibrium at Risk? (Oct 29, 2018)
Deutsche Bank |
Steve Powers | (+1) 212 250-5480 | stephen.powers@db.com |
|
Research |
Faiza Alwy | (+1) 212 250-7611 | faiza.alwy@db.com |
15 |

vk.com/id446425943
Where do we go to from here?
Looking forward to 2019, we remain cognizant/wary of further potential downside to risk assets (and relative upside to
Staples), yet we remain more optimistic on the ability of global demand to persist, more cautious on the ability of CPG stocks to over-deliver vs. expectations, and thus more cautious on CPG stocks in general (particularly within HPC)
Most Bearish for Economy/Market |
Most Bullish for Economy/Market |
|
Most Bullish for Staples Broadly (on a relative basis) |
Most Bearish for Staples Broadly (on a relative basis) |
|
|
|
|
|
|
|
|
|
DB Base Case |
Recession Fears
Build, Defensive Bid
Persists Unabated
15%
Aforementioned macro headwinds continue to stoke fears (e.g., trade wars, excessive interest rate hikes, BREXIT, etc.)
CPG fundamental pros/cons likely to matter less than the market’s desire simply to “de-risk” and continue to pursue safety
Economic Growth
Slows, CPG
Fundamentals Hold
Up/Improve
25%
Perceived macro risks become more measured, but headwinds pressure economic growth (more cyclical sectors especially)
CPG companies able to outperform with more stable late-cycle fundamentals, aided by recent pricing & cost deflation (helping to rebuild margins)
Economic Growth
Slows Less Than
Feared, CPG
Fundamentals
Underwhelm
50%
Economy proves more resilient than feared (perhaps aided by more nuanced/more accommodating Fed Policy and/or a thawing of global trade and geopolitical tension)
CPG fundamentals fall short of expectations (e.g., stagnating or faltering organic growth, commodity reinflation, unrealized pricing power, and/or FX pressure)
Economic Growth
Proves Resilient,
Risk Appetite Fully
Reemerges
10%
Market shrugs off recent macro concerns as merely a “correction” in an otherwise-sustained bull market
CPG fundamental pros/cons likely to matter less than the market’s desire simply to “re-risk” and pursue growth
Source: Deutsche Bank analysis
Deutsche Bank |
Steve Powers | (+1) 212 250-5480 | stephen.powers@db.com |
|
Research |
Faiza Alwy | (+1) 212 250-7611 | faiza.alwy@db.com |
16 |
vk.com/id446425943
Top Picks:
Growth Scenarios – EL, MNST, STZ; Core CPG – KO, IFF, TAP, MO
|
|
Recession Fears |
Economic Growth Slows, CPG |
Economic Growth Slows Less |
Economic Growth Proves Resilient, |
|
|
|
|
|
Build, Defensive Bid Persists |
Than Feared, CPG Fundamentals |
|
||||
|
|
Unabated |
Fundamentals Hold Up/Improve |
Underwhelm |
Risk Appetite Fully Reemerges |
|
||
|
|
|
|
|
|
|
||
|
|
|
|
|
|
|
|
|
Top picks - likely to |
KO |
|
|
|
|
|
Color Key: |
|
work across / |
IFF |
|
|
|
|
|
|
|
|
|
|
|
|
|
|||
independent of |
TAP |
|
|
|
|
|
|
|
|
|
|
|
|
|
|
||
multiple macro |
|
|
|
|
|
|
|
|
scenarios |
MO |
|
|
|
|
|
|
|
|
|
|
|
|
|
|
|
|
|
|
|
|
|
|
|
|
|
Top growth picks - |
EL |
|
|
|
|
|
|
|
likely to work best if |
MNST |
|
|
|
|
|
|
|
economic growth |
|
|
|
|
|
|
|
|
|
|
|
|
|
|
|
|
|
resilient |
STZ |
|
|
|
|
|
|
|
|
|
|
|
|
|
|
|
|
|
|
|
|
|
|
|
|
|
Stocks to work best |
NUS |
|
|
|
|
|
|
|
if economic growth |
BF.b |
|
|
|
|
|
|
|
|
|
|
|
|
|
|
||
resilient |
|
|
|
|
|
|
|
|
|
|
|
|
|
|
|
|
|
|
PG |
|
|
|
|
|
|
|
|
KMB |
|
|
|
|
|
|
|
Stocks likely to work |
CHD |
|
|
|
|
|
|
|
|
|
|
|
|
|
|
|
|
best if defensive bid |
CLX |
|
|
|
|
|
|
|
persists |
CCEP |
|
|
|
|
|
|
|
|
|
|
|
|
|
|
|
|
|
CL |
|
|
|
|
|
|
|
|
|
|
|
|
|
|
|
|
|
PEP |
|
|
|
|
|
|
|
|
|
|
|
|
|
|
|
|
|
|
|
|
|
|
|
|
|
|
ENR |
|
|
|
|
|
|
|
|
EPC |
|
|
|
|
|
|
|
Company-specific |
AVP |
|
|
|
|
|
|
|
COTY |
|
|
|
|
|
|
|
|
stories with DB view |
|
|
|
|
|
|
|
|
|
|
|
|
|
|
|
|
|
cautious/neutral - |
SPB |
|
|
|
|
|
|
|
some macro |
NWL |
|
|
|
|
|
|
|
influence |
|
|
|
|
|
|
|
|
VVV |
|
|
|
|
|
|
|
|
|
|
|
|
|
|
|
|
|
|
COT |
|
|
|
|
|
|
|
|
KDP |
|
|
|
|
|
|
|
|
|
|
|
|
|
|
|
|
Most favorable scenario
Favorable scenario
Neutral scenario
Cautious scenario
Most cautious scenario
Source: Deutsche Bank analysis
Deutsche Bank |
Steve Powers | (+1) 212 250-5480 | stephen.powers@db.com |
|
Research |
Faiza Alwy | (+1) 212 250-7611 | faiza.alwy@db.com |
17 |

vk.com/id446425943
Where do we go from here?
PG may be the bellwether (as it has been thru 2018)
Favorable top-line in FY1Q (particularly in the US) due to:
i.A strong economic backdrop;
ii.A more stable retail environment; and
iii.Share gains in select unscanned channels (aided by promotion)
So, can PG's top-line strength continue (alongside presumed future margin improvement)?
Possibly…especially (i) if the U.S. retailer détente continues; and (ii) if U.S. economic strength remains robust
But if that is the market's base case, should not AMZN and the XRT have performed better of late relative to the XLP?
Caution: several instances in the last decade when PG has exceeded expectations in one quarter, only to disappoint down the road
Source: FactSet, Company filings and websites, Deutsche Bank analysis
Did PG’s 1Q19 US results benefit from a pull-forward of demand – e.g., from sizeable promotions (and double-digit growth) at Costco?
Promotion valid for purchases made 9/5/18 – 9/30/18 at Costco (In warehouse & online). Spend $100 (after discounts and before taxes) on select Procter & Gamble products and get a $25 Costco Cash Card by mail.
With cyclical/discretionary sectors underperforming recently amid fears of an economic peak, we note that P&G's organic growth is also somewhat cyclical…meaning it may be risky to extrapolate recent strength linearly
PG Quarterly Organic Growth
10.0%
8.0%
6.0%
4.0%
2.0%
0.0%
(2.0%)
1Q01 |
4Q01 |
3Q02 |
2Q03 |
1Q04 |
4Q04 |
3Q05 |
2Q06 |
1Q07 |
4Q07 |
3Q08 |
2Q09 |
1Q10 |
4Q10 |
3Q11 |
2Q12 |
1Q13 |
4Q13 |
3Q14 |
2Q15 |
1Q16 |
4Q16 |
3Q17 |
2Q18 |
1Q19 |
Deutsche Bank |
Steve Powers | (+1) 212 250-5480 | stephen.powers@db.com |
|
Research |
Faiza Alwy | (+1) 212 250-7611 | faiza.alwy@db.com |
18 |

vk.com/id446425943
Where do we go from here – Tobacco
Will FDA overhangs abate or entrench themselves?
FDA’s recent actions against e-vapor/JUUL generally favorable for incumbents (when viewed in a vacuum)
BUT the Agency’s parallel efforts against combustible menthol cigarettes carry negative risks (if successful)
Even though it’s unclear if FDA actions on menthol can be implemented quickly, the market is already pricing in the worst case scenario
For example, MO’s stock is already down ~18% since the FDA’s announcement—effectively commensurate with the percentage of MO’s profits represented by combustible menthol cigarettes/flavored cigars
BATS and MO account for just under 90% of US menthol volume…
Barring near-term volume declines accelerating materially below our modeled -5% normalized rate, we see underappreciated upside to the extent that either:
i.E-vapor limitations spur a temporary lift in combustible volumes
ii.E-vapor limitations ultimately expand further (following underwhelming reductions in youth participation, as determined by the FDA)
iii.PM/MO's pending IQOS PMTA/MRTP applications are approved and IQOS achieves commercial success in the US
iv.Menthol/nicotine reduction regulation is prolonged or made less absolute
…with BATS’s US portfolio more skewed to menthol relative to MO
Global Tobacco : New dbDIG Proprietary Survey Sheds Light on Potential FDA Actions (Nov 11, 2018);
Source: Nielsen, Company filings, Deutsche Bank analysis |
Altria : More Complicated, Yes. But Probably Overdone (Nov 16, 2018) |
||
Deutsche Bank |
Steve Powers | (+1) 212 250-5480 | stephen.powers@db.com |
|
|
Research |
Faiza Alwy | (+1) 212 250-7611 | faiza.alwy@db.com |
19 |
|