

DB U.S. Food_watermark
.pdfU.S. Food
vk.com/id446425943 |
|
|
|
|
Deutsche Bank |
|
|
|
|
Research |
|
|
|
|
North America |
|
Industry |
|
Date |
|
|
|||
United States |
|
U.S. Food |
|
15 November 2018 |
|
|
|
||
Consumer |
|
|
|
Industry Update |
Food |
|
|
|
|
|
|
|
|
|
Outperformance despite Downward Revisions
Sector outperforms despite abysmal Q3 results, FY’19 downward EPS revisions With continued monetary tightening likely in the U.S., growth in some emerging
markets under question, and ongoing heightened global geopolitical risk, we watched the U.S. Dollar strengthen, oil prices drop, and CPG stocks outperform the S&P throughout calendar Q3 results to the tune of ~900 bps. As risk appetite tilted toward “safety”, U.S. food earnings valuations crept on average to a 10% relative premium (the highest we’ve seen since January ’17 and vs. YTD ‘18 parity with the S&P) and sector beta dropped to ~25% vs. its ~60% three-year historical sector average. And this was all while 2/3 of our coverage universe missed Q3’18 EPS expectations, driven by gross and operating margin misses across ~90% and ~80% our coverage, respectively, and FY’19 consensus EPS forecasts were revised downward by an average of 5% across 80% of calendarcompany coverage. With sector sentiment low, consensus looking for only ~3% EPS growth in 2019 (or ~200 bps lower relative to July expectations), and equity valuations near their three-year relative premium average to the market, one could argue that food stocks could hold in through year-end, as 2019 sector earnings have already been de-risked, valuations aren’t yet through the roof, and market fear remains ever-present.
That being said, we remain cautious given the many fundamental (and welldocumented) pressures debilitating sector profit growth: cost inflation relative to pricing ability, ramped levels of brand building support vis-à-vis fewer incremental special-project savings, retailer competition and accelerated assortment changes, and more highly levered balance sheets. Just as we said ahead of Q3 results and we reiterate today, we see further margin risk to the space on average, and remain below FY’19 consensus operating margin for 2/3 of our coverage. For FY'19, we’re looking for 1.5% y/y organic sector sales growth, driven by 0.8% price and 0.7% volume. Excluding company periods significantly impacted by the e ects of acquisitions, we’re modeling ~2% sector gross profit growth, driven by top-line growth, the lapping of transportation cost headwinds, and mix benefits, and ~4% operating profit growth, as fewer SG&A-driven cost savings combined with higher rates of brand investment reduce the gross-to-operating-profit leverage equation. Our updated FY'19 sector EPS forecast is pointing to 3% EPS growth, as below- the-line items including the lapping of this year's tax benefit and incrementally higher interest expense cause a slight headwind for the group relative to FY'18.
Given the +200 bps of sector return over the past month, our NTM sector return outlook (ex-dividend) is pointing now to ~4%, although the dispersion
Rob Dickerson Research Analyst +1-212-250-2160
Matt Fishbein Research Associate +1-212-250-3551
Angeline Goh Research Associate +1-212-250-4515
Companies featured |
|
Campbell Soup |
Hold |
Company |
|
(CPB.N),USD39.25 |
|
General Mills (GIS.N),USD45.48 |
Hold |
Hain Celestial (HAIN.OQ),USD22.08 |
Buy |
Simply Good Foods (SMPL.OQ),USD19.61 Buy |
|
Hostess Brands (TWNK.OQ),USD11.21 |
Hold |
Flowers Foods (FLO.N),USD19.86 |
Hold |
Nomad Foods (NOMD.N),USD20.07 |
Buy |
Kraft Heinz (KHC.OQ),USD53.38 |
Buy |
The Hershey Company (HSY.N),USD109.14Hold |
|
Kellogg (K.N),USD63.42 |
Hold |
Mondelez International |
Buy |
(MDLZ.OQ),USD44.08 |
|
Conagra Brands (CAG.N),USD35.19 |
Buy |
Dean Foods (DF.N),USD6.00 |
Hold |
McCormick (MKC.N),USD148.21 |
Sell |
Smucker (SJM.N),USD113.83 |
Hold |
Source: Deutsche Bank |
|
Deutsche Bank Securities Inc. |
Distributed on: 15/11/2018 10:27:07 GMT |
Deutsche Bank does and seeks to do business with companies covered in its research reports. Thus, investors should be aware that the firm may have a conflict of interest that could a ect the objectivity of this report. Investors should consider this report as only a single factor in making their investment decision. DISCLOSURES AND ANALYST CERTIFICATIONS ARE LOCATED IN APPENDIX 1. MCI (P) 091/04/2018.
7T2se3r0Ot6kwoPa

vk.com/id446425943
15 November 2018 Food
U.S. Food
between potential winners and losers has widened, in our view. We continue to recommend the shares of Conagra Brands, Hain Celestial, Kraft Heinz, Nomad Foods, Mondelez International, and Simply Good Foods. Campbell Soup, Smucker, General Mills, and Conagra are next up in the earnings calendar.
Higher-than-expected brand investment, freight costs the common CQ3 themes Only three of the 10 companies under our coverage recently reporting Calendar
Q3 results posted EPS higher than expectations, including SMPL (CQ3 EPS came in 26% higher than our estimate, 18% higher than consensus), NOMD (+11% vs. DB, +12% vs. consensus), and MDLZ (+4% vs. DB, +3% vs. consensus). Companies under coverage reporting Q3 EPS the furthest below expectations were HAIN (22% below DB, 31% below consensus), FLO (12% below DB, 8% below consensus), and TWNK (10% below DB and consensus).
Regarding net sales relative to expectations, half of our CQ3-reporting covered companies delivered better-than-expected results. NOMD (+4% vs. DB, +3% consensus), SMPL (+3% DB), and K (+2% DB, +1% consensus) posted the best net sales results relative to expectations, while results from HAIN (5% below DB and consensus), FLO (1% below DB and consensus), and HSY (1% below DB and consensus) came in the furthest below expectations.
Only MDLZ beat both our and consensus expectations for gross profit and margin, with companies (again) generally pointing to higher-than-expected freight costs during the quarter. Four of the 10 companies beat our operating profit and margin expectations, including SMPL, HSY, MDLZ, and NOMD, while TWNK and FLO results came in among the furthest below expectations. As companies continue to reinvest savings back into their businesses, near-term operating profit expansion is likely limited, in our view.
Regional overview: Emerging markets growth a Q3 bright spot
Although growth in emerging markets has decelerated each year since 2012, it's still expected to contribute meaningfully to global food sales over the next three years, and was an evident positive contributor to Q3 net sales growth. Our rolled up CPG reported developed vs. emerging market organic sales analysis shows that developed markets grew 2.3% in Q3, a 70-bp acceleration sequentially on a two-year stacked basis, and that emerging markets grew 5.8% y/y, a 370-bp acceleration sequentially on a two-year stacked basis. Q3 commentary from our companies included:
■North America/United States – Some companies saw innovationand promotion-driven volume growth in N.A./U.S. during CQ3, including KHC and HSY, but organic growth in the region still seems dependent in the near-term on price/mix, as we saw with K and MDLZ. MDLZ, K, TWNK, and HSY all pointed to improved pricing in 2019 (and likely higher contributions by pricing to organic growth than we previously expected), despite price conversations linked to cost inflation becoming increasingly di cult to have with customers.
■Europe/United Kingdom – Unusually warm weather in E.U./U.K. aided some companies’ volume growth but were a headwind for others (including NOMD), while companies note that the pricing environment remains challenging.
■Latin America – Companies including HSY, K and MDLZ called out continued strong momentum in Mexico, with mixed results in Brazil
Page 2 |
Deutsche Bank Securities Inc. |

vk.com/id446425943
15 November 2018 Food
U.S. Food
(positive for K and KHC, negative for MDLZ, as multinationals look for early signs of a recovery) and Argentina (MDLZ managing to perform well for now, other multinationals pointing to severely impacted consumer demand).
■Asia/China – Strong growth for most companies, including HSY, K and MDLZ, driven by innovation and e-commerce.
■Other Emerging Markets – Continued growth in India for HSY, K, and MDLZ (volumeand innovation-driven) and in Russia for MDLZ (combination of volume and pricing), despite mixed commentary from multinationals on currency/inflation.
Deutsche Bank Securities Inc. |
Page 3 |

vk.com/id446425943
Q3’18 Results vs. DB Estimates and Consensus
Deutsche Bank |
Rob Dickerson, (+1) 212-250-2160, rob.dickerson@db.com |
4 |
|
|
Source: Deutsche Bank |
vk.com/id446425943
Q3’18 Results vs. DB Estimates and Consensus
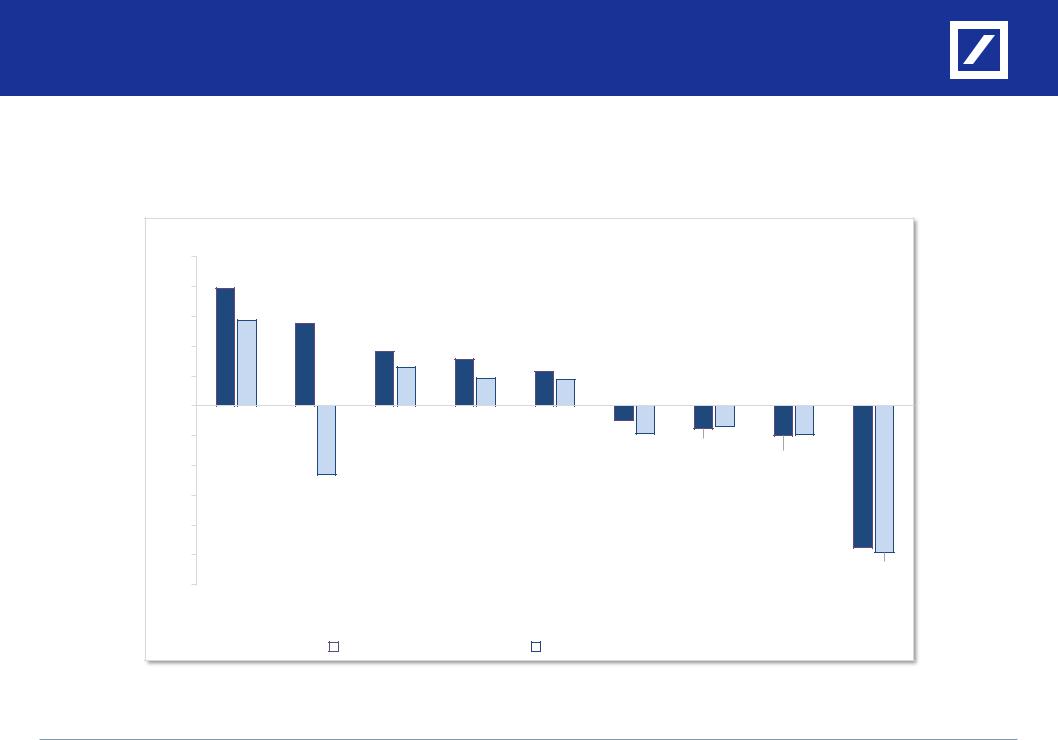
Only half of the 10 companies we cover that recently reported Q3 results posted better calendar Q3 net sales relative to our expectations and consensus
5% |
|
|
Q3'18A Net Sales vs. DB & Consensus |
|
|
||||
|
|
|
|
|
|
|
|
|
|
4% |
4.0% |
|
|
|
|
|
|
|
|
|
|
|
|
|
|
|
|
|
|
3% |
2.9% |
2.8% |
|
|
|
|
|
|
|
|
|
|
|
|
|
|
|
|
|
2% |
|
|
1.8% |
1.6% |
|
|
|
|
|
|
|
1.3% |
1.1%0.9% |
|
|
|
|
||
|
|
|
0.9% |
|
|
|
|
||
1% |
|
|
|
|
|
|
|
||
|
|
|
|
|
|
|
|
|
|
0% |
|
|
|
|
|
|
|
|
|
(1%) |
|
|
|
|
|
(0.5%) |
(0.7%) |
(1.0%) |
|
|
|
|
|
|
|
(0.9%) |
(0.8%) |
|
|
(2%) |
|
|
|
|
|
|
|
(1.0%) |
|
|
|
|
|
|
|
|
|
|
|
(3%) |
|
(2.3%) |
|
|
|
|
|
|
|
|
|
|
|
|
|
|
|
|
|
(4%) |
|
|
|
|
|
|
|
|
|
(5%) |
|
|
|
|
|
|
|
|
(4.8%)(4.9%) |
(6%) |
|
|
|
|
|
|
|
|
|
|
|
|
|
|
|
|
|
|
|
|
NOMD |
SMPL |
K |
TWNK |
KHC |
MDLZ |
HSY |
FLO |
HAIN |
|
Q3'18A vs. DB Q3'18E |
|
Q3'18A vs. Consensus Q3'18E |
|
|
||
|
|
Source: Deutsche Bank, company data, FactSet
Note: Data above calendarized based on latest reported fiscal quarter for each company
Not shown: Dean Foods (DF)
Deutsche Bank |
Rob Dickerson, (+1) 212-250-2160, rob.dickerson@db.com |
5 |
|
|
Source: Deutsche Bank |
vk.com/id446425943
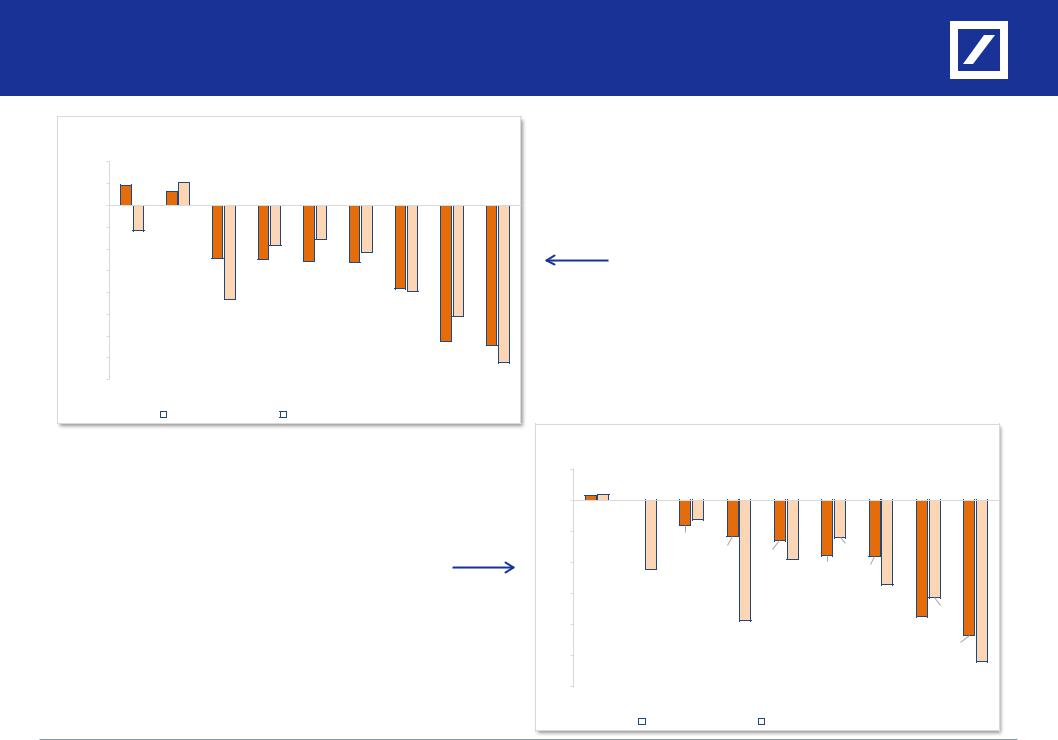
Q3’18 Results vs. DB Estimates and Consensus
|
|
Q3'18A Gross Margin vs. DB & Consensus |
|
|
||||||
100 bps |
|
|
52 |
|
|
|
|
|
|
|
50 bps |
47 |
32 |
|
|
|
|
|
|
|
|
|
|
|
|
|
|
|
|
|
||
0 bps |
|
|
|
|
|
|
|
|
|
|
(50 bps) |
|
|
|
|
|
|
|
|
|
|
(100 bps) |
(59) |
|
|
|
|
(78) |
|
|
|
|
|
|
|
|
(92) |
(107) |
|
|
|||
|
|
|
|
(122) |
|
|
|
|||
(150 bps) |
|
|
|
(124) |
(128) |
|
|
|||
|
|
|
(131) |
|
|
|
||||
(200 bps) |
|
|
|
|
|
|
|
(192) (197) |
|
|
|
|
|
|
(215) |
|
|
|
|
|
|
(250 bps) |
|
|
|
|
|
|
|
|
|
|
|
|
|
|
|
|
|
|
(255) |
|
|
(300 bps) |
|
|
|
|
|
|
|
|
|
|
|
|
|
|
|
|
|
|
|
|
|
(350 bps) |
|
|
|
|
|
|
|
|
(312) |
(321) |
|
|
|
|
|
|
|
|
|
||
(400 bps) |
|
|
|
|
|
|
|
|
|
(361) |
|
|
|
|
|
|
|
|
|
|
|
|
HAIN |
MDLZ |
FLO |
K |
HSY |
SMPL |
NOMD |
KHC |
TWNK |
|
|
Q3'18A vs. DB Q3'18E |
|
Q3'18A vs. Consensus Q3'18E |
|
|
||
|
|
…On average, gross profit came in ~3.5% below our expectations and ~4.5% below consensus, with companies (again) generally pointing to higher-than- expected freight costs in the quarter, which adversely impacted gross profit results…
Source: Deutsche Bank, company data, FactSet
Note: Data above calendarized based on latest reported fiscal quarter for each company Not shown: Dean Foods (DF)
…Gross margin on average was ~150 bps lower relative to our expectations and consensus…
Q3'18A Gross Profit vs. DB & Consensus
2% |
|
|
|
|
|
|
|
|
0.3% 0.3% |
0.0% |
|
|
|
|
|
|
|
0% |
|
|
|
|
|
|
|
|
(2%) |
|
(1.3%) |
|
|
|
|
|
|
|
|
(1.6%) |
|
|
(2.4%) |
|
|
|
(4%) |
|
|
(2.3%) |
(2.6%) |
|
|
||
|
|
|
|
|
|
|
||
|
|
|
(3.8%)(3.6%) |
(3.6%) |
|
|
||
|
(4.4%) |
|
|
|
|
|||
|
|
|
|
|
|
|
|
|
(6%) |
|
|
|
|
|
(5.4%) |
|
|
(8%) |
|
|
|
|
|
|
(6.3%) |
|
|
|
(7.8%) |
|
|
(7.5%) |
|
||
|
|
|
|
|
|
|
||
(10%) |
|
|
|
|
|
|
|
(8.7%) |
|
|
|
|
|
|
|
|
|
|
|
|
|
|
|
|
|
(10.4%) |
(12%) |
|
|
|
|
|
|
|
|
MDLZ |
SMPL |
K |
HAIN |
NOMD |
HSY |
FLO |
KHC |
TWNK |
|
Q3'18A vs. DB Q3'18E |
|
Q3'18A vs. Consensus Q3'18E |
|
|
||
|
|
Deutsche Bank |
Rob Dickerson, (+1) 212-250-2160, rob.dickerson@db.com |
6 |
|
|
Source: Deutsche Bank |
vk.com/id446425943
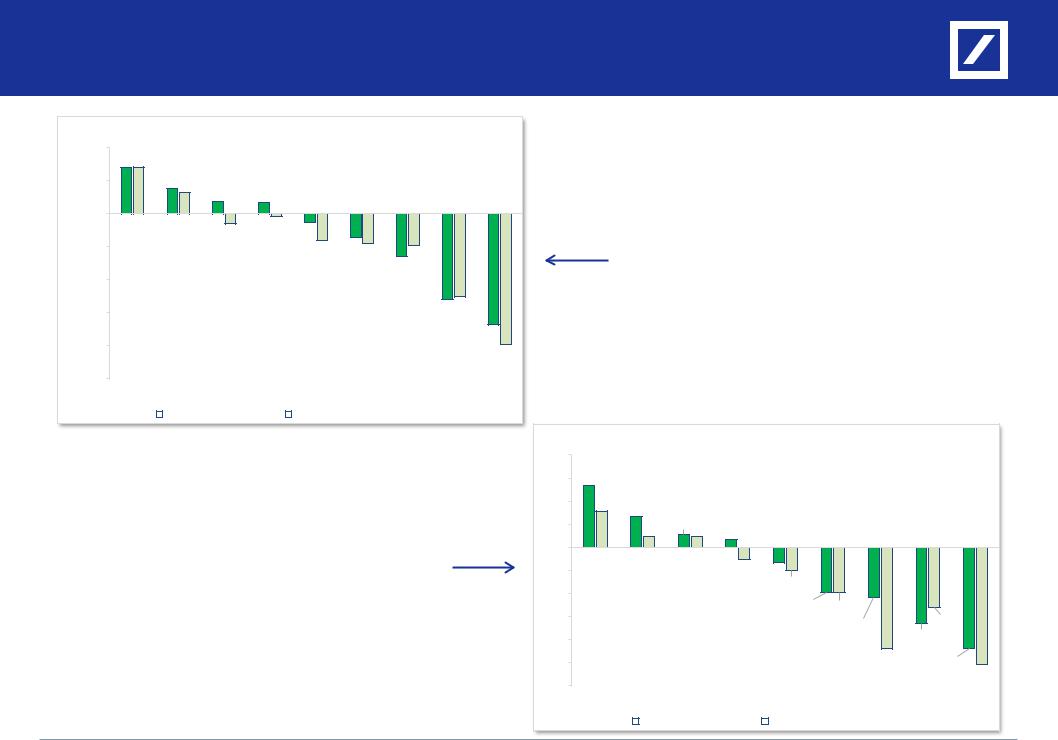
Q3’18 Results vs. DB Estimates and Consensus
200 bps |
|
Q3'18A Operating Margin vs. DB & Consensus |
|
|
|||||
141 |
|
|
|
|
|
|
|
|
|
140 |
|
|
|
|
|
|
|
|
|
100 bps |
|
76 65 |
37 |
34 |
|
|
|
|
|
|
|
|
|
|
|
|
|
||
0 bps |
|
|
|
|
|
|
|
|
|
|
|
|
(30) |
(8) |
(25) |
|
|
|
|
(100 bps) |
|
|
|
|
|
|
|
||
|
|
|
|
(81) |
(72)(90) |
(96) |
|
|
|
|
|
|
|
|
|
|
|||
(200 bps) |
|
|
|
|
|
|
(129) |
|
|
|
|
|
|
|
|
|
|
|
|
(300 bps) |
|
|
|
|
|
|
|
(259)(252) |
|
(400 bps) |
|
|
|
|
|
|
|
|
(336) |
|
|
|
|
|
|
|
|
(396) |
|
|
|
|
|
|
|
|
|
|
|
(500 bps) |
|
|
|
|
|
|
|
|
|
SMPL |
HSY |
MDLZ |
NOMD |
HAIN |
K |
FLO |
KHC |
TWNK |
|
|
Q3'18A vs. DB Q3'18E |
|
Q3'18A vs. Consensus Q3'18E |
|
|
||
|
|
…Only 4 out of the 10 companies reported operating profit ahead of our expectations, including Hershey and Mondelez. As companies continue to reinvest savings back into their businesses, near-term operating profit expansion is likely limited…
Source: Deutsche Bank, company data, FactSet
Note: Data above calendarized based on latest reported fiscal quarter for each company Not shown: Dean Foods (DF)
…Given higher levels of reinvestment, operating margin on average came in ~60 bps below our expectations and ~80 bps below consensus…
Q3'18A Operating Profit vs. DB & Consensus
20% |
|
|
|
|
|
|
|
|
|
15% |
13.3% |
|
|
|
|
|
|
|
|
10% |
7.8% |
6.6% |
|
|
|
|
|
|
|
|
|
|
|
|
|
|
|
||
5% |
|
2.3% |
2.7%2.2% |
1.7% |
|
|
|
|
|
0% |
|
|
|
|
|
|
|
|
|
(5%) |
|
|
|
(2.7%) (3.3%) |
|
|
|
|
|
(10%) |
|
|
|
|
(5.0%) |
|
|
|
|
|
|
|
|
|
|
|
|
|
|
(15%) |
|
|
|
|
(9.8%) |
(9.8%) |
|
|
|
|
|
|
|
|
|
(10.9%) |
(12.9%) |
||
|
|
|
|
|
|
|
|||
|
|
|
|
|
|
|
(16.4%) |
|
|
(20%) |
|
|
|
|
|
|
|
|
|
|
|
|
|
|
|
|
|
|
|
(25%) |
|
|
|
|
|
|
(22.0%) |
(21.8%) |
|
|
|
|
|
|
|
|
|
||
(30%) |
|
|
|
|
|
|
|
|
(25.4%) |
|
|
|
|
|
|
|
|
|
|
|
SMPL |
NOMD |
HSY |
MDLZ |
K |
KHC |
HAIN |
FLO |
TWNK |
|
Q3'18A vs. DB Q3'18E |
|
Q3'18A vs. Consensus Q3'18E |
|
|
||
|
|
Deutsche Bank |
Rob Dickerson, (+1) 212-250-2160, rob.dickerson@db.com |
7 |
|
|
Source: Deutsche Bank |
vk.com/id446425943
Q3’18 Results vs. DB Estimates and Consensus
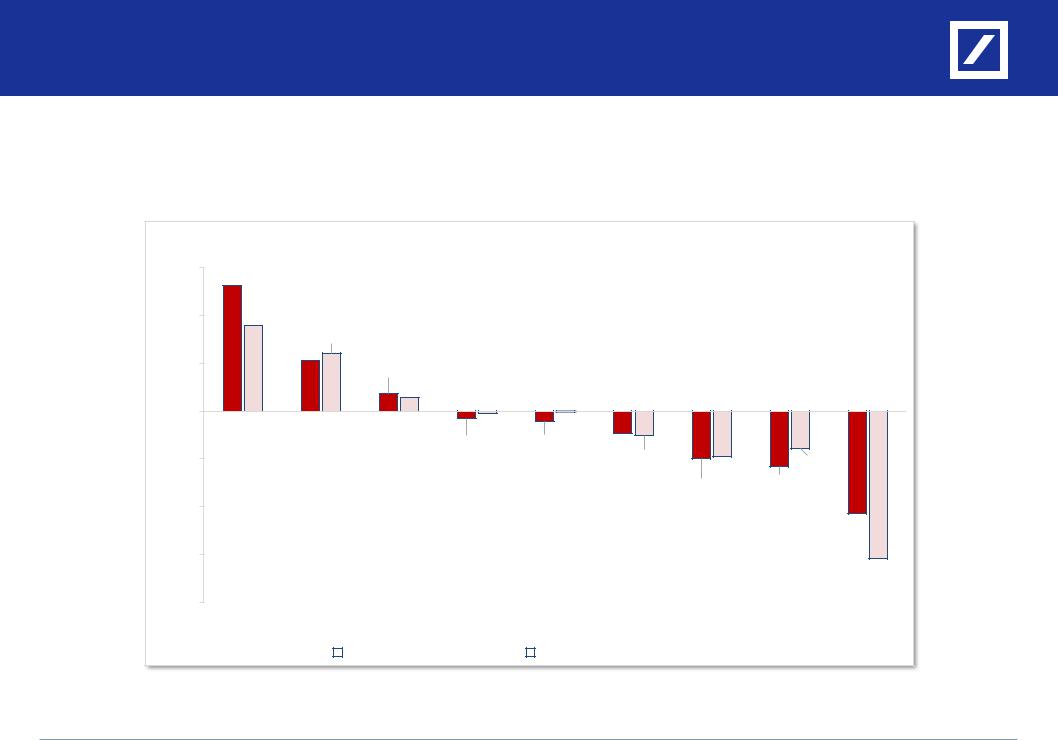
…Only 3 of the 10 companies under our coverage that recently reported Q3 results posted better-than-expected EPS relative to our expectations/consensus
(one being ~$1.5bn-market-cap SMPL, and one being zero-U.S.-revenue-exposure NOMD)…
Q3'18A EPS vs. DB & Consensus
30% |
26.2% |
|
|
|
|
|
|
|
|
|
|
|
|
|
|
|
|
|
|
20% |
17.9% |
|
|
|
|
|
|
|
|
10% |
|
10.5%12.1% |
|
|
|
|
|
|
|
|
|
3.7% |
|
|
|
|
|
|
|
|
|
|
|
|
|
|
|
|
|
|
|
|
2.8% |
|
|
|
|
|
|
0% |
|
|
|
(0.5%) |
(0.2%) |
|
|
|
|
|
|
|
|
|
|
|
|
||
(10%) |
|
|
|
(1.6%) |
(2.1%) |
(4.6%) |
|
|
|
|
|
|
|
|
(5.1%) |
(9.6%) |
(7.9%) |
||
|
|
|
|
|
|
|
|||
|
|
|
|
|
|
|
(11.6%) |
|
|
(20%) |
|
|
|
|
|
|
(9.9%) |
|
|
|
|
|
|
|
|
|
|
|
|
|
|
|
|
|
|
|
|
|
(21.5%) |
(30%) |
|
|
|
|
|
|
|
|
(30.9%) |
|
|
|
|
|
|
|
|
|
|
(40%) |
|
|
|
|
|
|
|
|
|
|
SMPL |
NOMD |
MDLZ |
K |
HSY |
KHC |
TWNK |
FLO |
HAIN |
|
Q3'18A vs. DB Q3'18E |
|
Q3'18A vs. Consensus Q3'18E |
|
|
||
|
|
Source: Deutsche Bank, company data, FactSet
Note: Data above calendarized based on latest reported fiscal quarter for each company
Not shown: Dean Foods (DF)
Deutsche Bank |
Rob Dickerson, (+1) 212-250-2160, rob.dickerson@db.com |
8
Source: Deutsche Bank

vk.com/id446425943
FY’19 EPS Estimates: Before and After Q3’18 Results
|
FY'19 |
FY'19 |
|
|
FY'19 |
FY'19 |
|
|
Company Name |
DB Estimate |
DB Estimate |
|
|
Consensus |
Consensus |
|
|
Before |
After |
$ Delta |
% Delta |
Before |
After |
$ Delta |
% Delta |
|
Campbell Soup |
$2.40 |
$2.40 |
$0.00 |
0% |
$2.44 |
$2.42 |
($0.02) |
(1%) |
|
|
|
|
|
|
|
|
|
Conagra Brands |
$2.15 |
$2.10 |
($0.05) |
(2%) |
$2.17 |
$2.17 |
$0.00 |
0% |
|
|
|
|
|
|
|
|
|
Dean Foods |
$0.64 |
$0.35 |
($0.29) |
(45%) |
$0.57 |
$0.18 |
($0.39) |
(68%) |
|
|
|
|
|
|
|
|
|
Flowers Foods |
$1.09 |
$0.98 |
($0.11) |
(10%) |
$1.08 |
$0.97 |
($0.11) |
(10%) |
|
|
|
|
|
|
|
|
|
General Mills |
$3.05 |
$3.05 |
$0.00 |
0% |
$3.06 |
$3.06 |
($0.00) |
(0%) |
|
|
|
|
|
|
|
|
|
Hain Celestial |
$1.30 |
$1.10 |
($0.20) |
(15%) |
$1.23 |
$1.18 |
($0.06) |
(5%) |
|
|
|
|
|
|
|
|
|
Hershey |
$5.72 |
$5.75 |
$0.03 |
1% |
$5.63 |
$5.65 |
$0.02 |
0% |
|
|
|
|
|
|
|
|
|
Hostess Brands |
$0.67 |
$0.65 |
($0.02) |
(3%) |
$0.69 |
$0.65 |
($0.04) |
(6%) |
|
|
|
|
|
|
|
|
|
Kellogg |
$4.65 |
$4.35 |
($0.30) |
(6%) |
$4.71 |
$4.42 |
($0.29) |
(6%) |
|
|
|
|
|
|
|
|
|
Kraft Heinz |
$3.90 |
$3.90 |
$0.01 |
0% |
$3.86 |
$3.76 |
($0.10) |
(3%) |
|
|
|
|
|
|
|
|
|
McCormick |
$5.30 |
$5.30 |
$0.00 |
0% |
$5.38 |
$5.39 |
$0.01 |
0% |
|
|
|
|
|
|
|
|
|
Mondelez |
$2.50 |
$2.52 |
$0.02 |
1% |
$2.51 |
$2.49 |
($0.02) |
(1%) |
|
|
|
|
|
|
|
|
|
Nomad Foods |
€ 1.30 |
€ 1.28 |
(€ 0.02) |
(1%) |
€ 1.29 |
€ 1.30 |
€ 0.00 |
0% |
|
|
|
|
|
|
|
|
|
Simply Good Foods |
$0.60 |
$0.60 |
$0.01 |
1% |
$0.60 |
$0.58 |
($0.02) |
(3%) |
|
|
|
|
|
|
|
|
|
Smucker |
$8.30 |
$8.30 |
$0.00 |
0% |
$8.38 |
$8.37 |
($0.01) |
(0%) |
Mean |
|
|
|
(3%) |
|
|
|
(2%) |
Y/Y Growth |
7.9% |
3.3% |
|
|
7.9% |
5.1% |
|
|
|
|
|
|
|
|
|
|
|
Source: Deutsche Bank, company data, FactSet
Notes: Kellogg “DB Estimate After” EPS, our EPS estimate following the company’s Q3 results, was updated following the company’s investor event on 11/13/18; “Mean % Delta” excludes Dean Foods
Deutsche Bank |
Rob Dickerson, (+1) 212-250-2160, rob.dickerson@db.com |
9 |
|
|
Source: Deutsche Bank |

vk.com/id446425943
DB Estimates vs. Consensus: FY’19 After Q3’18 Results
FY'19E |
|
FY'19 Net Sales |
|
|
FY'19 Gross Profit |
|
FY'19 Gross Margin |
|
||||
|
Net Sales |
Net Sales |
Delta vs. |
% Delta vs. |
Gross Profit |
Gross Profit |
Delta vs. |
% Delta vs. |
Gross Margin |
Gross Margin |
|
Delta vs. |
Company Name |
DB Estimate |
Consensus |
Consensus |
Consensus |
DB Estimate |
Consensus |
Consensus |
Consensus |
DB Estimate |
Consensus |
|
Consensus |
Campbell Soup |
$9,131 |
$9,876 |
($746) |
(8%) |
$2,858 |
$3,111 |
($253) |
(8%) |
31.3% |
31.5% |
|
(20 bps) |
|
|
|
|
|
|
|
|
|
|
|
|
|
Conagra Brands |
$9,807 |
$9,724 |
$83 |
1% |
$2,913 |
$2,858 |
na |
na |
29.7% |
29.4% |
|
31 bps |
|
|
|
|
|
|
|
|
|
|
|
|
|
Dean Foods |
$7,470 |
$7,615 |
($145) |
(2%) |
$1,600 |
$1,647 |
($46) |
(3%) |
21.4% |
21.6% |
|
(20 bps) |
|
|
|
|
|
|
|
|
|
|
|
|
|
Flowers Foods |
$4,060 |
$4,018 |
$42 |
1% |
$1,842 |
$1,923 |
($82) |
(4%) |
45.4% |
47.9% |
|
(251 bps) |
|
|
|
|
|
|
|
|
|
|
|
|
|
General Mills |
$17,094 |
$17,093 |
$0 |
0% |
$5,742 |
$5,823 |
($81) |
(1%) |
33.6% |
34.1% |
|
(47 bps) |
|
|
|
|
|
|
|
|
|
|
|
|
|
Hain Celestial |
$2,443 |
$2,482 |
($39) |
(2%) |
$538 |
$541 |
($3) |
(1%) |
22.0% |
21.8% |
|
24 bps |
|
|
|
|
|
|
|
|
|
|
|
|
|
Hershey |
$7,990 |
$7,947 |
$43 |
1% |
$3,561 |
$3,562 |
($0) |
(0%) |
44.6% |
44.8% |
|
(24 bps) |
|
|
|
|
|
|
|
|
|
|
|
|
|
Hostess Brands |
$858 |
$877 |
($19) |
(2%) |
$282 |
$309 |
($26) |
(9%) |
32.9% |
35.2% |
|
(229 bps) |
|
|
|
|
|
|
|
|
|
|
|
|
|
Kellogg |
$13,781 |
$13,783 |
($1) |
(0%) |
$4,897 |
$4,925 |
($28) |
(1%) |
35.5% |
35.7% |
|
(20 bps) |
|
|
|
|
|
|
|
|
|
|
|
|
|
Kraft Heinz |
$26,700 |
$26,614 |
$86 |
0% |
$9,568 |
$9,564 |
$4 |
0% |
35.8% |
35.9% |
|
(10 bps) |
|
|
|
|
|
|
|
|
|
|
|
|
|
McCormick |
$5,584 |
$5,646 |
($62) |
(1%) |
$2,477 |
$2,502 |
($25) |
(1%) |
44.4% |
44.3% |
|
5 bps |
|
|
|
|
|
|
|
|
|
|
|
|
|
Mondelez |
$25,862 |
$25,987 |
($125) |
(0%) |
$10,359 |
$10,463 |
($104) |
(1%) |
40.1% |
40.3% |
|
(21 bps) |
|
|
|
|
|
|
|
|
|
|
|
|
|
Nomad Foods |
€ 2,313 |
€ 2,298 |
€ 14 |
1% |
€ 717 |
€ 717 |
€ 0 |
0% |
31.0% |
31.2% |
|
(18 bps) |
|
|
|
|
|
|
|
|
|
|
|
|
|
Simply Good Foods |
$474 |
$476 |
($2) |
(0%) |
$216 |
$226 |
($10) |
(4%) |
45.5% |
47.5% |
|
(198 bps) |
|
|
|
|
|
|
|
|
|
|
|
|
|
Smucker |
$7,883 |
$7,908 |
($25) |
(0%) |
$3,010 |
$2,999 |
$11 |
0% |
38.2% |
37.9% |
|
26 bps |
Mean |
|
|
|
(1%) |
|
|
|
(2%) |
|
|
|
(51 bps) |
Y/Y Growth |
4.6% |
5.6% |
|
|
~2.0% |
5.0% |
|
|
(1 bps) |
19 bps |
|
|
|
|
|
|
|
|
|
|
|
|
|
|
|
Source: Deutsche Bank, company data, FactSet
Notes: Kellogg DB estimates have been updated following the company’s investor event on 11/13/18
Deutsche Bank |
Rob Dickerson, (+1) 212-250-2160, rob.dickerson@db.com |
10 |
|
|
Source: Deutsche Bank |