

vk.com/id446425943 |
Diamonds Watch |
Global |
|
Materials: Diversified Metals & Mining |
|
|
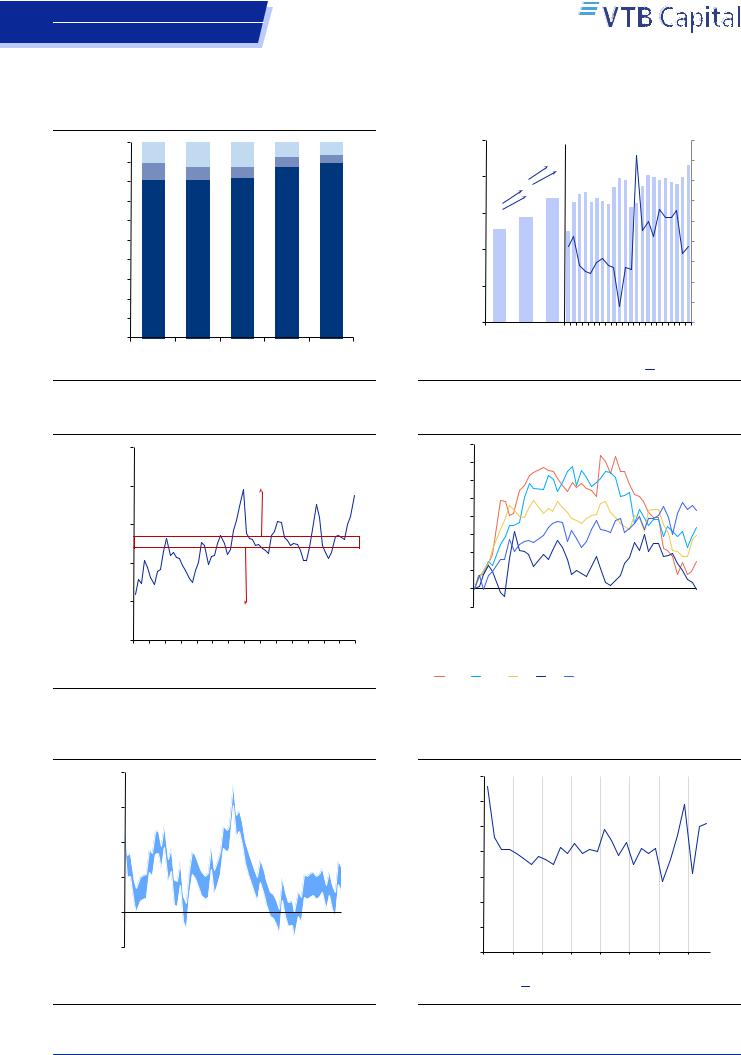
Mid-stream (cutting and polishing) |
Figure 12: India’s share in diamond cutting and polishing
cutting |
|
100% |
10% |
12% |
12% |
7% |
6% |
|||||
|
|
|||||||||||
|
90% |
5% |
4% |
|||||||||
|
9% |
|
7% |
6% |
||||||||
|
|
|
|
|
|
|
|
|
|
|||
diamondsroughfrom |
countriespolishing |
80% |
|
|
|
|
|
|
|
|
|
|
70% |
|
|
|
|
|
|
|
|
|
|
||
|
|
|
|
|
|
|
|
|
|
|
|
|
|
|
60% |
|
|
|
|
|
|
|
|
|
|
|
|
50% |
|
|
|
|
|
|
|
|
88% |
90% |
|
|
40% |
81% |
81% |
82% |
|||||||
|
|
|
|
|||||||||
importof and |
30% |
|
|
|
|
|
|
|
|
|
|
|
20% |
|
|
|
|
|
|
|
|
|
|
||
|
|
|
|
|
|
|
|
|
|
|
|
|
Net |
|
10% |
|
|
|
|
|
|
|
|
|
|
|
0% |
|
|
|
|
|
|
|
|
|
|
|
|
|
2012 |
2013 |
2014 |
2015 |
2016 |
||||||
|
|
|
||||||||||
|
|
|
|
|
India |
|
China |
|
|
Other |
|
|
|
|
|
|
|
|
|
|
|
||||
|
|
|
|
|
|
|
|
|
||||
Source: Bain, VTB Capital Research
Figure 13: India polished diamonds net exports
2,500 |
|
|
18% |
|
|
|
|
35% |
||||
|
|
|
|
|
|
|
|
|
|
|||
|
|
|
|
|
|
18% |
|
|
|
|
30% |
|
|
|
|
|
|
YoY |
|
|
|
|
|||
|
|
|
|
|
|
YoY |
|
|
|
|
|
|
2,000 |
13% |
1,439 |
1,696 |
|
|
|
|
10% |
||||
USDmn |
1,270 |
|
|
|
|
|
||||||
|
|
|
13% |
|
|
|
|
|
|
25% |
||
|
|
|
YoY |
|
|
|
|
|
|
|
|
|
|
|
|
YoY |
|
|
|
|
|
|
|
20% |
|
1,500 |
|
|
|
|
|
|
|
|
|
|||
|
|
|
|
|
|
|
|
|
15% |
|||
|
|
|
|
|
|
|
|
|
|
|
|
|
1,000 |
|
|
|
|
|
|
|
|
|
5% |
||
|
|
|
|
|
|
|
|
|
|
|
|
|
500 |
|
|
|
|
|
|
|
|
|
0% |
||
|
|
|
|
|
|
|
|
|
|
|||
|
|
|
|
|
|
|
|
|
|
|
|
-5% |
0 |
|
|
|
|
|
Feb-17 |
|
Nov-17 |
Feb-18 |
-10% |
||
|
|
|
2014 |
2015 |
2016 |
May-17 Aug-17 |
May-18 Aug-18 |
|||||
|
|
|
Monthly run-rate |
|||||||||
|
|
|
|
|
|
|
|
|
|
|
|
|
|
|
India net polished exports, 3M MA |
|
YoY, rhs |
||||||||
|
|
|
||||||||||
|
|
|
||||||||||
Source: GJEPC, VTB Capital Research
Figure 14: India polished exports vs rough imports
|
250% |
|
|
rough |
200% |
|
Mid-stream |
MA |
|
||
|
stocks release |
||
|
|
||
|
|
|
|
exports/4mnetpolished valueinimportsnet |
150% |
|
2015-17 avg |
|
|
||
|
|
|
|
|
100% |
|
|
|
|
|
|
|
|
|
Mid-stream |
|
50% |
|
stocks accumulation |
|
|
|
|
4m MA |
0% |
Jan-13 Jun-13 Nov-13 Apr-14 Sep-14 Feb-15 Jul-15 Dec-15 May-16 Oct-16 Mar-17 Aug-17 Jan-18 Jun-18 |
|
|
|
||
Source: GJEPC, VTB Capital Research
Figure 16: Global polishers’ margin improves in 2018
|
20.0% |
|
|
|
|
|
|
|
|
|
|
|
|
|
|
|
range |
15.0% |
|
|
|
|
|
|
|
|
|
|
|
|
|
|
|
|
|
|
|
|
|
|
|
|
|
|
|
|
|
|
|
|
margin |
10.0% |
|
|
|
|
|
|
|
|
|
|
|
|
|
|
|
|
|
|
|
|
|
|
|
|
|
|
|
|
|
|
|
|
Operating |
5.0% |
|
|
|
|
|
|
|
|
|
|
|
|
|
|
|
|
|
|
|
|
|
|
|
|
|
|
|
|
|
|
|
|
|
0.0% |
|
|
|
|
|
|
|
|
|
|
|
|
|
|
|
|
|
|
|
|
|
|
|
|
|
|
|
|
|
|
|
|
|
|
|
|
|
|
|
|
|
|
|
|
|
|
|
|
|
|
-5.0% |
|
|
|
|
|
|
|
|
|
|
|
|
|
|
|
|
Jan-13 Jun-13 Nov-13 Apr-14 Sep-14 Feb-15 Jul-15 Dec-15 May-16 Oct-16 Mar-17 Aug-17 Jan-18 Jun-18 Nov-18 |
|||||||||||||||
Source: Rapaport, Bloomberg, VTB Capital Research
Figure 15: Polished prices trim gains in 2H18
|
8% |
|
|
|
7% |
|
|
% |
6% |
|
|
5% |
|
||
gain, |
4.3% |
||
4% |
|||
price |
3.4% |
||
3% |
|||
2.9% |
|||
YTD |
2% |
1.5% |
|
1% |
|||
|
|
||
|
0% |
-0.1% |
|
|
-1% |
|
|
31-Dec |
31-Jan |
28-Feb |
31-Mar |
30-Apr |
31-May 30-Jun |
31-Jul |
31-Aug 30-Sep |
31-Oct |
|
|
|
|
|
|
|
|||
|
Rapaport indices: |
|
|
|
|
|
|||
|
0.3ct |
0.5ct |
1ct |
3ct |
PolishedPrices.com overall index |
||||
|
|
|
|
|
|
|
|
|
|
Source: Rapaport, VTB Capital Research
Figure 17: Asian Star (Indian public polisher) EBITDA margin
quarterly |
7% |
|
6% |
||
|
||
margin, |
5% |
|
4% |
||
EBITDA |
3% |
|
|
||
star |
2% |
|
|
||
Asian |
1% |
|
|
||
|
0% |
1Q112Q113Q114Q111Q122Q123Q124Q121Q132Q133Q134Q131Q142Q143Q144Q141Q152Q153Q154Q151Q162Q163Q164Q161Q172Q173Q174Q171Q182Q183Q18 Asian star EBITDA margin
Source: Company data, VTB Capital Research
26 November 2018 |
6 |

vk.com/id446425943 |
Diamonds Watch |
Global |
|
Materials: Diversified Metals & Mining |
|
|
Downstream (Jewellery) |
Figure 18: Global diamond jewellery market structure
|
Tiffany 2Q18: +8% YoY |
|
|
|||
Tiffany 2Q18: double |
Richemont Apr-Sep 18: +42% YoY* |
|||||
Signet 2Q18: +1.5% YoY |
|
|
||||
digit growth YoY |
|
|
||||
Total jewellery sales Jan-Aug: +9.3% YoY |
||||||
Luk Fook 3Q18:+4% |
||||||
|
|
|
|
|
||
YoY |
|
|
|
|
|
|
Chow Tai Fook |
|
|
|
|
|
|
3Q18: -2% YoY |
|
22% |
|
|
||
|
|
52% |
||||
Titan 3Q18: +32% YoY |
|
|
|
|||
|
3% |
|
|
|||
|
|
|
|
|||
Chow Tai Fook 3Q18: +1% |
|
|
|
|
||
YoY |
|
12% |
|
|
||
Luk Fook 3Q18: +18% YoY |
|
|
|
|
||
Tiffany 2Q18: +28% YoY |
4%7% |
|
|
|||
Richemont Apr-Sep 18: high |
|
|
||||
single digit growth YoY* |
|
|
|
|
|
|
* Sales growth in all business areas; |
|
US |
|
Japan |
||
|
|
|||||
|
|
|||||
Global Jewellery Maisons sales growth in |
|
Gulf |
|
Mainland China |
||
|
|
|||||
Apr-Sep 18 is 9%. |
|
|
India |
|
Others |
|
|
|
|
||||
|
|
|
||||
Source: US Census Bureau, VTB Capital Research
Figure 19: US jewellery and watches sales growth
15%
sales |
|
|
|
|
|
|
|
|
|
|
|
7.4% |
7.7% |
8.1% |
7.3% |
10.8% |
8.7% |
8.9% |
|||
|
|
|
|
|
|
|
|
|
|
|
|
|
|
8.3% |
|
9.4% |
|
10.7% |
|
||
watchesandjewellery YoYgrowth, |
10% |
0.2%0.1% |
0.1% |
|
0.5% 1.1% |
|
1.8% |
|
6.2% |
|
|
9.7% |
|
8.5% 5.3% |
|||||||
|
|
|
|
4.4% |
|
|
|||||||||||||||
|
5% |
0.8% |
1.4% |
2.5% |
1.8% |
4.7% |
2.7% |
|
4.5% |
|
|
|
|
|
|
|
|
|
|||
|
|
|
|
|
2.7% |
|
|
3.1% |
|
|
|
|
|
|
|
|
|
|
|
||
TotalUS |
0% |
0.2%- |
|
1.7% |
|
|
|
|
|
|
|
|
|
|
|
|
|
|
|
|
|
|
|
|
|
|
|
|
|
|
|
|
|
|
|
|
|
|
|
|
|||
|
-5% |
|
-1.1% |
|
|
|
|
|
|
|
|
|
|
|
|
|
|
|
|
|
|
|
|
|
- |
|
|
|
|
|
|
|
|
|
|
|
|
|
|
|
|
|
|
|
|
Jan-16 |
Apr-16 |
Jul-16 |
Oct-16 |
Jan-17 |
|
Apr-17 |
|
Jul-17 |
Oct-17 |
|
Jan-18 |
Apr-18 |
Jul-18 |
||||||
|
|
|
|
|
|
|
|
|
|
|
|
|
|
|
|
||||||
Source: IDEX, VTB Capital Research |
|
|
|
|
|
|
|
|
|
|
|
|
|
|
|
||||||
Figure 20: China jewellery retail sales
|
5.0 |
|
|
|
|
|
|
|
|
|
|
|
|
|
|
|
|
|
-16% YoY in |
15% |
|
4.5 |
|
|
|
|
|
|
|
|
|
|
|
|
|
|
|
|
|
|
|
|
|
|
4.0 |
4.0 |
4.1 |
|
|
|
October |
10% |
||||||||||
|
4.0 |
|
|
|
|
|
|
|||||||||||||
|
|
|
|
|
|
|
|
|
|
|
|
|
|
3.8 |
|
|
|
|||
|
3.5 |
|
|
2.9 |
|
|
|
|
|
|
|
|
|
|
|
5% |
||||
USDbn |
3.0 |
|
|
|
|
|
|
|
|
|
|
|
|
|
0% |
|||||
|
|
|
|
|
|
|
|
|
|
|
|
|
|
|
|
|
|
|||
2.5 |
|
|
2.4 |
|
|
|
|
|
|
|
|
|
|
|
|
|
||||
|
|
|
|
|
|
|
|
|
|
|
|
|
|
|
-5% |
|||||
|
|
|
|
|
|
|
|
|
|
|
|
|
|
|
|
|
||||
|
2.0 |
1.6 |
|
|
|
|
|
|
|
|
|
|
|
|
|
|
|
|
||
|
1.5 |
|
|
|
|
|
|
|
|
|
|
|
|
|
|
|
|
|
|
-10% |
|
1.0 |
|
|
|
|
|
|
|
|
|
|
|
|
|
|
|
|
|
|
-15% |
|
0.5 |
|
|
|
|
|
|
|
|
|
|
|
|
|
|
|
|
|
|
|
|
|
|
|
|
|
|
|
|
|
|
|
|
|
|
|
|
|
|
|
|
|
0.0 |
|
2010 |
|
2011 |
|
2012 |
|
2013 |
|
|
2014 |
|
2015 |
|
2016 |
|
Feb-17 May-17 Aug-17 Nov-17 |
Feb-18 May-18 Aug-18 |
-20% |
|
|
|
|
|
|
|
|
|
|
|
|
|||||||||
|
|
|
|
|
|
Monthly |
run |
-rate |
|
|||||||||||
|
|
|
|
China jewellery retail sales, lhs |
YoY, rhs |
|
||||||||||||||
|
|
|
|
|
||||||||||||||||
|
|
|
|
|
||||||||||||||||
Source: Bloomberg, VTB Capital Research
Figure 22: Top-5* diamond jewellery retailers revenue and inventory continue recovery
50%
40%
30% |
Jewellers started |
re-stocking |
20%
10%
Jewellers de-stocking
0%
-10%
-20%
1Q13 2Q13 3Q13 4Q13 1Q14 2Q14 3Q14 4Q14 1Q15 2Q15 3Q15 4Q15 1Q16 2Q16 3Q16 4Q16 1Q17 2Q17 3Q17 4Q17 1Q18 2Q18 |
|
Top |
5 retailers' inventories, YoY |
Top |
5 retailers' revenue, YoY |
Source: Company Data, VTB Capital Research * Tiffany, Signet, Luk Fook, Chow Tai Fook and Chow Sang Sang
Figure 21: Hong Kong jewellery & watches retail sales
1.6 |
|
|
|
|
|
|
|
|
|
2% YoY in |
40% |
||
|
|
|
|
|
|
|
|
|
|||||
1.4 |
|
|
|
|
1.3 |
|
|
|
|
September |
35% |
||
|
|
|
|
|
|
|
|
|
30% |
||||
|
|
|
|
|
|
|
|
|
|
|
|
||
1.2 |
|
|
|
|
1.1 |
|
|
|
|
||||
|
1.01.0 |
|
|
|
|
25% |
|||||||
|
|
|
|
|
|
|
|
||||||
1.0 |
|
|
|
|
|
|
|
||||||
|
|
|
0.9 |
|
20% |
||||||||
USDbn0.8 |
0.7 |
|
|
|
|
|
|
|
|
||||
|
|
|
|
0.8 |
|
15% |
|||||||
|
|
|
|
|
|
|
|
|
|
|
|||
0.6 |
|
|
|
|
|
|
|
|
|
|
10% |
||
|
|
|
|
|
|
|
|
|
|
5% |
|||
0.4 |
|
|
|
|
|
|
|
|
|
|
|||
|
|
|
|
|
|
|
|
|
|
0% |
|||
0.2 |
|
|
|
|
|
|
|
|
|
|
|||
|
|
|
|
|
|
|
|
|
|
-5% |
|||
|
|
|
|
|
|
|
|
|
|
|
|
|
|
0.0 |
|
|
2011 |
|
|
2014 |
|
2015 |
|
Feb-17 May-17 Aug-17 Nov-17 Feb-18 May-18 Aug-18 |
-10% |
||
|
|
|
|
|
|
|
|
|
|
||||
|
|
|
2010 |
|
Monthly2012 2013 run-rate2016 |
|
|||||||
|
|
Hong Kong jewellery and watches retail sales, lhs |
YoY |
||||||||||
|
|
||||||||||||
|
|
||||||||||||
Source: Bloomberg, VTB Capital Research
Figure 23: Top 5* retailers inventories turnover (days) broadly flat YoY in 1-2Q18
|
250 |
|
days |
200 |
|
|
||
turnover, |
150 |
|
|
||
Inventory |
100 |
|
50 |
||
|
-
1Q12 |
3Q12 |
1Q13 |
3Q13 |
1Q14 |
3Q14 |
1Q15 |
3Q15 |
1Q16 |
3Q16 |
1Q17 |
3Q17 |
1Q18 |
|
|
|
|
Post-holiday sales re-stocking |
|
|||||||
Source: Company data, VTB Capital Research * Tiffany, Signet, Luk Fook, Chow Tai Fook and Chow Sang Sang
26 November 2018 |
7 |

vk.com/id446425943 |
|
Diamonds Watch |
|
|
|
|
|
|
|
|
||||
|
Global |
|
|
|
|
|
|
|
|
|
|
|||
|
Materials: Diversified Metals & Mining |
|
|
|
|
|
|
|
|
|
|
|
||
|
|
|
|
Valuation and forecasts |
|
|
|
|
|
|
||||
|
Figure 24: Alrosa vs. peers valuation |
|
|
|
|
|
|
|
|
|
|
|||
|
Company |
Country |
Price, |
Mcap, |
EV, |
|
— P/E (x) — |
|
— EV/EBITDA (x) — |
|
— FCF yield — |
|
||
|
|
|
USD |
USD mn |
USD mn |
2018F |
2019F |
2020F |
2018F |
2019F |
2020F |
2018F |
2019F |
2020F |
|
VTBC coverage |
|
|
|
|
|
|
|
|
|
|
|
|
|
|
Alrosa* |
Russia |
1.52 |
11,162 |
15,435 |
6.4 |
6.2 |
5.8 |
4.7 |
4.6 |
4.2 |
16% |
15% |
17% |
|
Global peers |
|
|
|
|
|
|
|
|
|
|
|
|
|
|
Petra |
UK |
0.51 |
442 |
964 |
12.1 |
10.0 |
7.4 |
4.4 |
3.7 |
2.9 |
-1% |
19% |
26% |
|
Gem |
UK |
1.48 |
206 |
256 |
6.5 |
10.1 |
9.6 |
2.5 |
3.4 |
3.1 |
18% |
7% |
12% |
|
Lucara Diamonds |
S. Africa |
1.41 |
559 |
519 |
17.4 |
9.9 |
10.9 |
6.8 |
4.2 |
4.3 |
1% |
12% |
10% |
|
Diamond median |
|
|
|
|
12.1 |
10.0 |
9.6 |
4.4 |
3.7 |
3.1 |
1% |
12% |
12% |
|
Global miners |
|
|
|
|
|
|
|
|
|
|
|
|
|
|
VTBC coverage |
|
|
|
|
|
|
|
|
|
|
|
|
|
|
Norilsk Nickel* |
Russia |
17.6 |
27,851 |
35,076 |
6.5 |
5.8 |
5.4 |
5.7 |
5.1 |
5.0 |
16% |
12% |
12% |
|
Global miners |
|
|
|
|
|
|
|
|
|
|
|
|
|
|
BHP Billiton |
Australia |
23.7 |
118,839 |
134,496 |
12.8 |
12.8 |
13.6 |
5.6 |
5.8 |
6.0 |
9% |
8% |
8% |
|
VALE |
Brazil |
14.1 |
74,353 |
77,217 |
10.3 |
8.4 |
9.3 |
5.1 |
4.8 |
4.8 |
13% |
12% |
12% |
|
Rio Tinto |
UK |
48.7 |
86,500 |
98,016 |
10.2 |
11.3 |
11.7 |
5.4 |
5.6 |
5.7 |
10% |
8% |
8% |
|
Glencore |
Swiss |
3.8 |
53,358 |
83,629 |
7.7 |
7.9 |
7.9 |
4.9 |
4.4 |
4.2 |
15% |
17% |
16% |
|
Anglo American |
UK |
21.3 |
27,550 |
36,280 |
8.9 |
8.9 |
9.9 |
4.1 |
4.0 |
4.3 |
12% |
11% |
8% |
|
Median |
|
|
|
|
9.6 |
8.6 |
9.6 |
5.2 |
4.9 |
4.9 |
13% |
11% |
10% |
Source: Company data, VTB Capital Research estimates (marked with an *), Bloomberg consensus as of 20 November 2018 (all the rest)
Figure 25: Alrosa consensus EV/EBITDA vs. Global Miners
|
9.0x |
|
|
20% |
EV/EBITDA |
8.0x |
|
|
10% |
5.0x |
|
|
-20% |
|
|
7.0x |
|
|
0% |
|
6.0x |
|
|
-10% |
FWD |
4.0x |
|
|
-30% |
|
|
|
||
12mo |
3.0x |
|
4.6x, -1% vs. |
-40% |
2.0x |
|
-50% |
||
|
|
|
VTBC estimate |
|
|
1.0x |
|
global miners |
-60% |
|
0.0x |
Nov-13 Apr-14 Sep-14 Feb-15 Jul-15 |
Dec-15 May-16 Oct-16 Mar-17 Aug-17 Jan-18 Jun-18 |
-70% |
|
Jan-13 Jun-13 |
Nov-18 |
||
|
|
Discount, rhs |
|
|
Alrosa cons. 12-m fwd EV/EBITDA
Global Miners 12-m fwd EV/EBITDA
Source: VTB Capital Research, Bloomberg consensus as of 20 November 2018
Figure 26: Alrosa consensus P/E vs. Global Miners
|
20.0x |
|
0% |
|
18.0x |
|
-10% |
EV/EBITDA |
16.0x |
|
-20% |
14.0x |
|
-30% |
|
|
|
||
|
12.0x |
|
-40% |
FWD |
10.0x |
|
-50% |
8.0x |
|
-60% |
|
12mo |
6.0x |
|
-70% |
|
|
||
|
4.0x |
VTBC estimate |
-80% |
|
2.0x |
6.2x, -30% vs. |
-90% |
|
global miners |
||
|
0.0x |
-100% |
|
|
|
||
|
Jan-13 Jun-13 Nov-13 Apr-14 Sep-14 Feb-15 Jul-15 Dec-15 |
May-16 Oct-16 Mar-17 Aug-17 Jan-18 Jun-18 |
Nov-18 |
|
Discount, rhs |
Alrosa cons. 12-m fwd P/E |
|
|
Global Miners 12-m fwd P/E |
|
|
Source: VTB Capital Research, Bloomberg consensus as of 20 November 2018
Figure 27: Diamond jewellery retailers valuation and revenue growth expectations
Company |
Country |
Price |
Mcap |
EV |
Revenue growth |
EV/EBITDA, x |
|
P/E, x |
|
FCFE yield |
||||||
|
|
USD |
USD mn |
USD mn |
2018F |
2019F |
2020F |
2018F |
2019F |
2020F |
2018F |
2019F |
2020F |
2018F |
2019F |
2020F |
Tiffany |
US |
102.4 |
12,529 |
12,701 |
9% |
6% |
5% |
11.6 |
10.5 |
9.7 |
21.3 |
19.0 |
17.4 |
3% |
3% |
4% |
Signet |
US |
52.8 |
2,740 |
4,022 |
0% |
-1% |
-3% |
6.7 |
6.3 |
5.8 |
10.8 |
12.4 |
n/a |
34% |
13% |
11% |
Chow Tai Fook |
China |
0.9 |
8,860 |
9,625 |
10% |
10% |
7% |
10.0 |
8.8 |
8.0 |
14.8 |
12.9 |
11.7 |
6% |
6% |
7% |
Luk Fook |
China & HK |
3.2 |
1,874 |
1,705 |
13% |
10% |
7% |
7.3 |
6.4 |
5.7 |
10.3 |
9.2 |
8.6 |
2% |
6% |
8% |
Chow Sang Sang |
China |
1.6 |
1,090 |
1,140 |
13% |
8% |
8% |
6.2 |
5.5 |
5.1 |
8.2 |
7.4 |
6.8 |
5% |
1% |
1% |
Titan |
India |
13.0 |
11,571 |
11,723 |
4% |
19% |
18% |
40.9 |
33.1 |
27.3 |
61.1 |
49.4 |
41.5 |
1% |
1% |
1% |
Average |
|
|
|
|
8% |
9% |
7% |
13.8 |
11.8 |
10.3 |
21.1 |
18.4 |
17.2 |
8% |
5% |
5% |
Median |
|
|
|
|
9% |
9% |
7% |
8.7 |
7.6 |
6.9 |
12.8 |
12.7 |
11.7 |
4% |
5% |
5% |
Source: VTB Capital Research, Bloomberg consensus as of 20 November 2018
26 November 2018 |
8 |