


vk.com/id446425943
2.3.4. Full Hybrids
Full hybrids (HEVs) are internal combustion engine vehicles that have a small battery for energy recuperation but no plug to recharge. These vehicles typically have a battery capacity from 0.7 kWh up to 4 kWh. Full hybrids are distinguished from mild hybrids11 , that are considered here as conventional ICE vehicles (typical batteries are from 0.1 kWh to 0.7 kWh).
Despite some misleading advertisement by Toyotaxii claiming their hybrid vehicles are “self-charging”, these vehicles need to refuel with conventional petrol (or diesel) and are not zero or low emission, offering a CO2 reduction of around 24% -27%12 compared to ICE based on official test results (NEDC).
As seen in Figure 12, the share of HEVs in the European vehicle production mix increases from around quarter of a million units in 2019 up to 650,000 in 2025 (from 1.3% to 3.4%). 13 Toyota is producing the vast majority of all HEVs in 2019 and is expected to account for over 40% of HEV EU production in 2025.
In short, FCEVs, CNG and hybrid vehicles will play a small role in the foreseeable future as carmakers are opting for direct electrification as the preferred technology pathway. This makes sense from the perspective of limited R&D budgets and the need to give signal to the supplier and supply chain industries to plan capital intensive investments, such as batteries.
2.4. Individual OEM production plans
The two previous sections have shown that carmakers appear to be committing to producing EVs in Europe. In this section, we will investigate the difference between some carmakers’ plans.
The Volkswagen Group is the undisputed leader in the expected production of BEV with close to 1 million BEVs produced in 202514, or more than a third of all the BEVs expected to be produced in Europe. The subbrands of Audi, SEAT, Skoda and Volkswagen will all be producing BEVs using five new MEB platforms15 developed by the group (4 in Germany and one in Czech Republic). PSA which will produce similar electric vehicle models under different brands (Peugeot, Citroen and Opel) is also expected to produce a high number of electric cars. Daimler (Mercedes and Mini) and Renault-Nissan also make up a significant share in the total BEV production of 11% and 10% respectively.
For PHEVs, the general trend is similar, although the Volkswagen Group is expected to produce much less PHEVs than BEVs and is in second place for PHEV production in 2025 with about 300,000 units. The first is PSA which is expected to be the largest PHEV manufacturer (about 350,000 units in 2025), while FCA sits in third position with 250,000 units.
For electric vehicles overall, the Volkswagen Group is in the first place with about 1.2 million EVs, followed by PSA with 700,000 units and both Daimler and Renault-Nissan with close to half a million units in 2025. Together, they make up two thirds of the planned EV EU production in 2025.
11Mild hybrids are cars with a starter generator in place of the starter motor. They enable a car to idle for longer in stop-start traffic, but they can't provide electric-only drive.
12Based on 2017 EEA registration data comparing average CO2 emissions from ICEs (diesel and petrol) with the average CO2 emissions from Toyota’s full hybrids sold that year. When including Lexus alongside Toyota (which sells premium vehicles), the CO2 reduction from full hybrids is about 24%.
13Range extended electric vehicles are classified as PHEVs and hybrid CNG vehicles are classified as HEVs.
14Audi: about 300,000 BEVs; Volkswagen: 300,000; Porsche: 160,000; SEAT: 75,000 and Skoda: 50,000
15MEB standards for ‘Modularer E-Antriebs-Baukasten’ in German which translates into Modular E-drive construction kit.
15

vk.com/id446425943
While the forecast data acquired by T&E shows slight variations in carmakers’ strategies, all European carmakers are expected to have very similar strategies and focus on EV to replace ICE production (see Figure 15). The total forecasted share of EVs varies between carmakers but stays between 19% and 23% for most of them (Volkswagen, PSA, Renault-Nissan, BMW, Ford, and Jaguar Land Rover). Daimler and FCA have a higher share with 26% and 27% respectively: Daimler’s sub-brand Smart would be fully battery electric as of 2021 (Mercedes alone would produce 22% EV), and FCA focuses more on selling PHEV and thus will have to sell more of them to achieve the CO2 emission reductions compared to other carmakers. Finally, Volvo - which produces lower volumes than other European carmakers - is expected to shift more rapidly towards the production of electric models XC40 and XC60 and away from ICE. This will have a significant impact on Volvo’s total mix as both models make up close to 60% of its car production.
Figure 15: Split in planned European production of vehicles per OEM in 2025
Almost all European carmakers have an expected share of BEVs in the total EV production between 50% and 60%. Volkswagen Group stands out with a much higher share of BEVs at ¾ of the expected EVs produced. Both FCA and Volvo are favouring PHEVs with only 32% BEVs in the EV production mix for FCA and 45% for Volvo.
Finally, both Asian carmakers (Toyota and Hyundai-Kia) appear as outliers because their production mix in the EU is likely not to be representative of their sales mix as they also rely on imports. The number of imported and sold EVs from foreign carmakers is likely to vary and to be adjusted to what is required to comply with the CO2 standards. Nonetheless, Toyota is the only carmaker to focus on hybrids - it makes up around 50% of the carmaker’s production volumes in Europe.16
2.5. Expected production per vehicle segment
In the next 5 years, the number of vehicles produced in each segment stays relatively constant with around
0.9million vehicles in segment A, around 4.3 million in segment B, around 8.0 million in segment C, around
3.2million in segment D and 2.4 million in segment E.
Each vehicle type has its specificities with regards to preferred segment. Both PHEVs and diesel ICE cars are virtually inexistent in small car segments (A & B), and this is not expected to change much in the next years,
16 It should be noted that this forecast was carried out before Toyota has committed to binging forward its electrification plan and a more recent forecast would likely show a higher share of EV.
16

vk.com/id446425943
see Figure 16 below. This is different for gasoline ICE cars that focus much more on small and medium cars and are less present in larger car segments (though there is a risk this might change with the current decline in diesel sales). BEV production, however, appears to be evenly split between vehicle segments.
Figure 16: Production of vehicles per segment in the EU (Source: IHS Markit)
The number of small (A & B), medium (C) and large (D & E) BEVs produced in Europe is fairly equal and all increase proportionately between 2019 and 2025. On the other hand, PHEVs are much underrepresented in smaller (A & B) segments and overrepresented in larger ones (segment D and E), often premium vehicles. This is explained by the fact that a plug-in hybrid car can hardly be a small one as it needs to fit both powertrain systems: the combustion engine and the electric drivetrain with battery. Finally, gasoline vehicles are expected to remain more present in smaller segments that often drive less kilometers while diesel vehicles on the contrary are typically bigger cars and drive further.
In short – provided manufacturers realise their current production plans as expected – BEVs will be available in equal proportion in small, medium and large vehicle segments and would therefore be able to fulfill various needs and requirements from different consumer groups and use cases. Smaller vehicles will be best suited in urban areas with air pollution restrictions and limited available space. Larger
17
vk.com/id446425943
BEVs (alongside PHEVs) will be available for drivers that require high annual mileage thanks to more dense batteries combined with a network of fast charging allowing to replenish the batteries in about 15 minutes.
2.6. Location of EV production
Production of EVs is gradually replacing that of ICEs and this affects all major vehicle manufacturing countries in Europe. According to data acquired by T&E, together Germany, France, Spain, Italy and the UK17 will produce about 85% of the EV in 2025 (out of the total EU production), whereas they will produce about two thirds of the conventional cars. These countries are the five biggest vehicle markets today and are expected to also be the largest EV markets in Europe in the future.
However, the overall number of vehicles produced only tells part of the story given the difference in the size of countries and their workforce across Europe. To understand how production will evolve over the years and how this is prone to affect the country’s economy and employment we should also look at the evolution of the number of vehicles produced per capita, as shown in Figure 17 below18.
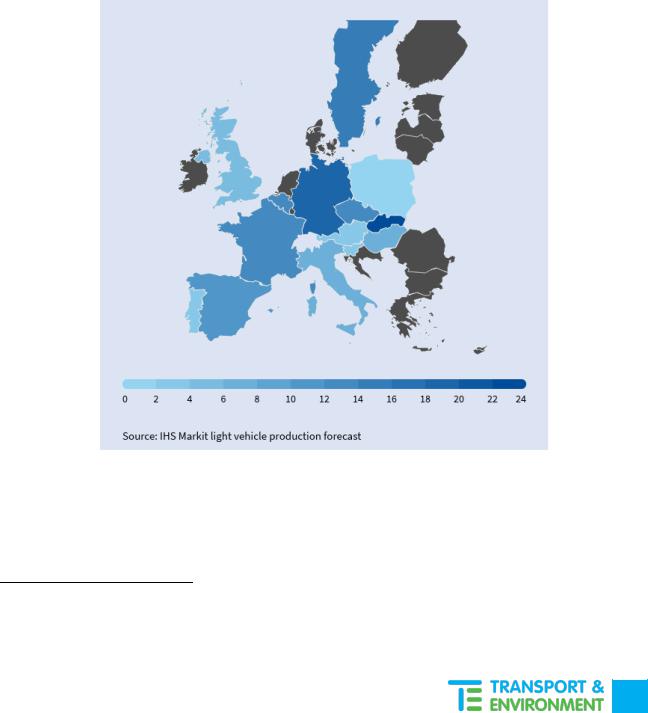
Figure 17: EU EV production per 1,000 inhabitants in 2025
As can be seen, Slovakia has by far the highest forecasted production of electric vehicles in Europe, or 25 EVs produced per thousand inhabitants in 2025. Germany and Sweden follow with 19 and 14 EVs produced per thousand inhabitants respectively, while Belgium, the Czech Republic and France all have around 12
17The UK figures cannot be predicted with certainty since the outcome of Brexit will determine whether or not the planned production will take place (unlikely in the no-deal scenario)
18Based on Eurostat population statistics, assumed constant over 2017-2025.
18

vk.com/id446425943
EVs produced per thousand inhabitants. Hungary, Italy, Slovenia, Austria and Portugal are expected to have between 2 and 6 EVs produced for per thousand inhabitants.
Figure 18 below shows which carmakers are expected to produce EVs in which country in 2025.19 While locations might be subject to change given the timeframe, it is nonetheless interesting to analyse what they are currently forecasted to be. Four countries - Germany, France, Spain and the UK20 - are expected to have at least four different carmakers producing significant volumes of EVs in 2025 (more than 10,000 units). Two countries (the Czech Republic and Slovakia) have three different carmakers planning to produce EVs at large scale, which is significant for their economies. Planned production of EVs within each OEM is also expected to be spread widely among countries.
In terms of OEMs, the Volkswagen Group’s EV production is the most widespread as it is expected to be found in seven different EU countries in 2025. The PSA Group is expected to produce EVs in six different EU countries, Daimler in four countries and both Renault-Nissan and Jaguar Land Rover in three countries.
19Only carmakers with expected production of more than 10,000 units were represented. Together, these lower volume production only account for 2% of the total EV production, therefore this exclusion is reasonable.
20The UK is the biggest uncertainty in the current analysis due to Brexit and lack of data on how this will impact car manufacturing
19

vk.com/id446425943
Figure 18: Member states’ electric car production in the EU in 2025
For more details on member states’ production plan, please visit an interactive map online.
Figures 19 and 20 below show the evolution of EV production between 2019 and 2025 per member state. The grey (ICE) and blue (EV) bars depict the variations (either growth or reduction) in vehicle production for conventional and electric cars. Combined the changes in the production of each vehicle type make up the overall evolution of the vehicle production market, which is captured with the green dots (right axis). While Figure 19 gives numbers per capita which are more representative of the importance of vehicle manufacturing in that country, Figure 20 shows absolute figures which are useful to understand the total contribution to the EU’s market and economy.
20
vk.com/id446425943
Figure 19: Evolution of vehicle production per 1,000 inhabitants from 2019 to 2025 (Source: IHS Markit)
We note that although large parts of production of EVs will be located in the main EV demand markets, Central and Eastern European countries will nonetheless have strong production of various vehicle powertrains in the coming years. Romania and Poland will see strong increase in the production of ICE vehicles (61% and 35% respectively) between 2019 and 2025, while Hungary and Slovakia both expect the increase in production of ICE and EVs leading to a combined growth of 20% and 14% respectively. The UK, Germany, Italy and Spain also show a net increase in vehicle production numbers (ranging between 5% and 11%), with EV production more than compensating for the decrease in ICE production. In France and the Czech Republic EV production is expected to balance out the losses in ICE production.
The countries that are expected to suffer from net losses in vehicles production are Portugal, Belgium, Sweden, Slovenia, Austria, the Netherlands and Finland since the reduction in ICE production is not balanced by the uptake of EV production (based on the production plans announced to date). Only in Belgium and Sweden does the production of EVs increases but is not sufficient to keep the total production from decreasing. In Finland there is no expected EV production in 2025.
21

vk.com/id446425943
Figure 20: Evolution of vehicle production from 2019 to 2025 (Source: IHS Markit)
EU-wide, the increasing EV production ensures the overall growth of the EU vehicles production market with a 5% growth rate in 2025 compared to 2019, which translates into a net increase of 900,000 units (not represented here). As the sales of ICEs will continue deceasing as carmakers need to meet more and more stringent CO2 targets, countries (and manufacturers) who fail to plan timely new EV production will be the most impacted from the shift away from fossil-fueled vehicles.
The social or job aspects of the transition from manufacturing ICE vehicles to EVs are not assessed in this report but will be considered by T&E at a later stage.
22