

ESG_140119(1)_watermark
.pdfvk.com/id446425943
EM fund flows: Allocations
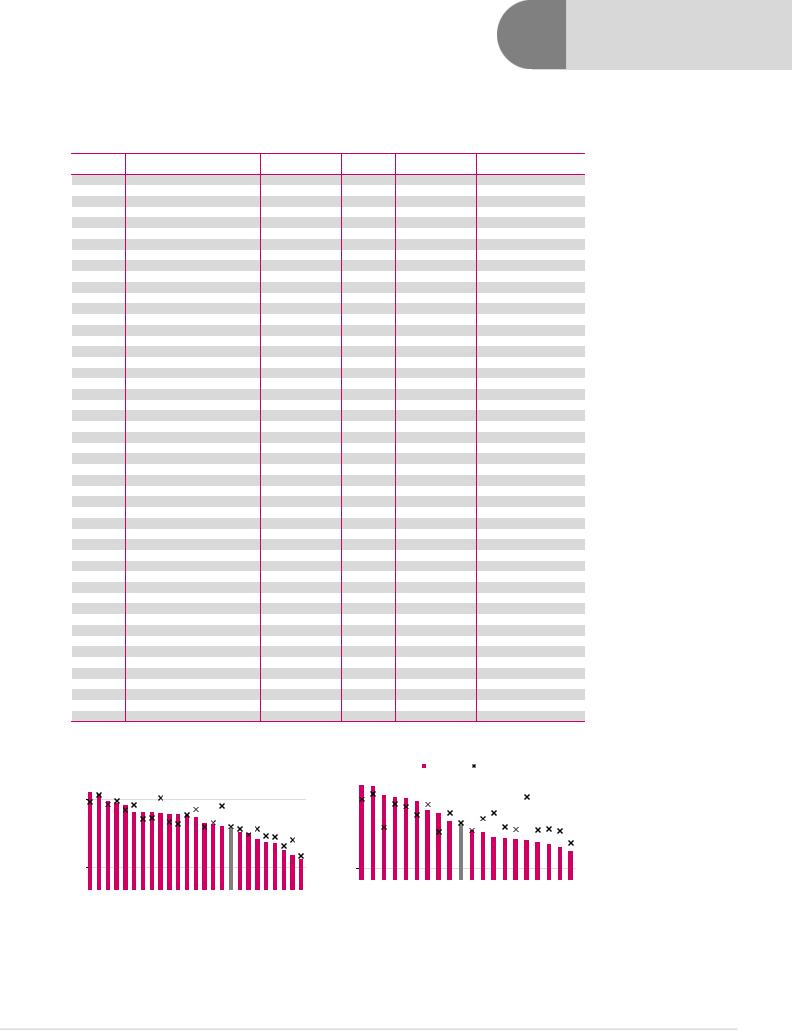
The following charts show sector allocations of non-ETF GEM funds benchmarked to MSCI EM vs index weights, with shaded areas highlighting over/underweights, based on a sample of c. 40% of MSCI EM-benchmarked active AuM.
Renaissance Capital
14 January 2019
ESG
Figure 190: Non-ETF allocation to IT vs benchmark
|
Overweight |
|
Underweight |
|
|
||
|
|
||
|
IT, Fund weight |
|
IT, Index weight |
|
|
30% |
25% |
20% |
15% |
10% |
5% |
0% |
Aug-06 Feb-07 Aug-07 Feb-08 Aug-08 Feb-09 Aug-09 Feb-10 Aug-10 Feb-11 Aug-11 Feb-12 Aug-12 Feb-13 Aug-13 Feb-14 Aug-14 Feb-15 Aug-15 Feb-16 Aug-16 Feb-17 Aug-17 Feb-18 Aug-18 |
Figure 191: Non-ETF allocation to Financials vs benchmark
|
Overweight |
|
Underweight |
|
|
||
|
|
||
|
Financials, Fund weight |
|
Financials, Index weight |
|
|
35% |
30% |
25% |
20% |
15% |
10% |
5% |
0% |
Aug-06 Feb-07 Aug-07 Feb-08 Aug-08 Feb-09 Aug-09 Feb-10 Aug-10 Feb-11 Aug-11 Feb-12 Aug-12 Feb-13 Aug-13 Feb-14 Aug-14 Feb-15 Aug-15 Feb-16 Aug-16 Feb-17 Aug-17 Feb-18 Aug-18 |
Source: MSCI, EPFR.com Source: MSCI, EPFR.com
Figure 192: Non-ETF allocation to Consumer Discretionary vs benchmark Figure 193: Non-ETF allocation to Energy vs benchmark
|
Overweight |
|
Underweight |
|
|
||
|
|
||
|
Cons. Disc., Fund weight |
|
Cons. Disc., Index weight |
|
|
16% |
25% |
14% |
|
12% |
20% |
|
|
10% |
15% |
|
|
8% |
|
6% |
10% |
|
|
4% |
5% |
|
|
2% |
|
0% |
0% |
|
Aug-06 Feb-07 Aug-07 Feb-08 Aug-08 Feb-09 Aug-09 Feb-10 Aug-10 Feb-11 Aug-11 Feb-12 Aug-12 Feb-13 Aug-13 Feb-14 Aug-14 Feb-15 Aug-15 Feb-16 Aug-16 Feb-17 Aug-17 Feb-18 Aug-18 |
|
Overweight |
|
Underweight |
|
|
||
|
|
||
|
Energy, Fund weight |
|
Energy, Index weight |
|
|
Aug-06 Feb-07 Aug-07 Feb-08 Aug-08 Feb-09 Aug-09 Feb-10 Aug-10 Feb-11 Aug-11 Feb-12 Aug-12 Feb-13 Aug-13 Feb-14 Aug-14 Feb-15 Aug-15 Feb-16 Aug-16 Feb-17 Aug-17 Feb-18 Aug-18 |
Source: MSCI, EPFR.com Source: MSCI, EPFR.com
Figure 194: Non-ETF allocation to Materials vs benchmark Figure 195: Non-ETF allocation to Consumer Staples vs benchmark
|
Overweight |
|
Underweight |
|
|
||
|
|
||
|
Materials, Fund weight |
|
Materials, Index weight |
|
|
20% |
16% |
|
|
|
14% |
15% |
12% |
|
10% |
10% |
8% |
|
6% |
5% |
4% |
|
2% |
0% |
0% |
|
Aug-06 Feb-07 Aug-07 Feb-08 Aug-08 Feb-09 Aug-09 Feb-10 Aug-10 Feb-11 Aug-11 Feb-12 Aug-12 Feb-13 Aug-13 Feb-14 Aug-14 Feb-15 Aug-15 Feb-16 Aug-16 Feb-17 Aug-17 Feb-18 Aug-18 |
|
Overweight |
|
Underweight |
|
|
||
|
|
||
|
Cons. Staples, Fund weight |
|
Cons. Staples, Index weight |
|
|
Aug-06 Feb-07 Aug-07 Feb-08 Aug-08 Feb-09 Aug-09 Feb-10 Aug-10 Feb-11 Aug-11 Feb-12 Aug-12 Feb-13 Aug-13 Feb-14 Aug-14 Feb-15 Aug-15 Feb-16 Aug-16 Feb-17 Aug-17 Feb-18 Aug-18 |
Source: MSCI, EPFR.com |
Source: MSCI, EPFR.com |
99

vk.com/id446425943
EM fund Flows: Allocations
Renaissance Capital
14 January 2019
ESG
Figure 196: Non-ETF allocation to Industrials vs benchmark |
Figure 197: Non-ETF allocation to Telecoms vs benchmark |
Overweight |
Underweight |
|
Industrials, Fund weight |
Industrials, Index weight |
|
14% |
18% |
|
|
||
12% |
16% |
|
10% |
14% |
|
12% |
||
|
||
8% |
10% |
|
|
||
6% |
8% |
|
4% |
6% |
|
4% |
||
2% |
||
2% |
||
|
||
0% |
0% |
|
Aug-06 Feb-07 Aug-07 Feb-08 Aug-08 Feb-09 Aug-09 Feb-10 Aug-10 Feb-11 Aug-11 Feb-12 Aug-12 Feb-13 Aug-13 Feb-14 Aug-14 Feb-15 Aug-15 Feb-16 Aug-16 Feb-17 Aug-17 Feb-18 Aug-18 |
||
|
Overweight |
|
Underweight |
|
|
||
|
|
||
|
Telecoms, Fund weight |
|
Telecoms, Index weight |
|
|
Aug-06 Feb-07 Aug-07 Feb-08 Aug-08 Feb-09 Aug-09 Feb-10 Aug-10 Feb-11 Aug-11 Feb-12 Aug-12 Feb-13 Aug-13 Feb-14 Aug-14 Feb-15 Aug-15 Feb-16 Aug-16 Feb-17 Aug-17 Feb-18 Aug-18 |
Source: MSCI, EPFR.com Source: MSCI, EPFR.com
Figure 198: Non-ETF allocation to Real Estate vs benchmark Figure 199: Non-ETF allocation to Healthcare vs benchmark
|
Overweight |
|
Underweight |
|
|
||
|
|
||
|
Real Estate, Fund weight |
|
Real Estate, Index weight |
|
|
4.5% |
|
|
|
|
|
|
|
|
|
|
3.5% |
|
|
|
|
|
|
|
|
|
|
|
|
4.0% |
|
|
|
|
|
|
|
|
|
|
3.0% |
3.5% |
|
|
|
|
|
|
|
|
|
|
2.5% |
|
|
|
|
|
|
|
|
|
|
|
|
3.0% |
|
|
|
|
|
|
|
|
|
|
2.0% |
2.5% |
|
|
|
|
|
|
|
|
|
|
|
|
|
|
|
|
|
|
|
|
|
|
|
2.0% |
|
|
|
|
|
|
|
|
|
|
1.5% |
1.5% |
|
|
|
|
|
|
|
|
|
|
1.0% |
|
|
|
|
|
|
|
|
|
|
|
|
1.0% |
|
|
|
|
|
|
|
|
|
|
0.5% |
0.5% |
|
|
|
|
|
|
|
|
|
|
|
|
|
|
|
|
|
|
|
|
|
|
|
0.0% |
|
|
|
|
|
|
|
|
|
|
0.0% |
|
|
|
|
|
|
|
|
|
|
|
|
Apr-13 |
Oct-13 |
Apr-14 |
Oct-14 |
Apr-15 |
Oct-15 |
Apr-16 |
Oct-16 |
Apr-17 |
Oct-17 |
Apr-18 |
Oct-18 |
|
Overweight |
|
Underweight |
|
|
||
|
|
||
|
Healthcare, Fund weight |
|
Healthcare, Index weight |
|
|
Aug-06 Feb-07 Aug-07 Feb-08 Aug-08 Feb-09 Aug-09 Feb-10 Aug-10 Feb-11 Aug-11 Feb-12 Aug-12 Feb-13 Aug-13 Feb-14 Aug-14 Feb-15 Aug-15 Feb-16 Aug-16 Feb-17 Aug-17 Feb-18 Aug-18 |
Source: MSCI, EPFR.com Source: MSCI, EPFR.com
Figure 200: Non-ETF allocation to Utilities vs benchmark Figure 201: Non-ETF allocation to Cash
|
Overweight |
Underweight |
|
4.5% |
Utilities, Fund weight |
Utilities, Index weight |
|
|
|
14% |
|
|
|
|
|
4.0% |
|
|
12% |
3.5% |
|
|
|
|
|
|
|
3.0% |
|
|
10% |
2.5% |
|
|
8% |
|
|
|
|
2.0% |
|
|
6% |
1.5% |
|
|
|
|
|
|
|
1.0% |
|
|
4% |
|
|
|
|
0.5% |
|
|
2% |
0.0% |
Aug-06 Feb-07 Aug-07 Feb-08 Aug-08 Feb-09 Aug-09 Feb-10 Aug-10 Feb-11 Aug-11 Feb-12 Aug-12 Feb-13 Aug-13 Feb-14 Aug-14 Feb-15 Aug-15 Feb-16 Aug-16 Feb-17 Aug-17 Feb-18 Aug-18 |
0% |
|
|
|||
|
|
||
|
|
|
|
|
|
|
Cash |
|
|
|
Average Cash |
|
|
|
|
|
Jan-96 |
Jan-97 |
Jan-98 |
Jan-99 |
Jan-00 |
Jan-01 |
Jan-02 |
Jan-03 Jan-04 Jan-05 |
Jan-06 |
Jan-07 |
Jan-08 |
Jan-09 Jan-10 Jan-11 Jan-12 Jan-13 |
Jan-14 |
Jan-15 |
Jan-16 |
Jan-17 |
Jan-18 |
Source: MSCI, EPFR.com |
Source: MSCI, EPFR.com |
100

vk.com/id446425943
Market watch
Performance: EM and Frontier ($)
Renaissance Capital
14 January 2019
ESG
Month to 31 December
a |
|
|
|
|
|
|
|
|
|
|
|
a |
1m |
3m |
6m |
12m |
2018 |
2017 |
2016 |
2015 |
2014 |
2013 |
12M Trend |
EM |
-2.9 |
-7.8 |
-9.7 |
-16.6 |
-16.6 |
34.3 |
8.6 |
-17.0 |
-4.6 |
-5.0 |
|
Frontier |
-3.0 |
-4.5 |
-6.9 |
-19.1 |
-19.1 |
27.7 |
-1.3 |
-17.3 |
2.9 |
21.4 |
|
DM |
-7.7 |
-13.7 |
-9.8 |
-10.4 |
-10.4 |
20.1 |
5.3 |
-2.7 |
2.9 |
24.1 |
|
LatAm |
-1.3 |
-0.4 |
3.6 |
-9.3 |
-9.3 |
20.8 |
27.9 |
-32.9 |
-14.8 |
-15.7 |
|
EMEA |
-1.8 |
-4.6 |
-7.2 |
-18.8 |
-18.8 |
21.0 |
16.4 |
-22.4 |
-17.5 |
-8.0 |
|
EM Asia |
-3.4 |
-9.6 |
-12.1 |
-17.3 |
-17.3 |
40.1 |
3.8 |
-11.8 |
2.5 |
-0.2 |
|
EM Value |
-2.6 |
-7.2 |
-5.4 |
-13.7 |
-13.7 |
24.3 |
11.4 |
-21.2 |
-7.1 |
-8.0 |
|
EM Growth |
-3.3 |
-8.5 |
-13.8 |
-19.5 |
-19.5 |
44.9 |
5.8 |
-12.8 |
-2.2 |
-2.1 |
|
Iron ore |
11.9 |
4.2 |
11.7 |
-2.4 |
-2.4 |
-7.6 |
85.1 |
-36.5 |
-49.3 |
-6.9 |
|
Gold |
5.1 |
7.7 |
2.4 |
-1.6 |
-1.6 |
13.5 |
8.1 |
-10.4 |
-1.4 |
-28.3 |
|
Copper |
-3.8 |
-4.7 |
-10.0 |
-17.7 |
-17.7 |
30.9 |
17.7 |
-25.3 |
-14.4 |
-7.2 |
|
Oil |
-9.0 |
-35.9 |
-32.4 |
-20.4 |
-20.4 |
20.6 |
55.0 |
-35.9 |
-49.7 |
-1.0 |
|
Mexico |
3.2 |
-19.4 |
-14.2 |
-17.4 |
-17.4 |
13.6 |
-10.7 |
-16.0 |
-10.2 |
-2.0 |
|
Peru |
1.5 |
-3.1 |
-5.3 |
-0.3 |
-0.3 |
33.5 |
53.8 |
-32.5 |
9.2 |
-31.0 |
|
Philippines |
1.5 |
5.2 |
6.0 |
-17.4 |
-17.4 |
23.3 |
-7.7 |
-8.1 |
23.7 |
-4.3 |
|
Malaysia |
1.4 |
-6.2 |
-3.7 |
-8.9 |
-8.9 |
21.1 |
-6.7 |
-22.4 |
-13.4 |
4.2 |
|
Indonesia |
0.8 |
9.4 |
11.4 |
-11.2 |
-11.2 |
22.0 |
14.8 |
-21.0 |
24.1 |
-25.0 |
|
UAE |
0.2 |
-5.6 |
-3.2 |
-11.9 |
-11.9 |
-1.3 |
9.0 |
-20.6 |
11.5 |
84.7 |
|
Poland |
0.2 |
-3.0 |
5.6 |
-14.5 |
-14.5 |
52.2 |
-2.2 |
-27.2 |
-16.8 |
-1.7 |
|
Hungary |
-0.1 |
5.9 |
10.8 |
-8.5 |
-8.5 |
36.9 |
32.3 |
33.1 |
-29.6 |
-9.0 |
|
India |
-0.2 |
2.2 |
-0.5 |
-8.8 |
-8.8 |
36.8 |
-2.8 |
-7.4 |
21.9 |
-5.3 |
|
S Africa |
-0.7 |
-4.1 |
-12.0 |
-26.5 |
-26.5 |
33.1 |
15.1 |
-27.2 |
2.5 |
-8.8 |
|
Qatar |
-1.0 |
8.4 |
22.3 |
23.9 |
23.9 |
-14.4 |
2.3 |
-22.7 |
11.7 |
23.9 |
|
Egypt |
-1.0 |
-10.1 |
-16.2 |
-16.3 |
-16.3 |
4.5 |
-12.8 |
-24.8 |
26.2 |
6.2 |
|
Taiwan |
-1.4 |
-13.7 |
-10.0 |
-11.8 |
-11.8 |
23.8 |
14.8 |
-14.4 |
6.9 |
6.6 |
|
Brazil |
-2.5 |
12.4 |
18.0 |
-3.9 |
-3.9 |
21.0 |
61.3 |
-43.4 |
-17.4 |
-18.7 |
|
Czech |
-3.0 |
-8.7 |
-5.1 |
-8.4 |
-8.4 |
29.4 |
-9.6 |
-21.9 |
-7.9 |
-14.9 |
|
Thailand |
-3.0 |
-10.5 |
1.0 |
-8.0 |
-8.0 |
30.9 |
23.0 |
-25.5 |
13.3 |
-16.9 |
|
Korea |
-3.1 |
-14.2 |
-13.8 |
-22.6 |
-22.6 |
45.5 |
7.0 |
-7.9 |
-12.6 |
3.1 |
|
Chile |
-3.8 |
-8.9 |
-10.8 |
-21.0 |
-21.0 |
39.8 |
13.2 |
-18.9 |
-14.5 |
-23.0 |
|
Russia |
-4.0 |
-10.1 |
-6.7 |
-5.6 |
-5.6 |
0.3 |
48.9 |
0.0 |
-48.5 |
-2.6 |
|
Colombia |
-4.1 |
-19.5 |
-21.9 |
-13.9 |
-13.9 |
13.8 |
23.9 |
-43.9 |
-22.3 |
-23.7 |
|
Turkey |
-5.3 |
4.4 |
-17.2 |
-43.6 |
-43.6 |
34.3 |
-10.5 |
-33.6 |
16.7 |
-28.1 |
|
Greece |
-5.7 |
-16.4 |
-31.1 |
-37.8 |
-37.8 |
27.1 |
-13.2 |
-62.1 |
-40.3 |
46.2 |
|
China |
-6.1 |
-10.8 |
-18.3 |
-20.4 |
-20.4 |
51.1 |
-1.4 |
-10.0 |
4.7 |
0.4 |
|
Pakistan |
-12.4 |
-23.7 |
-28.1 |
-37.8 |
-37.8 |
-28.0 |
32.7 |
-18.3 |
7.6 |
26.5 |
|
Jordan |
4.5 |
-4.0 |
-12.2 |
-8.4 |
-8.4 |
4.3 |
-4.7 |
-4.3 |
-5.3 |
-9.5 |
|
Serbia |
4.4 |
3.4 |
1.4 |
-0.1 |
-0.1 |
28.2 |
9.7 |
-30.7 |
-24.7 |
19.5 |
|
Slovenia |
3.9 |
3.4 |
-2.0 |
-3.7 |
-3.7 |
26.3 |
-19.2 |
-9.3 |
-10.8 |
19.8 |
|
Saudi Arabia |
2.1 |
-2.2 |
-5.1 |
14.7 |
14.7 |
3.7 |
5.9 |
-15.4 |
-5.8 |
26.6 |
|
Morocco |
1.0 |
-0.6 |
-3.4 |
-10.2 |
-10.2 |
7.2 |
29.9 |
-17.3 |
-4.1 |
-7.1 |
|
Nigeria |
0.6 |
-3.4 |
-17.5 |
-18.2 |
-18.2 |
30.7 |
-39.2 |
-23.5 |
-29.6 |
24.3 |
|
Croatia |
0.4 |
-3.5 |
-5.2 |
-12.4 |
-12.4 |
12.9 |
17.6 |
-10.0 |
-17.3 |
-4.7 |
|
Lebanon |
0.3 |
6.6 |
-8.8 |
-17.6 |
-17.6 |
-8.3 |
4.6 |
0.9 |
1.5 |
-9.0 |
|
Kuwait |
-0.2 |
-0.9 |
7.6 |
11.1 |
11.1 |
14.2 |
-0.9 |
-19.4 |
-7.3 |
2.1 |
|
Bangladesh |
-1.8 |
-0.5 |
-7.1 |
-15.9 |
-15.9 |
15.7 |
8.2 |
-18.8 |
47.4 |
0.9 |
|
Mauritius |
-2.3 |
0.8 |
1.1 |
-24.2 |
-24.2 |
36.9 |
4.8 |
-21.1 |
-9.3 |
21.9 |
|
Tunisia |
-2.3 |
-12.4 |
-18.6 |
9.8 |
9.8 |
7.0 |
-3.2 |
-17.7 |
2.2 |
-8.7 |
|
Sri Lanka |
-2.6 |
5.6 |
-8.9 |
-13.8 |
-13.8 |
-1.0 |
-7.7 |
-24.8 |
16.7 |
8.3 |
|
Oman |
-2.9 |
-2.7 |
7.0 |
-9.0 |
-9.0 |
-14.9 |
2.8 |
-13.9 |
-3.9 |
10.4 |
|
WAEMU |
-4.0 |
-15.7 |
-31.7 |
-35.8 |
6.4 |
6.7 |
na |
na |
na |
na |
|
Bahrain |
-4.4 |
-8.9 |
0.8 |
-5.8 |
-5.8 |
5.4 |
-4.0 |
-25.2 |
-35.0 |
-8.3 |
|
Argentina |
-4.8 |
-1.4 |
-10.6 |
-51.7 |
-51.7 |
72.3 |
3.9 |
-1.2 |
17.3 |
63.7 |
|
Vietnam |
-5.8 |
-6.7 |
-10.9 |
-13.5 |
2.1 |
61.2 |
-8.5 |
-6.4 |
2.9 |
3.7 |
|
Lithuania |
-5.8 |
-15.4 |
-16.1 |
-12.9 |
-12.9 |
10.8 |
-7.4 |
-9.8 |
-13.3 |
13.6 |
|
Kazakhstan |
-6.1 |
-0.9 |
-9.1 |
-6.5 |
-6.5 |
68.1 |
6.7 |
-49.3 |
-16.1 |
0.7 |
|
Kenya |
-6.9 |
-10.0 |
-23.8 |
-15.8 |
-15.8 |
29.8 |
-4.6 |
-20.9 |
19.9 |
43.4 |
|
Estonia |
-7.0 |
5.6 |
-4.4 |
-16.4 |
-16.4 |
43.9 |
6.2 |
7.9 |
-32.9 |
6.4 |
|
Romania |
-16.5 |
-15.2 |
-12.1 |
-6.2 |
-6.2 |
21.7 |
3.2 |
-1.4 |
-5.4 |
29.8 |
|
Note: $ performance of MSCI country indices, sorted by last month's returns
MSCI Index performance ($)
200 |
|
|
|
|
EM |
|
|
Frontier |
|
|
DM |
|
|
|
|
||
|
|
|
|
|
|
|
|
|
|
|
|
|
|
|
|
|
|
180 |
|
|
|
|
|
|
|
|
|
|
|
|
|
|
|
|
|
160 |
|
|
|
|
|
|
|
|
|
|
|
|
|
|
|
|
|
140 |
|
|
|
|
|
|
|
|
|
|
|
|
|
|
|
|
|
120 |
|
|
|
|
|
|
|
|
|
|
|
|
|
|
|
|
|
100 |
|
|
|
|
|
|
|
|
|
|
|
|
|
|
|
|
|
80 |
|
|
|
|
|
|
|
|
|
|
|
|
|
|
|
|
|
60 |
|
|
|
|
|
|
|
|
|
|
|
|
|
|
|
|
|
Jan-10 |
Jul-10 |
Jan-11 |
Jul-11 |
Jan-12 |
Jul-12 Jan-13 |
Jul-13 |
Jan-14 |
Jul-14 |
Jan-15 |
Jul-15 |
Jan-16 |
Jul-16 |
Jan-17 |
Jul-17 |
Jan-18 |
Jul-18 |
Jan-19 |
MSCI EM Asia vs EMEA vs LatAm ($) |
|
|
|
|
|
|
|
|
|
||||||||
180 |
|
|
|
EM Asia |
|
|
EMEA |
|
|
|
LatAm |
|
|
|
|||
|
|
|
|
|
|
|
|
|
|
|
|
|
|
|
|
|
|
160 |
|
|
|
|
|
|
|
|
|
|
|
|
|
|
|
|
|
140 |
|
|
|
|
|
|
|
|
|
|
|
|
|
|
|
|
|
120 |
|
|
|
|
|
|
|
|
|
|
|
|
|
|
|
|
|
100 |
|
|
|
|
|
|
|
|
|
|
|
|
|
|
|
|
|
80 |
|
|
|
|
|
|
|
|
|
|
|
|
|
|
|
|
|
60 |
|
|
|
|
|
|
|
|
|
|
|
|
|
|
|
|
|
40 |
|
|
|
|
|
|
|
|
|
|
|
|
|
|
|
|
|
Jan-10 |
Jul-10 |
Jan-11 |
Jul-11 |
Jan-12 |
Jul-12 Jan-13 |
Jul-13 |
Jan-14 |
Jul-14 |
Jan-15 |
Jul-15 |
Jan-16 |
Jul-16 |
Jan-17 |
Jul-17 |
Jan-18 |
Jul-18 |
Jan-19 |
MSCI EM performance, last month and YtD ($)
30 |
EM performance, 1m ($) |
EM performance, YtD ($) |
20 |
|
|
10 |
|
|
0 |
|
|
-10 |
|
|
-20 |
|
|
-30 |
|
|
-40 |
|
|
-50 |
Mexico Peru Philippines Malaysia Indonesia UAE Poland Hungary India S Africa Qatar Egypt Taiwan Brazil EM Czech Thailand Korea Chile Russia Colombia Turkey Greece China Pakistan |
|
|
||
MSCI FM performance, last month and YtD ($)
20
FM performance, 1m ($) FM performance, YtD ($)
10
0 -10
-20 -30 -40
-50 -60
Romania
WAEMU
Estonia
Kenya
Kazakhstan
Lithuania
Argentina
Vietnam
Bahrain
Frontier
Oman
Sri Lanka
Tunisia
Mauritius
Bangladesh
Kuwait
Lebanon
Croatia
Nigeria
Morocco
Saudi Arabia
Slovenia
Serbia
Jordan
Source: Bloomberg
101

vk.com/id446425943
Renaissance Capital
14 January 2019
ESG
Performance: Sectors ($)
|
Weight |
1m |
3m |
6m |
12m |
2018 |
2017 |
2016 |
2015 |
2014 |
2013 |
12M Trend |
MSCI EM Sector Index performance ($) |
|
|
|
||||||
EM Sectors |
|
|
|
|
|
|
|
|
|
|
|
|
5 |
|
EM sector performance, 1m ($) |
|
|
|||||
Utilities |
3.6% |
0.5 |
3.3 |
0.6 |
-6.4 |
-6.4 |
13.2 |
-0.5 |
-22.9 |
-1.1 |
-5.9 |
|
0 |
|
EM sector performance, YtD ($) |
|
|
|||||
Cons. Staples |
7.2% |
-0.1 |
-5.1 |
-8.3 |
-15.3 |
-15.3 |
23.3 |
-1.6 |
-10.8 |
-6.8 |
-5.5 |
|
-5 |
|
|
|
|
|
|
|
|
|
|
-10 |
|
|
|
|
|
|
|
|
|
||||||||||||
Industrials |
17.2% |
-0.5 |
-4.1 |
-1.7 |
-14.2 |
-14.2 |
24.0 |
-3.7 |
-18.0 |
-4.4 |
-2.8 |
|
|
|
|
|
|
|
|
|
|
|
|
-15 |
|
|
|
|
|
|
|
|
|
||||||||||||
Real Estate |
6.0% |
-0.9 |
1.1 |
-6.5 |
-20.5 |
-20.5 |
45.1 |
-6.3 |
-9.6 |
-6.8 |
-18.3 |
|
|
|
|
|
|
|
|
|
|
|
|
-20 |
|
|
|
|
|
|
|
|
|
||||||||||||
Materials |
7.8% |
-1.1 |
-11.3 |
-9.1 |
-14.4 |
-14.4 |
30.2 |
28.7 |
-23.7 |
-21.8 |
-19.1 |
|
|
|
|
|
|
|
|
|
|
|
|
-25 |
|
|
|
|
|
|
|
|
|
||||||||||||
Communications |
9.3% |
-1.6 |
-4.1 |
-4.1 |
-17.9 |
-17.9 |
12.3 |
-1.1 |
-22.3 |
-4.9 |
-5.3 |
|
|
|
|
|
|
|
|
|
|
|
|
-30 |
|
|
|
|
|
|
|
|
|
||||||||||||
Financials |
18.4% |
-2.1 |
-1.3 |
-1.4 |
-11.7 |
-11.7 |
28.8 |
9.2 |
-21.1 |
2.1 |
-7.0 |
|
|
|
|
|
|
|
|
|
|
|
|
-35 |
|
|
|
|
|
|
|
|
|
||||||||||||
IT |
10.5% |
-4.1 |
-13.0 |
-17.4 |
-20.6 |
-20.6 |
58.6 |
15.0 |
-8.7 |
8.1 |
12.2 |
|
|
|
|
|
|
|
|
|
|
|
|
-40 |
|
|
|
|
|
|
|
|
|
||||||||||||
|
|
|
|
|
|
|
|
|
|
|
|
|
|
Industrials |
|
Materials Communications |
Financials |
|
Energy |
|
|
|
Energy |
5.0% |
-5.6 |
-11.4 |
0.0 |
0.8 |
0.8 |
17.2 |
32.5 |
-19.7 |
-29.4 |
-13.6 |
|
Utilities |
Cons.Staples |
RealEstate |
IT |
Cons.Disc. |
Healthcare |
||||
Healthcare |
3.2% |
0.3 |
2.4 |
-4.5 |
-6.4 |
-6.4 |
22.6 |
-9.9 |
2.5 |
na |
na |
|
||||||||||
Cons. Disc. |
10.4% |
-7.1 |
-13.8 |
-23.1 |
-33.3 |
-33.3 |
38.5 |
-0.4 |
-12.6 |
-3.1 |
4.3 |
|
|
|
|
|
|
|
|
|
|
|
Healthcare |
4.5% |
-7.9 |
-16.3 |
-22.5 |
-21.5 |
-21.5 |
31.4 |
-8.3 |
-6.0 |
18.2 |
8.0 |
|
|
|
|
|
|
|
|
|
|
|
FM Sectors |
|
|
|
|
|
|
|
|
|
|
|
|
|
|
|
|
|
|
|
|
|
|
Materials |
5.7% |
-0.3 |
-9.0 |
-14.5 |
-18.9 |
-18.9 |
13.9 |
9.7 |
-8.2 |
na |
na |
|
|
|
|
|
|
|
|
|
|
|
Financials |
44.4% |
-1.8 |
-2.3 |
-4.3 |
-16.3 |
-16.3 |
29.2 |
-1.1 |
-1.4 |
na |
na |
|
MSCI FM Sector Index performance ($) |
|
|
|
||||||
Cons. Staples |
9.3% |
-2.1 |
-7.2 |
-12.1 |
-22.6 |
-22.6 |
34.4 |
-33.4 |
-2.3 |
na |
na |
|
10 |
|
FM sector performance, 1m ($) |
|
|
|||||
Industrials |
4.5% |
-2.8 |
-4.1 |
-4.5 |
-15.1 |
-15.1 |
29.8 |
6.7 |
-3.9 |
na |
na |
|
0 |
|
FM sector performance, YtD ($) |
|
|
|||||
Communications |
12.2% |
-3.6 |
-6.8 |
-8.5 |
-20.6 |
-20.6 |
18.0 |
13.0 |
-2.2 |
na |
na |
|
-10 |
|
|
|
|
|
|
|
|
|
Cons. Disc. |
1.5% |
-4.6 |
-16.4 |
-27.9 |
-36.6 |
-36.6 |
-50.7 |
19.5 |
-2.0 |
na |
na |
|
|
|
|
|
|
|
|
|
|
|
|
-20 |
|
|
|
|
|
|
|
|
|
||||||||||||
Real Estate |
8.3% |
-5.3 |
-5.3 |
-9.4 |
-8.3 |
-8.3 |
20.7 |
7.3 |
na |
na |
na |
|
|
|
|
|
|
|
|
|
|
|
|
-30 |
|
|
|
|
|
|
|
|
|
||||||||||||
Utilities |
3.9% |
-6.4 |
-2.1 |
-9.6 |
-47.9 |
-47.9 |
60.3 |
15.6 |
-4.3 |
na |
na |
|
|
|
|
|
|
|
|
|
|
|
|
|
|
|
|
|
|
|
|
|
|
||||||||||||
Energy |
5.4% |
-9.5 |
-10.5 |
-2.8 |
-29.6 |
-29.6 |
38.7 |
4.1 |
-9.5 |
na |
na |
|
-40 |
|
|
|
|
|
|
|
|
|
EM largest 10 country sectors |
|
|
|
|
|
|
|
|
|
|
|
-50 |
|
|
|
|
|
|
|
|
|
|
Malaysia Communications |
4.3% |
5.9 |
-9.9 |
-0.8 |
-24.5 |
-24.5 |
18.5 |
-19.3 |
-24.8 |
1.9 |
-5.9 |
|
-60 |
|
|
|
|
|
|
|
|
|
|
|
-0.6 |
|
-1.2 |
-10.3 |
-10.3 |
15.2 |
|
|
-23.4 |
|
|
|
Financials |
Cons.Staples |
Industrials |
Communications |
|
|
Utilities |
Energy |
|
Korea Industrials |
4.6% |
-9.0 |
-3.6 |
-18.6 |
-4.2 |
|
Healthcare |
Materials |
Cons.Disc. |
RealEstate |
||||||||||||
China Industrials |
7.6% |
-3.9 |
-8.6 |
-6.9 |
-16.8 |
-16.8 |
16.3 |
-11.6 |
-8.5 |
6.9 |
5.2 |
|
||||||||||
Taiwan IT |
6.5% |
-0.7 |
-15.3 |
-11.0 |
-16.2 |
-16.2 |
29.1 |
18.4 |
-15.1 |
18.4 |
2.9 |
|
|
|
|
|
|
|
|
|
|
|
China Real Estate |
2.8% |
-0.9 |
1.1 |
-10.3 |
-14.9 |
-14.9 |
97.1 |
-14.6 |
na |
na |
na |
|
|
|
|
|
|
|
|
|
|
|
S Africa Financials |
2.6% |
-2.2 |
-1.7 |
-2.0 |
-20.7 |
-20.7 |
33.1 |
24.1 |
-32.0 |
10.7 |
-11.1 |
|
|
|
|
|
|
|
|
|
|
|
China Financials |
3.8% |
-4.4 |
-7.0 |
-9.1 |
-16.4 |
-16.4 |
28.8 |
-3.5 |
-12.6 |
14.1 |
-3.6 |
|
|
|
|
|
|
|
|
|
|
|
Czech Financials |
1.9% |
-4.9 |
-10.6 |
-8.9 |
-14.1 |
-14.1 |
23.0 |
-15.2 |
-3.8 |
-6.6 |
5.5 |
|
|
|
|
|
|
|
|
|
|
|
China Materials |
1.8% |
-6.6 |
-15.8 |
-18.5 |
-21.6 |
-21.6 |
50.0 |
17.5 |
-21.0 |
-0.5 |
-16.0 |
|
|
|
|
|
|
|
|
|
|
|
China Cons. Disc. |
2.6% |
-11.3 |
-20.6 |
-35.1 |
-39.6 |
-39.6 |
61.6 |
-9.7 |
-4.9 |
-9.4 |
-1.2 |
|
|
|
|
|
|
|
|
|
|
|
EMEA largest country-sectors (weight in MSCI EMEA >1%) |
|
|
|
|
|
|
|
|
|
|
|
|
|
|
|
|
|
|
||||
S Africa Materials |
6.4% |
7.1 |
-9.5 |
-7.8 |
-13.5 |
-13.5 |
16.4 |
35.3 |
-44.3 |
-24.4 |
-46.4 |
|
|
|
|
|
|
|
|
|
|
|
Qatar Real Estate |
2.0% |
3.0 |
20.1 |
44.8 |
10.3 |
10.3 |
-15.3 |
-15.8 |
na |
na |
na |
|
|
|
|
|
|
|
|
|
|
|
Poland Energy |
1.3% |
2.4 |
6.4 |
29.8 |
1.1 |
1.1 |
48.6 |
14.4 |
16.2 |
-11.7 |
-9.3 |
|
|
|
|
|
|
|
|
|
|
|
Poland Communications |
4.1% |
2.3 |
-5.0 |
-15.6 |
-39.1 |
-39.1 |
18.3 |
-21.5 |
-28.8 |
-27.5 |
-17.9 |
|
|
|
|
|
|
|
|
|
|
|
Poland Materials |
2.5% |
0.7 |
-1.6 |
-5.0 |
-32.2 |
-32.2 |
46.0 |
5.4 |
-31.4 |
-27.7 |
-29.7 |
|
|
|
|
|
|
|
|
|
|
|
Poland Financials |
9.2% |
0.1 |
-4.0 |
4.2 |
-16.4 |
-16.4 |
59.5 |
-7.9 |
-33.6 |
-16.5 |
14.0 |
|
|
|
|
|
|
|
|
|
|
|
Qatar Financials |
1.6% |
-1.5 |
8.3 |
22.8 |
32.8 |
32.8 |
-12.6 |
3.7 |
-17.3 |
24.4 |
20.3 |
|
|
|
|
|
|
|
|
|
|
|
S Africa Real Estate |
2.6% |
-2.1 |
-4.9 |
-9.0 |
-35.6 |
-35.6 |
14.3 |
-1.7 |
na |
na |
na |
|
|
|
|
|
|
|
|
|
|
|
S Africa Financials |
15.0% |
-2.2 |
-1.7 |
-2.0 |
-20.7 |
-20.7 |
33.1 |
24.1 |
-32.0 |
10.7 |
-11.1 |
|
|
|
|
|
|
|
|
|
|
|
Russia Materials |
1.8% |
-2.5 |
-2.9 |
-0.8 |
-3.4 |
-3.4 |
3.3 |
49.2 |
-8.6 |
-30.9 |
-23.3 |
|
|
|
|
|
|
|
|
|
|
|
S Africa Cons. Staples |
2.5% |
-2.7 |
-2.0 |
-11.9 |
-28.6 |
-28.6 |
28.3 |
21.2 |
-33.7 |
4.7 |
-32.5 |
|
|
|
|
|
|
|
|
|
|
|
Russia Energy |
3.9% |
-3.2 |
-10.4 |
1.8 |
16.1 |
16.1 |
-3.9 |
47.1 |
-3.3 |
-45.0 |
-5.3 |
|
|
|
|
|
|
|
|
|
|
|
S Africa Cons. Disc. |
3.8% |
-3.9 |
-9.7 |
-22.2 |
-31.3 |
-31.3 |
50.7 |
5.0 |
-3.5 |
18.9 |
21.2 |
|
|
|
|
|
|
|
|
|
|
|
Turkey Cons. Disc. |
5.6% |
-4.6 |
4.2 |
-24.0 |
-49.1 |
-49.1 |
22.2 |
8.7 |
-20.2 |
17.2 |
-8.6 |
|
|
|
|
|
|
|
|
|
|
|
Czech Financials |
10.8% |
-4.9 |
-10.6 |
-8.9 |
-14.1 |
-14.1 |
23.0 |
-15.2 |
-3.8 |
-6.6 |
5.5 |
|
|
|
|
|
|
|
|
|
|
|
Turkey Industrials |
2.9% |
-5.6 |
-2.3 |
-5.4 |
-35.5 |
-35.5 |
55.8 |
-15.4 |
-29.4 |
23.1 |
-5.9 |
|
|
|
|
|
|
|
|
|
|
|
S Africa Healthcare |
2.6% |
-5.8 |
-8.0 |
-31.6 |
-41.2 |
-41.2 |
3.1 |
9.7 |
-35.0 |
24.4 |
12.8 |
|
|
|
|
|
|
|
|
|
|
|
Greece Cons. Disc. |
1.2% |
-6.0 |
-11.0 |
-21.7 |
-36.5 |
-36.5 |
31.3 |
21.1 |
-18.8 |
-19.2 |
82.8 |
|
|
|
|
|
|
|
|
|
|
|
Turkey Financials |
2.1% |
-6.1 |
15.8 |
-23.7 |
-51.1 |
-51.1 |
22.1 |
-9.6 |
-38.6 |
19.3 |
-37.7 |
|
|
|
|
|
|
|
|
|
|
|
UAE Real Estate |
2.9% |
-7.3 |
-15.2 |
-17.8 |
-35.2 |
-35.2 |
-6.0 |
-1.7 |
na |
na |
na |
|
|
|
|
|
|
|
|
|
|
|
Note: $ performance of MSCI sector indices, sorted by last month's returns
Source: Bloomberg
102
vk.com/id446425943
Renaissance Capital
14 January 2019
ESG
Valuation watch - key metrics
|
Price/Earnings (x) |
|
|
|
Dividend yield |
|
Price/Book (x) |
Return on Equity |
|
EPS Growth |
|
|
|||||
Country |
T12M |
12MF |
17 |
18E |
19E |
T12M |
18E |
19E |
T12M |
12MF |
T12M |
18E |
19E |
16 |
17 |
18E |
19E |
EM |
12.0 |
11.0 |
12.2 |
11.2 |
10.0 |
2.8% |
3.2% |
3.6% |
1.5 |
1.4 |
13% |
12% |
13% |
17% |
25% |
10% |
7% |
Brazil |
17.0 |
11.8 |
19.1 |
14.6 |
11.9 |
3.5% |
3.4% |
4.1% |
2.0 |
1.8 |
12% |
14% |
16% |
-3% |
6% |
16% |
15% |
Chile |
17.2 |
15.4 |
21.1 |
15.8 |
14.4 |
3.0% |
2.9% |
3.0% |
1.8 |
1.7 |
10% |
10% |
11% |
13% |
16% |
23% |
9% |
China |
11.5 |
10.3 |
13.4 |
11.9 |
10.4 |
3.3% |
2.7% |
3.0% |
1.5 |
1.3 |
13% |
15% |
13% |
3% |
26% |
12% |
14% |
Colombia |
12.7 |
11.3 |
15.6 |
11.4 |
11.2 |
3.0% |
3.5% |
4.1% |
1.3 |
1.2 |
10% |
12% |
13% |
55% |
10% |
44% |
3% |
Czech |
14.0 |
13.5 |
13.1 |
14.2 |
13.7 |
6.8% |
5.5% |
5.7% |
1.4 |
1.3 |
10% |
10% |
10% |
-13% |
-1% |
-8% |
4% |
Egypt |
7.7 |
8.3 |
10.4 |
10.1 |
8.7 |
2.4% |
3.3% |
4% |
1.3 |
2.2 |
17% |
31% |
29% |
42% |
40% |
4% |
16% |
Greece |
17.4 |
13.8 |
15.2 |
14.9 |
12.4 |
4.1% |
4.6% |
5.0% |
0.8 |
0.8 |
5% |
5% |
6% |
28% |
-14% |
14% |
9% |
Hungary |
10.5 |
10.0 |
10.8 |
10.8 |
10.7 |
2.3% |
2.4% |
2.7% |
1.5 |
1.3 |
14% |
15% |
14% |
86% |
27% |
0% |
1% |
India |
20.2 |
17.3 |
22.2 |
19.2 |
16.1 |
1.6% |
1.6% |
1.8% |
2.9 |
2.5 |
14% |
16% |
16% |
9% |
14% |
12% |
17% |
Indonesia |
16.9 |
15.1 |
18.8 |
16.5 |
14.7 |
2.5% |
2.5% |
2.8% |
2.8 |
2.4 |
16% |
17% |
17% |
1% |
18% |
14% |
12% |
Malaysia |
17.2 |
15.7 |
17.3 |
17.4 |
15.6 |
3.5% |
3.4% |
3.4% |
1.7 |
1.5 |
10% |
10% |
10% |
6% |
4% |
-1% |
11% |
Mexico |
18.0 |
13.6 |
20.6 |
16.4 |
14.0 |
2.9% |
2.8% |
3.1% |
2.1 |
1.8 |
12% |
14% |
15% |
30% |
13% |
24% |
18% |
Pakistan |
9.2 |
7.1 |
8.9 |
9.3 |
7.0 |
6.3% |
6.5% |
7.6% |
1.2 |
1.1 |
13% |
12% |
16% |
-12% |
-6% |
-4% |
32% |
Peru |
16.4 |
13.8 |
16.9 |
15.8 |
13.7 |
2.0% |
2.6% |
3.0% |
2.4 |
2.1 |
15% |
15% |
16% |
14% |
21% |
3% |
12% |
Philippines |
19.5 |
16.9 |
20.3 |
18.3 |
16.2 |
1.6% |
1.6% |
1.7% |
2.1 |
1.9 |
11% |
12% |
12% |
5% |
7% |
11% |
13% |
Poland |
12.6 |
11.8 |
12.0 |
12.3 |
11.6 |
2.9% |
2.8% |
3.2% |
1.4 |
1.2 |
11% |
11% |
11% |
-7% |
26% |
-3% |
8% |
Qatar |
15.0 |
13.4 |
16.1 |
14.4 |
13.2 |
3.5% |
3.7% |
3.9% |
2.0 |
2.0 |
13% |
16% |
16% |
-1% |
3% |
11% |
6% |
Russia |
5.7 |
5.6 |
8.1 |
5.3 |
5.1 |
6.2% |
6.8% |
7.4% |
0.8 |
0.8 |
15% |
16% |
15% |
18% |
4% |
48% |
5% |
S Africa |
16.6 |
13.2 |
18.7 |
15.3 |
13.1 |
3.3% |
3.3% |
3.6% |
2.0 |
1.8 |
12% |
15% |
15% |
-11% |
11% |
22% |
17% |
Korea |
7.3 |
8.5 |
7.8 |
6.9 |
7.7 |
2.3% |
2.7% |
2.9% |
0.9 |
0.8 |
12% |
13% |
11% |
8% |
51% |
13% |
-10% |
Taiwan |
11.7 |
12.9 |
13.3 |
12.4 |
12.3 |
4.8% |
4.7% |
4.9% |
1.6 |
1.5 |
13% |
13% |
12% |
4% |
8% |
10% |
2% |
Thailand |
14.1 |
13.8 |
15.0 |
14.7 |
13.8 |
3.1% |
3.1% |
3.2% |
2.0 |
1.8 |
14% |
14% |
13% |
3% |
14% |
1% |
7% |
Turkey |
6.3 |
6.2 |
7.4 |
6.6 |
6.3 |
5.5% |
5.1% |
6.0% |
1.0 |
0.8 |
15% |
16% |
13% |
18% |
42% |
4% |
3% |
UAE |
9.9 |
9.0 |
10.2 |
9.5 |
8.8 |
6.2% |
5.5% |
5.8% |
1.3 |
1.2 |
14% |
14% |
13% |
6% |
4% |
8% |
7% |
Frontier |
11.3 |
9.5 |
11.9 |
9.7 |
Argentina |
10.9 |
11.6 |
26.3 |
11.1 |
Bahrain |
9.6 |
8.6 |
8.8 |
8.8 |
Bangladesh |
17.7 |
14.4 |
17.9 |
15.7 |
Croatia |
10.7 |
13.6 |
14.0 |
13.6 |
Estonia |
18.9 |
14.8 |
15.8 |
18.4 |
Ivory Coast |
6.1 |
|
6.4 |
|
Jordan |
10.7 |
7.2 |
11.4 |
8.2 |
Kazakhstan |
7.5 |
5.0 |
8.6 |
6.5 |
Kenya |
7.8 |
8.4 |
10.3 |
9.4 |
Kuwait |
15.9 |
7.5 |
14.3 |
15.1 |
Lebanon |
4.8 |
|
3.9 |
5.6 |
Lithuania |
6.0 |
7.0 |
9.5 |
5.4 |
Mauritius |
8.4 |
7.3 |
9.4 |
8.2 |
Morocco |
18.8 |
16.4 |
18.1 |
18.2 |
Nigeria |
6.0 |
5.7 |
6.7 |
6.3 |
Oman |
7.5 |
6.2 |
7.1 |
7.4 |
Romania |
6.8 |
6.6 |
7.2 |
6.6 |
Saudi Arabia |
15.0 |
14.1 |
16.3 |
14.9 |
Senegal |
12.3 |
|
10.7 |
9.4 |
Serbia |
14.0 |
2.7 |
6.0 |
3.8 |
Slovenia |
10.8 |
10.2 |
11.5 |
11.1 |
Sri Lanka |
10.3 |
12.1 |
14.0 |
11.1 |
Tunisia |
15.7 |
|
15.8 |
14.9 |
Vietnam |
21.8 |
16.4 |
25.3 |
19.0 |
Note: excludes companies with negative earnings, except
EM 12M fwd P/E vs 10yr average
 12M fwd P/E
  10 yr avg
20
18
16
14 12 10 8 6 4 2 0
EM
Colombia
Poland
Brazil
Taiwan
S Africa
Qatar
Czech
Mexico
Peru
Thailand
Greece
Indonesia
Chile
Malaysia
Philippines
India
8.1 |
3.8% |
4.9% |
5.0% |
1.8 |
1.3 |
16% |
17% |
17% |
-20% |
18% |
3% |
16% |
10.8 |
3.9% |
1.9% |
2.4% |
2.3 |
2.2 |
21% |
21% |
15% |
29% |
44% |
118% |
1% |
8.0 |
6.8% |
6.8% |
7.0% |
1.2 |
1.3 |
13% |
9% |
10% |
5% |
12% |
-5% |
9% |
13.3 |
2.4% |
2.0% |
2.6% |
3.7 |
3.1 |
21% |
24% |
24% |
33% |
24% |
14% |
18% |
13.5 |
3.8% |
3.6% |
3.6% |
0.8 |
1.1 |
8% |
8% |
8% |
24% |
-13% |
2% |
0% |
14.1 |
2.9% |
8.4% |
5.2% |
1.0 |
1.0 |
5% |
5% |
7% |
-18% |
-6% |
-14% |
30% |
|
7.5% |
|
|
1.6 |
|
26% |
|
|
|
|
|
|
7.3 |
5.0% |
5.4% |
5.7% |
0.9 |
0.6 |
9% |
7% |
8% |
-31% |
7% |
29% |
13% |
5.7 |
6.5% |
5.5% |
8.8% |
1.5 |
1.2 |
20% |
24% |
24% |
-17% |
30% |
33% |
14% |
8.5 |
5.6% |
6.1% |
6.6% |
2.8 |
2.2 |
36% |
29% |
30% |
3% |
11% |
10% |
11% |
13.0 |
3.4% |
7.8% |
9.7% |
1.7 |
0.9 |
11% |
11% |
12% |
9% |
4% |
-5% |
16% |
3.9 |
11.6% |
0.0% |
0.0% |
0.6 |
0.5 |
14% |
|
|
13% |
-1% |
16% |
4% |
6.9 |
3.0% |
2.4% |
3.7% |
1.0 |
0.8 |
17% |
19% |
13% |
83% |
-32% |
52% |
-21% |
7.3 |
3.7% |
3.8% |
4.3% |
1.3 |
1.1 |
15% |
15% |
15% |
15% |
1% |
14% |
13% |
17.2 |
3.8% |
3.9% |
4.0% |
3.4 |
2.5 |
18% |
17% |
17% |
11% |
10% |
2% |
6% |
5.6 |
6.8% |
7.0% |
7.5% |
1.2 |
0.5 |
20% |
19% |
20% |
13% |
32% |
13% |
8% |
6.5 |
7.0% |
6.7% |
7.1% |
0.8 |
0.6 |
11% |
10% |
11% |
-7% |
-10% |
-4% |
14% |
6.7 |
10.4% |
9.2% |
9.0% |
1.0 |
0.9 |
15% |
15% |
14% |
-35% |
35% |
9% |
-1% |
13.8 |
4.0% |
3.2% |
4.0% |
1.9 |
1.8 |
13% |
11% |
12% |
-1% |
11% |
9% |
8% |
8.8 |
9.8% |
9.7% |
10.3% |
3.1 |
2.2 |
25% |
26% |
26% |
-4% |
-15% |
13% |
7% |
3.4 |
6.3% |
|
|
1.9 |
|
14% |
|
|
|
|
|
|
10.4 |
5.6% |
5.7% |
6.0% |
1.2 |
1.1 |
11% |
10% |
11% |
-21% |
30% |
4% |
7% |
12.3 |
4.0% |
4.3% |
4.5% |
1.1 |
1.0 |
11% |
9% |
9% |
7% |
2% |
26% |
-10% |
13.5 |
3.0% |
3.0% |
3.1% |
3.6 |
|
23% |
21% |
21% |
31% |
14% |
2% |
9% |
16.1 |
2.9% |
2.0% |
2.2% |
3.6 |
3.3 |
17% |
22% |
22% |
48% |
21% |
11% |
19% |
12M fwd P/E, which are Bloomberg convention. EM and Frontier aggregate EPS growth is Bloomberg convention |
|
|||||||||||
|
|
|
|
FM 12M fwd P/E vs 10yr average |
|
|
|
|
|
|||
|
|
|
|
|
|
|
12M fwd P/E |
10 yr avg |
|
|
|
|
|
|
|
|
18 |
|
|
|
|
|
|
|
|
|
|
|
|
16 |
|
|
|
|
|
|
|
|
|
|
|
|
14 |
|
|
|
|
|
|
|
|
|
|
|
|
12 |
|
|
|
|
|
|
|
|
|
|
|
|
10 |
|
|
|
|
|
|
|
|
|
|
|
|
8 |
|
|
|
|
|
|
|
|
|
|
|
|
6 |
|
|
|
|
|
|
|
|
|
|
|
|
4 |
|
|
|
|
|
|
|
|
|
|
|
|
2 |
|
|
|
|
|
|
|
|
|
|
|
|
0 |
|
|
|
|
|
|
|
|
China Hungary UAE Korea Egypt Pakistan Turkey Russia |
|
Vietnam Morocco |
Estonia Bangladesh |
Saudi Arabia Croatia |
Sri Lanka Argentina Slovenia |
Frontier Bahrain |
Kenya Kuwait Mauritius |
Jordan Lithuania |
Romania Oman Nigeria |
Kazakhstan |
||
Source: Bloomberg
103

vk.com/id446425943
Renaissance Capital
14 January 2019
ESG
Valuation watch - 12M fwd P/E focus
Country |
Cons. Disc. |
Cons. Stples |
Financials |
Energy |
Healthcare |
Industrials |
IT |
Materials |
Real Estate |
Telecoms |
Utilities |
Overall |
5yr avg |
10yr avg |
S.N P/E* |
EM |
16.5 |
21.6 |
8.5 |
7.6 |
22.1 |
11.2 |
10.2 |
9.4 |
6.6 |
19.8 |
11.4 |
11.0 |
11.6 |
11.2 |
11.0 |
India |
18.0 |
40.8 |
17.3 |
11.1 |
20.5 |
20.0 |
16.7 |
13.3 |
|
|
10.2 |
17.3 |
16.7 |
15.6 |
17.4 |
Philippines |
38.0 |
26.5 |
14.1 |
|
|
16.2 |
|
|
21.5 |
12.6 |
14.9 |
16.9 |
18.1 |
16.8 |
15.4 |
Malaysia |
12.2 |
27.3 |
12.5 |
28.2 |
33.2 |
14.8 |
|
15.7 |
13.8 |
23.0 |
13.6 |
15.7 |
15.7 |
15.1 |
15.8 |
Chile |
22.4 |
17.7 |
15.7 |
14.5 |
|
21.1 |
|
15.3 |
|
28.6 |
11.5 |
15.4 |
15.6 |
15.7 |
17.5 |
Indonesia |
13.6 |
25.0 |
14.4 |
8.1 |
29.0 |
17.3 |
|
12.2 |
12.2 |
16.8 |
15.1 |
15.1 |
15.0 |
14.1 |
14.0 |
Greece |
11.5 |
|
36.3 |
|
|
|
|
15.8 |
|
15.8 |
|
13.8 |
19.8 |
15.1 |
18.6 |
Thailand |
25.0 |
24.1 |
10.1 |
10.4 |
30.6 |
34.1 |
13.7 |
9.2 |
20.6 |
19.0 |
18.4 |
13.8 |
13.9 |
12.5 |
14.1 |
Peru |
|
|
13.2 |
|
|
|
|
15.7 |
|
|
|
13.8 |
13.2 |
12.8 |
17.1 |
Mexico |
20.1 |
21.2 |
8.6 |
|
|
14.7 |
|
9.4 |
10.0 |
15.0 |
13.6 |
13.6 |
17.2 |
16.2 |
11.3 |
Czech |
|
|
11.1 |
|
|
|
|
|
|
|
17.9 |
13.5 |
13.8 |
12.1 |
14.3 |
Qatar |
|
|
12.9 |
|
|
17.0 |
|
|
|
12.1 |
12.8 |
13.4 |
12.6 |
11.6 |
13.1 |
S Africa |
15.1 |
18.1 |
10.9 |
5.2 |
11.3 |
13.9 |
|
10.0 |
10.2 |
19.2 |
|
13.2 |
14.9 |
13.2 |
11.2 |
Taiwan |
15.4 |
23.8 |
10.2 |
16.6 |
235.2 |
14.3 |
12.9 |
12.3 |
|
22.6 |
|
12.9 |
13.2 |
14.2 |
13.9 |
Brazil |
23.6 |
20.0 |
12.0 |
8.6 |
16.0 |
21.4 |
9.6 |
8.4 |
20.2 |
13.6 |
12.6 |
11.8 |
11.7 |
11.2 |
12.5 |
Poland |
20.5 |
25.2 |
12.2 |
10.3 |
|
|
|
7.0 |
|
26.2 |
|
11.8 |
12.3 |
11.9 |
13.5 |
Colombia |
|
|
10.1 |
10.2 |
|
|
|
31.7 |
|
|
10.3 |
11.3 |
12.5 |
14.8 |
14.6 |
China |
19.3 |
19.0 |
6.0 |
8.8 |
16.9 |
7.8 |
13.2 |
5.9 |
5.1 |
20.5 |
10.4 |
10.3 |
10.8 |
10.8 |
9.3 |
Hungary |
|
|
9.9 |
8.4 |
14.6 |
|
|
|
|
|
|
10.0 |
10.8 |
9.8 |
12.2 |
UAE |
|
|
10.2 |
|
|
11.3 |
|
|
5.0 |
16.2 |
|
9.0 |
12.2 |
10.9 |
11.4 |
Korea |
9.0 |
16.4 |
5.9 |
7.6 |
65.0 |
10.4 |
7.1 |
8.3 |
|
17.6 |
16.1 |
8.5 |
9.5 |
9.5 |
8.4 |
Egypt |
|
8.2 |
8.3 |
|
|
8.4 |
|
|
|
|
|
8.3 |
10.3 |
9.3 |
9.1 |
Pakistan |
|
|
7.9 |
6.0 |
|
|
|
|
|
|
|
7.1 |
8.8 |
7.9 |
9.7 |
Turkey |
9.0 |
18.0 |
4.5 |
6.1 |
|
6.2 |
|
5.3 |
|
8.2 |
|
6.2 |
8.4 |
8.9 |
6.1 |
Russia |
|
12.7 |
4.8 |
5.2 |
|
|
|
8.3 |
|
8.3 |
4.8 |
5.6 |
5.8 |
6.0 |
6.3 |
Frontier |
16.6 |
20.7 |
9.9 |
9.8 |
13.1 |
11.4 |
27.5 |
9.7 |
18.2 |
14.0 |
10.6 |
9.5 |
10.6 |
9.8 |
9.5 |
Vietnam |
|
21.8 |
15.6 |
|
|
9.3 |
|
5.8 |
19.4 |
|
14.3 |
16.4 |
16.4 |
14.0 |
15.2 |
Morocco |
8.9 |
15.5 |
14.9 |
|
|
|
|
20.3 |
|
20.0 |
|
16.4 |
16.5 |
14.9 |
17.3 |
Estonia |
|
|
|
|
|
14.0 |
|
|
|
|
|
14.8 |
10.7 |
9.1 |
11.8 |
Bangladesh |
|
|
13.1 |
|
14.6 |
|
|
|
|
14.3 |
|
14.4 |
13.7 |
13.2 |
16.1 |
Saudi Arabia |
15.6 |
23.0 |
12.5 |
13.7 |
20.1 |
11.7 |
|
13.8 |
23.7 |
18.0 |
15.0 |
14.1 |
13.4 |
12.7 |
14.9 |
Croatia |
14.4 |
|
|
|
|
|
|
|
|
13.1 |
|
13.6 |
12.1 |
11.2 |
11.6 |
Sri Lanka |
|
16.2 |
|
|
|
11.8 |
|
|
|
|
|
12.1 |
12.1 |
13.1 |
11.5 |
Argentina |
22.5 |
|
8.6 |
13.9 |
|
8.9 |
27.5 |
18.6 |
|
12.4 |
8.7 |
11.6 |
10.0 |
8.4 |
11.3 |
Slovenia |
|
|
9.4 |
|
10.3 |
|
|
|
|
|
|
10.2 |
10.8 |
11.6 |
12.7 |
Bahrain |
|
|
8.8 |
|
|
|
|
6.3 |
|
|
|
8.6 |
8.7 |
8.6 |
11.3 |
Kenya |
|
14.6 |
5.0 |
|
|
|
|
|
|
13.0 |
|
8.4 |
11.1 |
10.6 |
7.1 |
Kuwait |
|
|
10.8 |
|
|
|
|
1.1 |
10.2 |
12.6 |
|
7.5 |
11.7 |
11.6 |
7.3 |
Mauritius |
|
|
7.3 |
|
|
|
|
|
|
|
|
7.3 |
10.2 |
9.2 |
10.1 |
Jordan |
|
|
7.2 |
|
|
|
|
|
|
|
|
7.2 |
8.3 |
8.7 |
10.0 |
Lithuania |
|
|
6.8 |
|
|
|
|
|
|
|
|
7.0 |
7.7 |
14.4 |
9.4 |
Romania |
|
|
7.2 |
5.8 |
|
|
|
|
|
|
12.0 |
6.6 |
9.4 |
8.7 |
9.4 |
Oman |
|
|
6.5 |
|
|
|
|
|
|
5.7 |
|
6.2 |
8.5 |
8.8 |
7.8 |
Nigeria |
|
19.4 |
3.8 |
7.3 |
|
|
|
10.9 |
|
|
|
5.7 |
8.1 |
8.5 |
5.7 |
Kazakhstan |
|
|
4.1 |
|
|
|
|
|
|
15.0 |
|
5.0 |
6.7 |
6.4 |
6.0 |
*Sector Neutral P/E |
|
|
|
|
|
|
|
|
|
|
|
|
|
|
|
EM Sector neutral 12M fwd P/E vs actual 12M fwd P/E |
|
|
|
FM Sector neutral 12M fwd P/E vs actual 12M fwd P/E |
|
|
|||||||||
|
Sector neutral 12M fwd P/E |
12M fwd P/E |
|
|
|
Sector neutral 12M fwd P/E |
12M fwd P/E |
|
|||||||
20 |
|
|
|
|
|
|
|
20 |
|
|
|
|
|
|
|
18 |
|
|
|
|
|
|
|
18 |
|
|
|
|
|
|
|
|
|
|
|
|
|
|
16 |
|
|
|
|
|
|
|
|
16 |
|
|
|
|
|
|
|
|
|
|
|
|
|
|
|
|
|
|
|
|
|
|
14 |
|
|
|
|
|
|
|
|
14 |
|
|
|
|
|
|
|
|
|
|
|
|
|
|
|
|
|
|
|
|
|
|
12 |
|
|
|
|
|
|
|
|
12 |
|
|
|
|
|
|
|
|
|
|
|
|
|
|
|
|
|
|
|
|
|
|
10 |
|
|
|
|
|
|
|
|
10 |
|
|
|
|
|
|
|
|
|
|
|
|
|
|
|
|
|
|
|
|
|
|
8 |
|
|
|
|
|
|
|
|
|
|
|
|
|
|
|
|
|
|
|
|
|
|
|
|
8 |
|
|
|
|
|
|
|
6 |
|
|
|
|
|
|
|
6 |
|
|
|
|
|
|
|
4 |
|
|
|
|
|
|
|
4 |
|
|
|
|
|
|
|
2 |
|
|
|
|
|
|
|
2 |
|
|
|
|
|
|
|
0 |
Vietnam SaudiArabia |
Slovenia Estonia Croatia |
SriLanka Bahrain Argentina |
Mauritius Jordan |
|
Oman Kuwait Kenya |
Kazakhstan Nigeria |
|
|
|
|
|
|
|
Morocco Bangladesh |
Frontier Romania Lithuania |
|||||||
Greece Chile India Peru Malaysia Philippines Colombia Czech Thailand Indonesia Taiwan Poland Qatar Brazil Hungary UAE Mexico AfricaS EM Pakistan China Egypt Korea Russia Turkey |
|
||||||||||||||
0 |
|
|
|
|
|
|
|
|
|
|
|
|
|
|
|
MSCI EM vs DM 12M fwd P/E (x)
|
|
EM 12M fwd P/E (x) |
|
|||
18 |
|
DM 12M fwd P/E (x) |
|
|||
16 |
|
|
|
|
|
|
14 |
|
|
|
|
|
|
12 |
|
|
|
|
|
|
10 |
|
|
|
|
|
|
8 |
|
|
|
|
|
|
6 |
|
|
|
|
|
|
4 |
|
|
|
|
|
|
Jan-06 |
Jan-08 |
Jan-10 |
Jan-12 |
Jan-14 |
Jan-16 |
Jan-18 |
MSCI EM 12M fwd P/E (x) prem/disc. to DM |
|
|||||
10% |
|
EM premium/discount to DM |
|
|||
|
|
|
|
|
|
|
0% |
|
|
|
|
|
|
|
|
|
|
|
+1 SD |
|
-10% |
|
|
|
|
|
|
-20% |
|
|
|
|
avg |
|
|
|
|
|
|
|
|
-30% |
|
|
-1 SD |
|
|
|
|
|
|
|
|
|
|
-40% |
|
|
|
|
|
|
Jan-06 |
Jan-07 Jan-08 |
Jan-09 Jan-10 |
Jan-11 Jan-12 |
Jan-13 Jan-14 |
Jan-15 Jan-16 Jan-17 |
Jan-18 Jan-19 |
MSCI FM vs EM 12M fwd P/E (x)
|
|
|
FM 12M fwd P/E (x) |
|
|
||||
14 |
|
|
EM 12M fwd P/E (x) |
|
|
||||
12 |
|
|
|
|
|
|
|
|
|
10 |
|
|
|
|
|
|
|
|
|
8 |
|
|
|
|
|
|
|
|
|
6 |
|
|
|
|
|
|
|
|
|
4 |
|
|
|
|
|
|
|
|
|
Jan-10 |
Jan-11 |
Jan-12 |
Jan-13 |
Jan-14 |
Jan-15 |
Jan-16 |
Jan-17 |
Jan-18 |
Jan-19 |
MSCI FM 12M fwd P/E (x) prem/disc. to EM |
|
|
|||||||
30% |
|
FM premium/discount to EM |
|
|
|||||
|
|
|
|
|
|
|
|
|
|
20% |
|
|
|
|
|
|
|
|
|
10% |
|
|
|
|
|
+1 SD |
|
|
|
|
|
|
|
|
|
|
|
|
|
0% |
|
|
|
|
|
|
|
|
|
-10% |
|
|
|
|
|
avg |
|
|
|
|
|
|
|
|
|
|
|
|
|
-20% |
|
|
|
-1 SD |
|
|
|
|
|
-30% |
|
|
|
|
|
|
|
|
|
Jan-10 |
Jan-11 |
Jan-12 |
Jan-13 |
Jan-14 |
Jan-15 |
Jan-16 |
Jan-17 |
Jan-18 |
Jan-19 |
Source: Bloomberg
104

vk.com/id446425943
Renaissance Capital
14 January 2019
ESG
Top and bottom 30 - EM ($)
|
|
|
|
|
Best/Worst |
12MF |
|
|
|
|
Best/Worst |
12MF |
||
Name |
Ticker |
|
Country |
Sector |
-1m |
P/E (x) |
Name |
Ticker |
|
Country |
Sector |
2018 |
P/E (x) |
|
Viromed |
084990 |
KQ |
Korea |
Healthcare |
29.4 |
|
Tjiwi Kimia |
TKIM IJ |
|
Indonesia |
Materials |
255.7 |
7.0 |
|
China Tower Co-H |
788 HK |
|
China |
Communications |
27.5 |
40.8 |
Fila Korea Ltd |
081660 |
KP |
Korea |
Cons. Disc. |
214.9 |
14.0 |
|
Anglogold Ashanti |
ANG SJ |
S Africa |
Materials |
26.4 |
15.1 |
Yihai Internatio |
1579 HK |
China |
Cons. Staples |
154.2 |
28.2 |
|||
Rural Electrification |
RECL IS |
India |
Financials |
22.4 |
|
China Ding Yi Fe |
612 HK |
|
China |
Financials |
144.4 |
|
||
Amorepacific |
090430 |
KP |
Korea |
Cons. Staples |
22.0 |
24.7 |
Daewoo Shipbldg |
042660 |
KP |
Korea |
Industrials |
136.0 |
15.3 |
|
CP Indonesia |
CPIN IJ |
|
Indonesia |
Cons. Staples |
19.8 |
26.8 |
CP Indonesia |
CPIN IJ |
|
Indonesia |
Cons. Staples |
125.4 |
26.8 |
|
Indiabulls Housing Fin. |
IHFL IS |
|
India |
Financials |
19.4 |
7.1 |
Irb Brasil Resse |
IRBR3 BS |
Brazil |
Financials |
109.6 |
17.3 |
||
Gold Fields |
GFI SJ |
|
S Africa |
Materials |
18.3 |
19.7 |
Indah Kiat Pulp |
INKP IJ |
|
Indonesia |
Materials |
100.1 |
6.9 |
|
Alfa |
ALFAA MM |
Mexico |
Industrials |
18.3 |
10.7 |
Jiayuan Internat |
2768 HK |
China |
Real Estate |
98.9 |
|
|||
Samsung Biologics |
207940 |
KP |
Korea |
Healthcare |
17.5 |
|
Hlb Inc |
028300 |
KQ |
Korea |
Cons. Disc. |
98.6 |
|
|
GAP Airports |
GAPB MM |
Mexico |
Industrials |
17.2 |
17.8 |
Magazine Luiza S |
MGLU3 BS |
Brazil |
Cons. Disc. |
92.7 |
44.5 |
|||
Amplats |
AMS SJ |
S Africa |
Materials |
17.0 |
16.1 |
B2W Cia Digital |
BTOW3 BS |
Brazil |
Cons. Disc. |
75.0 |
|
|||
China First Capi |
1269 |
HK |
China |
Cons. Disc. |
17.0 |
|
Suzano Papel |
SUZB3 BS |
Brazil |
Materials |
73.9 |
7.2 |
||
Perfect World -A |
002624 |
C2 |
China |
Communications |
16.8 |
15.3 |
Cemig (P) |
CMIG4 BS |
Brazil |
Utilities |
72.2 |
10.1 |
||
Telekom Malaysia |
T MK |
|
|
Malaysia |
Communications |
15.4 |
17.4 |
Bukit Asam Tbk P |
PTBA IJ |
Indonesia |
Energy |
63.6 |
9.1 |
|
Hdc Hyundai Deve |
294870 |
KP |
Korea |
Industrials |
15.3 |
|
Alibaba Health |
241 HK |
|
China |
Healthcare |
60.4 |
225.3 |
|
JG Summit |
JGS PM |
Philippines |
Industrials |
15.3 |
16.9 |
Qatar Islamic Bk. |
QIBK QD |
Qatar |
Financials |
57.1 |
14.5 |
|||
Buenaventura |
BVN UN |
Peru |
Materials |
14.7 |
18.0 |
Kingdee Intl Sft |
268 HK |
|
China |
IT |
56.9 |
38.4 |
||
Tsingtao Brew-A |
600600 |
C1 |
China |
Cons. Staples |
14.4 |
26.1 |
Qatar National Bk. |
QNBK QD |
Qatar |
Financials |
55.2 |
12.7 |
||
Amorepacific (P) |
090435 |
KP |
Korea |
Cons. Staples |
14.3 |
|
Ql Resources Bhd |
QLG MK |
Malaysia |
Cons. Staples |
53.8 |
43.6 |
||
Shandong Gold-A |
600547 |
C1 |
China |
Materials |
13.1 |
35.5 |
Posco Chemtech |
003670 |
KQ |
Korea |
Materials |
53.7 |
19.8 |
|
Amorepacific Grp. |
002790 |
KP |
Korea |
Cons. Staples |
12.6 |
25.4 |
Viromed |
084990 |
KQ |
Korea |
Healthcare |
49.4 |
|
|
Ultrapar |
UGPA3 BS |
Brazil |
Energy |
12.5 |
19.7 |
Gs E&C |
006360 |
KP |
Korea |
Industrials |
48.5 |
6.5 |
||
Interglobe Aviat |
INDIGO IS |
India |
Industrials |
12.3 |
19.8 |
China First Capi |
1269 HK |
China |
Cons. Disc. |
47.0 |
|
|||
ASUR |
ASURB MM |
Mexico |
Industrials |
12.1 |
16.9 |
Hyundai E&C |
000720 |
KP |
Korea |
Industrials |
44.5 |
12.1 |
||
Elswedy Electri |
SWDY EC |
Egypt |
Industrials |
12.1 |
8.4 |
Guangdong Investment |
270 HK |
|
China |
Utilities |
44.4 |
18.4 |
||
KEPCO |
015760 |
KP |
Korea |
Utilities |
12.0 |
19.9 |
Walsin Tech |
2492 TT |
Taiwan |
IT |
42.5 |
|
||
China Yangtze-A |
600900 |
C1 |
China |
Utilities |
12.0 |
15.4 |
Novatek |
NVTK LI |
Russia |
Energy |
42.3 |
13.0 |
||
Bharat Petroleum |
BPCL IS |
India |
Energy |
11.9 |
8.2 |
Grupa Lotos |
LTS PW |
Poland |
Energy |
41.6 |
11.0 |
|||
Sise Cam |
SISE TI |
|
Turkey |
Industrials |
11.6 |
6.2 |
Nestle Malaysia |
NESZ MK |
Malaysia |
Cons. Staples |
40.3 |
45.2 |
||
China Galaxy Securities |
6881 |
HK |
China |
Financials |
-15.8 |
10.2 |
Wuhu Shunrong-A |
002555 |
C2 |
China |
Communications |
-56.5 |
11.0 |
|
Brilliance China |
1114 |
HK |
China |
Cons. Disc. |
-15.8 |
3.7 |
China Literature |
772 HK |
|
China |
Communications |
-56.6 |
21.5 |
|
Sinopec |
386 HK |
|
China |
Energy |
-16.0 |
8.7 |
Kingsoft |
3888 HK |
China |
IT |
-56.7 |
17.3 |
||
Shenzhen Salub-A |
002294 |
C2 |
China |
Healthcare |
-16.6 |
12.1 |
Boe Technology-A |
000725 |
C2 |
China |
IT |
-57.0 |
13.9 |
|
Walsin Tech |
2492 |
TT |
Taiwan |
IT |
-17.0 |
|
360 Security T-A |
601360 |
C1 |
China |
IT |
-57.7 |
30.4 |
|
China Taiping |
966 HK |
|
China |
Financials |
-17.1 |
6.5 |
Focus Media In-A |
002027 |
C2 |
China |
IT |
-57.8 |
11.0 |
|
Baozun Inc-Adr |
BZUN UW |
China |
Cons. Disc. |
-17.2 |
20.5 |
O-Film Tech Co-A |
002456 |
C2 |
China |
IT |
-57.8 |
9.0 |
||
Sina Corp |
SINA UW |
China |
Communications |
-17.2 |
16.6 |
Sanan Optoelec-A |
600703 |
C1 |
China |
IT |
-57.9 |
11.1 |
||
Shanghai Pharma |
2607 |
HK |
China |
Healthcare |
-17.6 |
8.4 |
Aspen Pharmacare |
APN SJ |
|
S Africa |
Healthcare |
-58.1 |
8.2 |
|
AAC Tech |
2018 |
HK |
China |
IT |
-18.1 |
10.2 |
Tus-Sound Envi-A |
000826 |
C2 |
China |
Industrials |
-58.3 |
8.0 |
|
Jiangsu Hengru-A |
600276 |
C1 |
China |
Healthcare |
-18.5 |
40.1 |
Telekom Malaysia |
T MK |
|
Malaysia |
Communications |
-58.5 |
17.4 |
|
O-Film Tech Co-A |
002456 |
C2 |
China |
IT |
-19.0 |
9.0 |
Kroton Educacional |
KROT3 BS |
Brazil |
Cons. Disc. |
-58.8 |
9.0 |
||
Damac |
DAMAC DB |
UAE |
Real Estate |
-19.2 |
5.9 |
Win Semiconductors |
3105 TT |
Taiwan |
IT |
-59.5 |
17.7 |
|||
Sanan Optoelec-A |
600703 |
C1 |
China |
IT |
-19.8 |
11.1 |
Baic Motor-H |
1958 HK |
China |
Cons. Disc. |
-59.5 |
4.6 |
||
Wuhu Shunrong-A |
002555 |
C2 |
China |
Communications |
-20.1 |
11.0 |
China Medical |
867 HK |
|
China |
Healthcare |
-60.1 |
7.1 |
|
Sihuan Pharma |
460 HK |
|
China |
Healthcare |
-21.3 |
7.5 |
Hangzhou Robam-A |
002508 |
C2 |
China |
Cons. Disc. |
-60.3 |
11.7 |
|
Huadong Medici-A |
000963 |
C2 |
China |
Healthcare |
-21.6 |
13.3 |
Kangmei Pharma-A |
600518 |
C1 |
China |
Healthcare |
-61.0 |
6.1 |
|
Gds Hldgs - Adr |
GDS UQ |
China |
IT |
-21.7 |
|
China Huarong |
2799 HK |
China |
Financials |
-61.3 |
4.2 |
|||
Zhongan Online-H |
6060 |
HK |
China |
Financials |
-21.9 |
|
Anxin Trust Co-A |
600816 |
C1 |
China |
Financials |
-62.1 |
13.3 |
|
Genscript Biotec |
1548 |
HK |
China |
Healthcare |
-22.4 |
69.8 |
Goertek Inc -A |
002241 |
C2 |
China |
IT |
-62.5 |
12.7 |
|
Globalwafers |
6488 |
TT |
Taiwan |
IT |
-22.6 |
7.9 |
Tata Motors |
TTMT IS |
India |
Cons. Disc. |
-63.4 |
9.1 |
||
Wuxi Biologics C |
2269 |
HK |
China |
Healthcare |
-23.6 |
61.5 |
Resilient |
RES SJ |
|
S Africa |
Real Estate |
-63.8 |
|
|
Momo |
MOMO UW |
China |
Communications |
-24.2 |
9.5 |
Zhongan Online-H |
6060 HK |
China |
Financials |
-63.9 |
|
|||
Sino Biopharm |
1177 |
HK |
China |
Healthcare |
-27.8 |
17.4 |
Citic Guoan-A |
000839 |
C2 |
China |
Communications |
-66.8 |
|
|
Ssy Group Ltd |
2005 HK |
China |
Healthcare |
-27.8 |
14.9 |
AAC Tech |
2018 HK |
China |
IT |
-67.5 |
10.2 |
|||
CSPC Pharma |
1093 |
HK |
China |
Healthcare |
-28.7 |
16.2 |
Cielo |
CIEL3 BS |
Brazil |
IT |
-67.7 |
9.7 |
||
Meitu |
1357 |
HK |
China |
IT |
-32.7 |
|
Idea Cellular |
IDEA IS |
|
India |
Communications |
-68.0 |
|
|
Hutchison Ch-Adr |
HCM UW |
China |
Healthcare |
-33.0 |
|
Fortress Income B |
FFB SJ |
|
S Africa |
Real Estate |
-70.4 |
7.8 |
||
Tatung |
2371 |
TT |
Taiwan |
Cons. Disc. |
-35.4 |
|
Brilliance China |
1114 HK |
China |
Cons. Disc. |
-72.2 |
|
||
Fullshare Holdings |
607 HK |
|
China |
Industrials |
-39.2 |
|
Meitu |
1357 HK |
China |
IT |
-79.9 |
|
||
Source: Bloomberg
105

vk.com/id446425943
Renaissance Capital
14 January 2019
ESG
Top and bottom 30 - EMEA ($)
|
|
|
Best/Worst |
12MF |
|
|
|
Best/Worst |
12MF |
||
Name |
Ticker |
Country |
Sector |
-1m |
P/E (x) |
Name |
Ticker |
Country |
Sector |
2018 |
P/E (x) |
Anglogold Ashanti |
ANG SJ |
S Africa |
Materials |
26.4 |
15.1 |
Qatar Islamic Bk. |
QIBK QD |
Qatar |
Financials |
57.1 |
14.5 |
Gold Fields |
GFI SJ |
S Africa |
Materials |
18.3 |
19.7 |
Qatar National Bk. |
QNBK QD |
Qatar |
Financials |
55.2 |
12.7 |
Amplats |
AMS SJ |
S Africa |
Materials |
17.0 |
16.1 |
Novatek |
NVTK LI |
Russia |
Energy |
42.3 |
13.0 |
Elswedy Electri |
SWDY EC |
Egypt |
Industrials |
12.1 |
8.4 |
Grupa Lotos |
LTS PW |
Poland |
Energy |
41.6 |
11.0 |
Sise Cam |
SISE TI |
Turkey |
Industrials |
11.6 |
6.2 |
CD Projekt |
CDR PW |
Poland |
Communications |
38.6 |
41.5 |
Kumba Iron Ore |
KIO SJ |
S Africa |
Materials |
10.7 |
11.5 |
Industries Qatar |
IQCD QD |
Qatar |
Industrials |
38.1 |
17.0 |
Grupa Lotos |
LTS PW |
Poland |
Energy |
8.8 |
11.0 |
First Abu Dhabi Bk. |
FAB DH |
UAE |
Financials |
37.6 |
11.9 |
PGN |
PGN PW |
Poland |
Energy |
8.0 |
10.4 |
Comm. Bk. Qatar |
CBQK QD |
Qatar |
Financials |
36.7 |
10.8 |
Telkom SA |
TKG SJ |
S Africa |
Communications |
8.0 |
11.0 |
Amplats |
AMS SJ |
S Africa |
Materials |
31.1 |
16.1 |
Polyus |
PLZL RX |
Russia |
Materials |
8.0 |
8.3 |
Tatneft |
TATN RX |
Russia |
Energy |
27.5 |
7.4 |
Polymetal |
POLY RX |
Russia |
Materials |
5.8 |
9.6 |
Barwa |
BRES QD |
Qatar |
Real Estate |
25.0 |
|
Is Bank |
ISCTR TI |
Turkey |
Financials |
5.3 |
5.0 |
Lukoil |
LKOH RX |
Russia |
Energy |
24.0 |
5.8 |
Motor Oil-Hellas |
MOH GA |
Greece |
Energy |
5.0 |
8.4 |
Rosneft |
ROSN RX |
Russia |
Energy |
22.8 |
5.6 |
MBank |
MBK PW |
Poland |
Financials |
4.7 |
14.5 |
Anglogold Ashanti |
ANG SJ |
S Africa |
Materials |
21.7 |
15.1 |
Reinet Investmen |
RNI SJ |
S Africa |
Financials |
4.6 |
11.7 |
Elswedy Electri |
SWDY EC |
Egypt |
Industrials |
21.0 |
8.4 |
DP World |
DPW DU |
UAE |
Industrials |
4.5 |
11.1 |
Abu Dhabi Comm. Bk. |
ADCB DH |
UAE |
Financials |
20.0 |
8.8 |
Sappi |
SAP SJ |
S Africa |
Materials |
4.4 |
7.9 |
Surgutneftegas (P) |
SNGSP RX |
Russia |
Energy |
15.8 |
4.4 |
Barwa |
BRES QD |
Qatar |
Real Estate |
4.4 |
|
Telkom SA |
TKG SJ |
S Africa |
Communications |
13.3 |
11.0 |
Fortress Income A |
FFA SJ |
S Africa |
Real Estate |
4.0 |
12.0 |
Dino Polska |
DNP PW |
Poland |
Cons. Staples |
12.3 |
25.5 |
Abu Dhabi Comm. Bk. |
ADCB DH |
UAE |
Financials |
4.0 |
8.8 |
Masraf Al Rayan |
MARK QD |
Qatar |
Financials |
10.7 |
14.5 |
Masraf Al Rayan |
MARK QD |
Qatar |
Financials |
3.9 |
14.5 |
Alrosa |
ALRS RX |
Russia |
Materials |
8.7 |
7.0 |
First Abu Dhabi Bk. |
FAB DH |
UAE |
Financials |
3.7 |
11.9 |
Ezdan Holding |
ERES QD |
Qatar |
Real Estate |
7.7 |
|
JSW Coal |
JSW PW |
Poland |
Materials |
3.4 |
5.8 |
Motor Oil-Hellas |
MOH GA |
Greece |
Energy |
6.5 |
8.4 |
Exxaro |
EXX SJ |
S Africa |
Energy |
3.3 |
5.5 |
Qatar Electricity |
QEWS QD |
Qatar |
Utilities |
4.2 |
12.8 |
PZU |
PZU PW |
Poland |
Financials |
3.3 |
11.6 |
CEZ |
CEZ CK |
Czech |
Utilities |
1.8 |
17.9 |
CD Projekt |
CDR PW |
Poland |
Communications |
3.3 |
41.5 |
PGN |
PGN PW |
Poland |
Energy |
1.4 |
10.4 |
Qatar Electricity |
QEWS QD |
Qatar |
Utilities |
2.7 |
12.8 |
Norilsk Nickel |
GMKN RX |
Russia |
Materials |
-0.5 |
8.7 |
Spar |
SPP SJ |
S Africa |
Cons. Staples |
2.6 |
17.6 |
Gazprom |
GAZP RX |
Russia |
Energy |
-2.7 |
3.0 |
Etisalat |
ETISALAT DH |
UAE |
Communications |
2.2 |
16.1 |
Polyus |
PLZL RX |
Russia |
Materials |
-2.8 |
8.3 |
BIM |
BIMAS TI |
Turkey |
Cons. Staples |
2.0 |
19.3 |
Etisalat |
ETISALAT DH |
UAE |
Communications |
-3.0 |
16.1 |
Shoprite |
SHP SJ |
S Africa |
Cons. Staples |
-6.7 |
18.2 |
JSW Coal |
JSW PW |
Poland |
Materials |
-35.5 |
5.8 |
Comm. Bk. Qatar |
CBQK QD |
Qatar |
Financials |
-6.7 |
10.8 |
Kumba Iron Ore |
KIO SJ |
S Africa |
Materials |
-35.7 |
11.5 |
CCC |
CCC PW |
Poland |
Cons. Disc. |
-7.3 |
18.5 |
CCC |
CCC PW |
Poland |
Cons. Disc. |
-37.4 |
18.5 |
Sberbank |
SBER RX |
Russia |
Financials |
-7.3 |
4.7 |
Alior Bank |
ALR PW |
Poland |
Financials |
-38.3 |
8.2 |
OPAP |
OPAP GA |
Greece |
Cons. Disc. |
-7.4 |
12.3 |
MOEX |
MOEX RX |
Russia |
Financials |
-38.5 |
8.7 |
Tupras |
TUPRS TI |
Turkey |
Energy |
-7.5 |
6.2 |
Anadolu Efes |
AEFES TI |
Turkey |
Cons. Staples |
-39.1 |
13.8 |
Hellenic Telecomms |
HTO GA |
Greece |
Communications |
-7.7 |
15.7 |
Hyprop Investments |
HYP SJ |
S Africa |
Real Estate |
-40.1 |
10.2 |
Foschini Group |
TFG SJ |
S Africa |
Cons. Disc. |
-7.9 |
13.4 |
VTB |
VTBR RX |
Russia |
Financials |
-40.2 |
3.2 |
Gazprom |
GAZP RX |
Russia |
Energy |
-8.1 |
3.0 |
Emaar Properties |
EMAAR DB |
UAE |
Real Estate |
-40.5 |
4.4 |
Emaar Properties |
EMAAR DB |
UAE |
Real Estate |
-8.2 |
4.4 |
Ford Otomotiv |
FROTO TI |
Turkey |
Cons. Disc. |
-40.6 |
8.3 |
Resilient |
RES SJ |
S Africa |
Real Estate |
-8.4 |
|
Alpha Bank |
ALPHA GA |
Greece |
Financials |
-41.4 |
9.3 |
Ford Otomotiv |
FROTO TI |
Turkey |
Cons. Disc. |
-8.4 |
8.3 |
Turkcell |
TCELL TI |
Turkey |
Communications |
-43.7 |
8.3 |
InterRao |
IRAO RX |
Russia |
Utilities |
-8.6 |
4.9 |
MTN |
MTN SJ |
S Africa |
Communications |
-43.9 |
11.3 |
Koc Holding |
KCHOL TI |
Turkey |
Industrials |
-8.6 |
6.2 |
Koc Holding |
KCHOL TI |
Turkey |
Industrials |
-45.0 |
6.2 |
Investec |
INL SJ |
S Africa |
Financials |
-8.6 |
8.5 |
Aselsan |
ASELS TI |
Turkey |
Industrials |
-45.8 |
8.2 |
Severstal |
CHMF RX |
Russia |
Materials |
-9.2 |
7.1 |
Garanti |
GARAN TI |
Turkey |
Financials |
-46.8 |
4.8 |
Sabanci Holding |
SAHOL TI |
Turkey |
Financials |
-9.5 |
3.4 |
Arcelik As |
ARCLK TI |
Turkey |
Cons. Disc. |
-47.5 |
9.8 |
Aselsan |
ASELS TI |
Turkey |
Industrials |
-10.7 |
8.2 |
Eregli |
EREGL TI |
Turkey |
Materials |
-48.4 |
4.8 |
Pick N Pay |
PIK SJ |
S Africa |
Cons. Staples |
-10.8 |
19.9 |
Tiger Brands |
TBS SJ |
S Africa |
Cons. Staples |
-48.7 |
14.2 |
Emaar Developmen |
EMAARDEV DB |
UAE |
Real Estate |
-10.9 |
4.2 |
Petkim |
PETKM TI |
Turkey |
Materials |
-48.9 |
6.8 |
Alpha Bank |
ALPHA GA |
Greece |
Financials |
-10.9 |
9.3 |
Akbank |
AKBNK TI |
Turkey |
Financials |
-50.1 |
5.1 |
MMK |
MAGN RX |
Russia |
Materials |
-11.2 |
8.7 |
Sabanci Holding |
SAHOL TI |
Turkey |
Financials |
-51.6 |
3.4 |
Aspen Pharmacare |
APN SJ |
S Africa |
Healthcare |
-11.3 |
8.2 |
Halk Bank |
HALKB TI |
Turkey |
Financials |
-53.4 |
3.5 |
Akbank |
AKBNK TI |
Turkey |
Financials |
-11.3 |
5.1 |
Magnit |
MGNT LI |
Russia |
Cons. Staples |
-53.5 |
13.2 |
Hyprop Investments |
HYP SJ |
S Africa |
Real Estate |
-11.6 |
10.2 |
Is Bank |
ISCTR TI |
Turkey |
Financials |
-53.5 |
5.0 |
Eastern Tobacco |
EAST EC |
Egypt |
Cons. Staples |
-12.0 |
8.2 |
Damac |
DAMAC DB |
UAE |
Real Estate |
-54.2 |
5.9 |
VTB |
VTBR RX |
Russia |
Financials |
-12.5 |
3.2 |
NEPI |
NRP SJ |
S Africa |
Real Estate |
-54.4 |
11.7 |
MOEX |
MOEX RX |
Russia |
Financials |
-12.7 |
8.7 |
Aspen Pharmacare |
APN SJ |
S Africa |
Healthcare |
-58.1 |
8.2 |
PGE |
PGE PW |
Poland |
Utilities |
-13.6 |
7.0 |
Resilient |
RES SJ |
S Africa |
Real Estate |
-63.8 |
|
Damac |
DAMAC DB |
UAE |
Real Estate |
-19.2 |
5.9 |
Fortress Income B |
FFB SJ |
S Africa |
Real Estate |
-70.4 |
7.8 |
Source: Bloomberg
106

vk.com/id446425943
Renaissance Capital
14 January 2019
ESG
Top and bottom 30 - FM ($)
|
|
|
Best/Worst |
12MF |
|
|
|
Best/Worst |
12MF |
||
Name |
Ticker |
Country |
Sector |
-1m |
P/E (x) |
Name |
Ticker |
Country |
Sector |
2018 |
P/E (x) |
Bupa Arabia |
BUPA AB |
Saudi Arabia |
Financials |
14.9 |
15.3 |
United Power Gen |
UPGO BD |
Bangladesh |
Utilities |
108.3 |
|
Riyad Bank |
RIBL AB |
Saudi Arabia |
Financials |
13.3 |
12.0 |
Riyad Bank |
RIBL AB |
Saudi Arabia |
Financials |
58.5 |
12.0 |
FBN Holdings |
FBNH NL |
Nigeria |
Financials |
12.1 |
3.7 |
Vingroup |
VIC VM |
Vietnam |
Real Estate |
46.1 |
31.8 |
Ciments Du Maroc |
CMA MC |
Morocco |
Materials |
12.0 |
|
Boubyan Petroch |
BPCC KK |
Kuwait |
Materials |
44.7 |
1.1 |
Valamar Riviera |
RIVPRA ZA |
Croatia |
Cons. Disc. |
10.7 |
14.3 |
Jarir Marketing |
JARIR AB |
Saudi Arabia |
Cons. Disc. |
38.1 |
18.1 |
Saudi Telecom |
STC AB |
Saudi Arabia |
Communications |
10.6 |
18.6 |
Bahrain Telecom |
BATELCO BI |
Bahrain |
Communications |
37.3 |
|
Alinma Bank |
ALINMA AB |
Saudi Arabia |
Financials |
10.3 |
13.6 |
Al Rajhi Bank |
RJHI AB |
Saudi Arabia |
Financials |
35.4 |
14.0 |
BIDV |
BID VM |
Vietnam |
Financials |
10.2 |
16.3 |
Boubyan Bank |
BOUBYAN KK |
Kuwait |
Financials |
34.1 |
28.4 |
Bank Albilad |
ALBI AB |
Saudi Arabia |
Financials |
9.4 |
14.2 |
Saudi Telecom |
STC AB |
Saudi Arabia |
Communications |
33.8 |
18.6 |
Seplat |
SEPLAT NL |
Nigeria |
Energy |
8.7 |
6.0 |
Samba Financial Group |
SAMBA AB |
Saudi Arabia |
Financials |
33.6 |
12.1 |
FLC Faros Const. |
ROS VM |
Vietnam |
Industrials |
8.1 |
|
Bao Viet Holdings |
BVH VM |
Vietnam |
Financials |
33.5 |
32.7 |
Saigon Beer |
SAB VM |
Vietnam |
Cons. Staples |
7.6 |
28.2 |
Bank Albilad |
ALBI AB |
Saudi Arabia |
Financials |
33.0 |
14.2 |
Mouwasat Medical |
MOUWASAT AB |
Saudi Arabia |
Healthcare |
7.3 |
20.1 |
BIDV |
BID VM |
Vietnam |
Financials |
32.1 |
16.3 |
Arab National Bank |
ARNB AB |
Saudi Arabia |
Financials |
7.1 |
9.2 |
National Petrochem |
PETROCH AB |
Saudi Arabia |
Materials |
31.1 |
10.7 |
Soc Gen Cote d'Ivoire |
SGBC BC |
Ivory Coast |
Financials |
7.0 |
|
Bupa Arabia |
BUPA AB |
Saudi Arabia |
Financials |
30.6 |
15.3 |
Bahrain Telecom |
BATELCO BI |
Bahrain |
Communications |
6.9 |
|
Nat'l Comm. Bank |
NCB AB |
Saudi Arabia |
Financials |
30.3 |
12.4 |
Nat'l Comm. Bank |
NCB AB |
Saudi Arabia |
Financials |
6.3 |
12.4 |
Arab National Bank |
ARNB AB |
Saudi Arabia |
Financials |
29.1 |
9.2 |
Aerodrom Nikola Tesla |
AERO SG |
Serbia |
Industrials |
6.0 |
|
Alawwal Bank |
ALAWWAL AB |
Saudi Arabia |
Financials |
27.5 |
14.0 |
Solidere - B |
SOLB LB |
Lebanon |
Real Estate |
5.6 |
|
No Va Land |
NVL VM |
Vietnam |
Real Estate |
26.5 |
|
Saudi Cement |
SACCO AB |
Saudi Arabia |
Materials |
5.6 |
19.1 |
Saudi Kayan Petchem |
KAYAN AB |
Saudi Arabia |
Materials |
23.6 |
11.6 |
Al Eqbal |
EICO JR |
Jordan |
Cons. Staples |
5.4 |
|
Bank Al-Jazira |
BJAZ AB |
Saudi Arabia |
Financials |
23.1 |
12.3 |
Arab Bank |
ARBK JR |
Jordan |
Financials |
5.4 |
7.2 |
Globant |
GLOB UN |
Argentina |
IT |
21.2 |
29.3 |
Saudi Arabian Mining |
MAADEN AB |
Saudi Arabia |
Materials |
5.4 |
29.3 |
Saudi British Bank |
SABB AB |
Saudi Arabia |
Financials |
20.9 |
11.0 |
LafargeHolcim Maroc |
LHM MC |
Morocco |
Materials |
5.2 |
|
Alinma Bank |
ALINMA AB |
Saudi Arabia |
Financials |
20.1 |
13.6 |
Emp Distrib-Adr |
EDN UN |
Argentina |
Utilities |
5.1 |
7.4 |
Nat'l Bank of Kuwait |
NBK KK |
Kuwait |
Financials |
19.6 |
12.3 |
Krka |
KRKG SV |
Slovenia |
Healthcare |
4.7 |
10.5 |
Saudi Industrial |
SIIG AB |
Saudi Arabia |
Materials |
19.4 |
8.2 |
Loma Negra C-Adr |
LOMA UN |
Argentina |
Materials |
4.6 |
17.1 |
Saudi Arabian Fertilizer |
SAFCO AB |
Saudi Arabia |
Materials |
18.4 |
16.6 |
Kcell Jsc |
KCEL LI |
Kazakhstan |
Communications |
4.4 |
15.5 |
Ceylon Tobacco |
CTC SL |
Sri Lanka |
Cons. Staples |
18.2 |
15.9 |
Consumar |
CSR MC |
Morocco |
Cons. Staples |
3.8 |
15.1 |
Kuwait Finance House |
KFH KK |
Kuwait |
Financials |
16.1 |
15.4 |
Boubyan Bank |
BOUBYAN KK |
Kuwait |
Financials |
3.8 |
28.4 |
Rabigh Refining |
PETROR AB |
Saudi Arabia |
Energy |
16.0 |
14.7 |
Hoa Phat Group |
HPG VM |
Vietnam |
Materials |
-6.3 |
5.9 |
EABL |
EABL KN |
Kenya |
Cons. Staples |
-25.6 |
14.5 |
Bao Viet Holdings |
BVH VM |
Vietnam |
Financials |
-6.6 |
32.7 |
UBA |
UBA NL |
Nigeria |
Financials |
-26.0 |
2.8 |
Rabigh Refining |
PETROR AB |
Saudi Arabia |
Energy |
-6.6 |
14.7 |
Al Tayyar |
ALTAYYAR AB |
Saudi Arabia |
Cons. Disc. |
-26.0 |
11.0 |
EABL |
EABL KN |
Kenya |
Cons. Staples |
-6.9 |
14.5 |
Saudi Electricity |
SECO AB |
Saudi Arabia |
Utilities |
-28.1 |
15.0 |
Unilever Nigeria |
UNILEVER NL |
Nigeria |
Cons. Staples |
-7.1 |
16.7 |
Vincom Retail |
VRE VM |
Vietnam |
Real Estate |
-29.0 |
18.0 |
Vietjet |
VJC VM |
Vietnam |
Industrials |
-7.9 |
9.5 |
Petrolimex |
PLX VM |
Vietnam |
Energy |
-30.8 |
|
Petrolimex |
PLX VM |
Vietnam |
Energy |
-8.1 |
|
Savola |
SAVOLA AB |
Saudi Arabia |
Cons. Staples |
-32.2 |
26.1 |
Saudi Industrial |
SIIG AB |
Saudi Arabia |
Materials |
-8.5 |
8.2 |
Vietnam Dairy |
VNM VM |
Vietnam |
Cons. Staples |
-32.4 |
23.9 |
Vincom Retail |
VRE VM |
Vietnam |
Real Estate |
-8.6 |
18.0 |
Transportador Gas |
TGS UN |
Argentina |
Energy |
-32.5 |
10.3 |
Siauliu Bankas |
SAB1L LH |
Lithuania |
Financials |
-8.9 |
6.8 |
Oman Telecom |
OTEL OM |
Oman |
Communications |
-34.7 |
5.0 |
Halyk Savings Bank |
HSBK LI |
Kazakhstan |
Financials |
-9.2 |
4.1 |
Sonatel |
SNTS BC |
Senegal |
Communications |
-35.1 |
9.1 |
Telecom Argentina |
TEO UN |
Argentina |
Communications |
-9.4 |
13.3 |
Access Bank |
ACCESS NL |
Nigeria |
Financials |
-35.5 |
2.0 |
Pampa Energia |
PAM UN |
Argentina |
Utilities |
-9.5 |
9.1 |
Tawuniya |
TAWUNIYA AB |
Saudi Arabia |
Financials |
-36.1 |
20.8 |
Tallink Grupp |
TAL1T ET |
Estonia |
Industrials |
-9.6 |
16.1 |
Nigerian Breweries |
NB NL |
Nigeria |
Cons. Staples |
-37.2 |
18.0 |
Sonatel |
SNTS BC |
Senegal |
Communications |
-10.1 |
9.1 |
Dar Al Arkan |
ALARKAN AB |
Saudi Arabia |
Real Estate |
-37.4 |
23.7 |
YPF |
YPF UN |
Argentina |
Energy |
-10.6 |
16.4 |
Soc Gen Cote d'Ivoire |
SGBC BC |
Ivory Coast |
Financials |
-38.9 |
|
Tasnee |
NIC AB |
Saudi Arabia |
Materials |
-11.0 |
9.5 |
GFH Financial |
GFH DB |
Bahrain |
Financials |
-39.9 |
|
Equity Group |
EQBNK KN |
Kenya |
Financials |
-11.2 |
5.8 |
Emaar Economic City |
EMAAR AB |
Saudi Arabia |
Real Estate |
-41.4 |
|
Ecobank |
ETI NL |
Nigeria |
Financials |
-12.1 |
3.1 |
YPF |
YPF UN |
Argentina |
Energy |
-41.6 |
16.4 |
Access Bank |
ACCESS NL |
Nigeria |
Financials |
-12.1 |
2.0 |
Emp Distrib-Adr |
EDN UN |
Argentina |
Utilities |
-45.6 |
7.4 |
Managem |
MNG MC |
Morocco |
Materials |
-12.5 |
20.3 |
Managem |
MNG MC |
Morocco |
Materials |
-47.3 |
20.3 |
Total Maroc Sa |
TMA MC |
Morocco |
Cons. Disc. |
-13.3 |
9.1 |
Total Maroc Sa |
TMA MC |
Morocco |
Cons. Disc. |
-50.3 |
9.1 |
Electrica |
EL RE |
Romania |
Utilities |
-14.2 |
11.9 |
Loma Negra C-Adr |
LOMA UN |
Argentina |
Materials |
-51.7 |
17.1 |
Banca Transilvania |
TLV RE |
Romania |
Financials |
-15.1 |
6.7 |
Pampa Energia |
PAM UN |
Argentina |
Utilities |
-52.7 |
9.1 |
Corp America Air |
CAAP UN |
Argentina |
Industrials |
-16.9 |
9.0 |
Despegar.Com Cor |
DESP UN |
Argentina |
Cons. Disc. |
-54.8 |
66.6 |
Despegar.Com Cor |
DESP UN |
Argentina |
Cons. Disc. |
-16.9 |
66.6 |
Banco Frances |
BFR UN |
Argentina |
Financials |
-55.0 |
9.5 |
BRD |
BRD RE |
Romania |
Financials |
-18.3 |
7.1 |
Telecom Argentina |
TEO UN |
Argentina |
Communications |
-57.5 |
13.3 |
OMV |
SNP RE |
Romania |
Energy |
-18.9 |
5.1 |
Grupo Galicia |
GGAL UR |
Argentina |
Financials |
-58.1 |
11.1 |
GFH Financial |
GFH DB |
Bahrain |
Financials |
-20.2 |
|
Banco Macro |
BMA UN |
Argentina |
Financials |
-61.8 |
7.1 |
SNG |
SNG RE |
Romania |
Energy |
-22.2 |
6.8 |
FLC Faros Const. |
ROS VM |
Vietnam |
Industrials |
-75.0 |
|
Note: Universe is MSCI Frontier and Saudi Arabia
Source: Bloomberg
107

vk.com/id446425943
Liquidity watch
3MADTV, $mn |
|
|
|
|
|
|
|
Current |
-1m |
% chg |
-12m |
% chg |
12M Trend |
China |
19,241 |
19,705 |
-2% |
31,706 |
-39% |
|
Korea |
7,454 |
8,007 |
-7% |
11,134 |
-33% |
|
India |
4,038 |
4,454 |
-9% |
4,273 |
-5% |
|
Taiwan |
3,880 |
4,259 |
-9% |
5,212 |
-26% |
|
Brazil |
3,091 |
2,999 |
3% |
2,028 |
52% |
|
S Africa |
1,338 |
1,521 |
-12% |
1,741 |
-23% |
|
Turkey |
1,236 |
1,422 |
-13% |
1,917 |
-36% |
|
Thailand |
1,111 |
1,318 |
-16% |
1,608 |
-31% |
|
Russia |
920 |
1,046 |
-12% |
1,087 |
-15% |
|
Indonesia |
429 |
405 |
6% |
405 |
6% |
|
Mexico |
363 |
385 |
-6% |
376 |
-3% |
|
Poland |
220 |
236 |
-7% |
265 |
-17% |
|
Malaysia |
209 |
235 |
-11% |
260 |
-20% |
|
Chile |
137 |
139 |
-1% |
174 |
-21% |
|
UAE |
96 |
96 |
0% |
123 |
-22% |
|
Philippines |
86 |
77 |
11% |
97 |
-12% |
|
Qatar |
54 |
55 |
-2% |
48 |
12% |
|
Greece |
52 |
59 |
-12% |
66 |
-21% |
|
Pakistan |
48 |
49 |
-3% |
56 |
-15% |
|
Hungary |
45 |
45 |
-1% |
43 |
6% |
|
Peru |
41 |
35 |
17% |
49 |
-15% |
|
Colombia |
40 |
44 |
-10% |
42 |
-5% |
|
Egypt |
32 |
34 |
-5% |
43 |
-25% |
|
Czech |
25 |
28 |
-8% |
24 |
7% |
|
Saudi Arabia |
863 |
889 |
-3% |
954 |
-10% |
|
Vietnam |
116 |
143 |
-19% |
200 |
-42% |
|
Argentina |
81 |
100 |
-19% |
135 |
-40% |
|
Kuwait |
68 |
62 |
11% |
43 |
57% |
|
Bangladesh |
66 |
71 |
-7% |
75 |
-12% |
|
Morocco |
23 |
10 |
121% |
15 |
56% |
|
Jordan |
16 |
5 |
213% |
6 |
172% |
|
Serbia |
12 |
8 |
41% |
14 |
-18% |
|
Romania |
12 |
9 |
23% |
9 |
30% |
|
Nigeria |
9 |
8 |
6% |
15 |
-43% |
|
Sri Lanka |
6 |
5 |
7% |
5 |
8% |
|
Kenya |
5 |
6 |
-11% |
6 |
-12% |
|
Oman |
4 |
4 |
-10% |
7 |
-53% |
|
Bahrain |
3 |
4 |
-17% |
2 |
41% |
|
Tunisia |
2 |
1 |
8% |
1 |
14% |
|
Lebanon |
1 |
1 |
12% |
1 |
12% |
|
Kazakhstan |
1 |
1 |
34% |
6 |
-79% |
|
Slovenia |
1 |
1 |
24% |
1 |
-17% |
|
Croatia |
1 |
1 |
2% |
1 |
18% |
|
WAEMU |
1 |
1 |
13% |
2 |
-55% |
|
Mauritius |
1 |
1 |
-14% |
2 |
-53% |
|
Estonia |
1 |
1 |
5% |
1 |
13% |
|
Lithuania |
0 |
0 |
15% |
0 |
1% |
|
Note: local market turnover. Peru, Russia, Kazakhstan and Argentina include DRs
Renaissance Capital
14 January 2019
ESG
China 3MADTV, $mn
China 3MADTV, $mn
160,000
140,000
120,000
100,000
80,000
60,000
40,000
20,000
0 |
|
|
|
|
|
|
|
|
|
|
|
|
|
|
Jan-11 |
Jul-11 |
Jan-12 |
Jul-12 |
Jan-13 |
Jul-13 |
Jan-14 |
Jul-14 |
Jan-15 |
Jul-15 |
Jan-16 |
Jul-16 |
Jan-17 |
Jul-17 |
Jan-18 |
EM Asia ex-China 3MADTV, $mn |
|
|
|
|
|
|
|
|
|
|
||||
28,000 |
|
|
|
EM Asia ex-China 3MADTV, $mn |
|
|
|
|
||||||
|
|
|
|
|
|
|
|
|
|
|
|
|
|
|
26,000 |
|
|
|
|
|
|
|
|
|
|
|
|
|
|
24,000 |
|
|
|
|
|
|
|
|
|
|
|
|
|
|
22,000 |
|
|
|
|
|
|
|
|
|
|
|
|
|
|
20,000 |
|
|
|
|
|
|
|
|
|
|
|
|
|
|
18,000 |
|
|
|
|
|
|
|
|
|
|
|
|
|
|
16,000 |
|
|
|
|
|
|
|
|
|
|
|
|
|
|
14,000 |
|
|
|
|
|
|
|
|
|
|
|
|
|
|
12,000 |
|
|
|
|
|
|
|
|
|
|
|
|
|
|
10,000 |
|
|
|
|
|
|
|
|
|
|
|
|
|
|
Jan-11 |
Jul-11 |
Jan-12 |
Jul-12 |
Jan-13 |
Jul-13 |
Jan-14 |
Jul-14 |
Jan-15 |
Jul-15 |
Jan-16 |
Jul-16 |
Jan-17 |
Jul-17 |
Jan-18 |
EM EMEA and LatAm 3MADTV, $mn |
|
|
|
|
|
|
|
|
|
|||||
10,000 |
|
EM EMEA 3MADTV, $mn |
|
|
EM LatAm 3MADTV, $mn |
|
||||||||
|
|
|
|
|
|
|
|
|
|
|
|
|
|
|
9,000 |
|
|
|
|
|
|
|
|
|
|
|
|
|
|
8,000 |
|
|
|
|
|
|
|
|
|
|
|
|
|
|
7,000 |
|
|
|
|
|
|
|
|
|
|
|
|
|
|
6,000 |
|
|
|
|
|
|
|
|
|
|
|
|
|
|
5,000 |
|
|
|
|
|
|
|
|
|
|
|
|
|
|
4,000 |
|
|
|
|
|
|
|
|
|
|
|
|
|
|
3,000 |
|
|
|
|
|
|
|
|
|
|
|
|
|
|
2,000 |
|
|
|
|
|
|
|
|
|
|
|
|
|
|
1,000 |
|
|
|
|
|
|
|
|
|
|
|
|
|
|
Jan-11 |
Jul-11 |
Jan-12 |
Jul-12 |
Jan-13 |
Jul-13 |
Jan-14 |
Jul-14 |
Jan-15 |
Jul-15 |
Jan-16 |
Jul-16 |
Jan-17 |
Jul-17 |
Jan-18 |
Frontier 3MADTV, $mn
Frontier 3MADTV, $mn
1,000
800
600
400
200
0
Jan-11 |
Jul-11 |
Jan-12 |
Jul-12 |
Jan-13 |
Jul-13 |
Jan-14 |
Jul-14 |
Jan-15 |
Jul-15 |
Jan-16 |
Jul-16 |
Jan-17 |
Jul-17 |
Jan-18 |
Source: Bloomberg
108