

ESG_140119(1)_watermark
.pdfvk.com/id446425943
Renaissance Capital
14 January 2019
ESG
returns. This was followed by a 2015 study of 2,200 pieces of research which concluded that 90% found a non-negative relationship between ESG and corporate financial performance. We still believe that the performance ‘proof’ for ESG integration is still very much in its early days, with a body of real-world evidence yet to be created (we look in more detail at performance of ESG strategies later in this report).
Figure 50: Assets under management by strategy, $bn
16,000
14,000
12,000
10,000
8,000
6,000
4,000
2,000
0
Negative screen |
ESG integration |
Corporate engagement / shareholder action |
Norms based |
Positive screen |
Sustainability themes |
Impact/community |
Source: GSIA Global Sustainable Investment Alliance
39

vk.com/id446425943
Is ESG integration actually that new?
Negative screening (particularly for religious and ethical reasons) and impact investing have been around for decades, albeit as a relatively small and specialised part of the asset management world. The space has continued to involve, albeit with more sophisticated data collection and the use of algorithms, sector overlays, and derivatives to minimise tracking errors and progress in measuring a portfolio’s impact.
The recent surge in interest, with the potential for much more scalable ESG, comes from ESG integration. One of the pushbacks we hear from investors is that non-ESG managers have already been doing much of this work as part of their regular investment process for decades. Any professional investor will want to understand (and if possible quantify) the risks – be they regulatory, reputational, financial, societal, governance, market or other – as they invest their clients’ money, and to assess how these risks may change over time and how they are being addressed by corporate managements. Indeed, this analyst remembers as a young fund manager in the nineties taking time to analyse 50-year projections for the nuclear industry in the Czech Republic to better understand clean-up costs; assessing whether interests were aligned (or not) between majority and minority shareholders in family-owned companies in Greece and Turkey; doing detailed work on corporate structures, disclosure and transfer pricing in Russia, and concluding that the very low taxes being paid by major Russian corporates risked ultimately undermining Russia’s macro stability (as indeed happened 1998), or potentially backfire on the companies themselves (as we saw in 2003).
So what has changed? Three main things, really.
First, demand for ESG-managed assets from asset owners (sovereign wealth funds, pension funds and self-invested pension plans) is increasing for reasons discussed earlier, and this is creating a sizeable demand for ESG asset-management services, potentially with higher fees (or at least more resilient to competition from ETFs).
Second, the data revolution. Thousands of ESG data points are now being collected from thousands of listed companies. Big Data techniques and AI are increasingly being used to process this data and provide a more rounded ESG picture (though EM and in particular Frontier data can still patchy). The use of specialist ESG data providers makes it much easier for fund managers to examine a company’s ESG profile in a structured manner to assess potential risks now and in the future.
Third, societal pressure. Growing pressure in many countries for corporates to bear the full costs of carbon emissions, pollution, water table damage, data breaches, and for multinationals to pay more taxes in the countries they operate in and for ‘gig economy’ companies to provide better protection for workers. Social media is increasing pressure on companies to adapt more quickly to societal norms.
Renaissance Capital
14 January 2019
ESG
40

vk.com/id446425943
ESG assets under management
Estimates vary substantially: the definition of ESG assets is pretty fluid, ranging from funds that exclude certain stocks/sectors through to those with an integrated ESG investment process. Starting from the largest numbers, and working down, we find that:
▪The Principles for Responsible Investment (PRI), the world’s leading proponent of responsible investment, has 1,961 signatories, including more than 1,300 investment managers, and represents $81.7trn of assets under management. Signatories commit to incorporate ESG issues into investment analysis and decision-making processes.
Figure 51: PRI signatories
|
Assets under management |
|
Asset owner assets |
|
|
||
|
Number of asset owners |
|
Number of signatories |
|
|
90 |
|
|
|
|
|
|
|
|
|
|
|
2,500 |
80 |
|
|
|
|
|
|
|
|
|
|
|
|
70 |
|
|
|
|
|
|
|
|
|
|
|
2,000 |
|
|
|
|
|
|
|
|
|
|
|
|
|
60 |
|
|
|
|
|
|
|
|
|
|
|
1,500 |
50 |
|
|
|
|
|
|
|
|
|
|
|
|
|
|
|
|
|
|
|
|
|
|
|
|
|
40 |
|
|
|
|
|
|
|
|
|
|
|
1,000 |
30 |
|
|
|
|
|
|
|
|
|
|
|
|
|
|
|
|
|
|
|
|
|
|
|
|
|
20 |
|
|
|
|
|
|
|
|
|
|
|
500 |
|
|
|
|
|
|
|
|
|
|
|
|
|
10 |
|
|
|
|
|
|
|
|
|
|
|
|
0 |
|
|
|
|
|
|
|
|
|
|
|
0 |
Jan-06 |
Jan-07 |
Jan-08 |
Jan-09 |
Jan-10 |
Jan-11 |
Jan-12 |
Jan-13 |
Jan-14 |
Jan-15 |
Jan-16 |
Jan-17 |
Jan-18 |
Source: PRI
▪The Global Sustainable Investment Alliance estimates that sustainable investments in the US, Canada, the EU, Australia, New Zealand, Japan and Asia reached $23tn in 2016 (or approximately 26% of total managed assets), almost double the $13trn of 2012. That is a surprisingly large figure, representing 26% of professionally-managed assets. Our guess here is that these numbers are something of a catch-all with a very wide net of strategies being captured.
Figure 52: ESG assets by region

 Europe 53%

 United States 38%

 Canada 5%

 Australia/NZ 2%

 Asia ex-Japan %

 Japan 2%
Source: GSIA Global Sustainable Investment Review
Half of assets managed are in Europe (53%) followed by the US (38%), Canada (5%), Australia/NZ (2%), Asia ex-Japan (0.2%) and Japan 2%. The US has been lagging Europe so far given the requirement for ERISA fiduciaries “not to sacrifice investment returns or assume greater investment risks as a means of promoting collateral social policy goals” – although recent updates have sought to clarify this.
Renaissance Capital
14 January 2019
ESG
41

vk.com/id446425943
By far the most popular strategy, used by two-thirds of sustainable investments, is negative/exclusionary screening (66%) followed by the faster-growing ESG integration (45%), corporate engagement/shareholder action (36%) and normbased screening (27%). Note that some funds have multiple strategies, which is why the total adds up to more than 100%. True impact investing is largely the realm of billionaires or specialist segments of foundations and/or sovereign wealth funds.
▪Some of the world’s largest pools of capital, including the $1.5trn Government Pension Investment Fund of Japan, the $1trn Norway Government Pension Fund, the $490bn Dutch ABP and the $350bn California Public Employees Retirement System (CalPERS) are invested within an ESG framework.
▪If we look bottom up, Morningstar’s database captures assets under management in ESG funds of $1.05trn in October 2018, a 60% increase from $655bn in 2012.
▪Our screening of the Bloomberg funds database reveals 3,153 funds, with $606bn of assets.
▪In EM, we estimate $21bn of ESG equity fund assets under management (AuM) across 98 funds, of which $14.0bn is active (57 funds) and $7.4bn is passive (41 funds). This is just 1.5% of the total equity fund AuM in EM of $1.4trn, but has grown rapidly from just $5bn in 2016.
Figure 53: EMG equity fund AuM, $mn
25,000 |
|
|
|
|
EM ESG AuM, $mn |
|
|
|
|
|
|
|
|
|
|
|
|
|
|
|
|
20,000 |
|
|
|
|
|
|
|
|
|
|
15,000 |
|
|
|
|
|
|
|
|
|
|
10,000 |
|
|
|
|
|
|
|
|
|
|
5,000 |
|
|
|
|
|
|
|
|
|
|
0 |
|
|
|
|
|
|
|
|
|
|
2008 |
2009 |
2010 |
2011 |
2012 |
2013 |
2014 |
2015 |
2016 |
2017 |
2018 |
Source: EPFR, Bloomberg, Renaissance Capital
Why such a huge difference? Definitions matter. PRI data capture the entire assets of signatories (regardless of how much ESG is applied); the Global Sustainable Investment Alliance data include a broad definition of ESG being applied within the investment process, whereas the Morningstar and Bloomberg data refer to funds that are available to the public and marketed with some form of ESG branding. Of course, there are additional segregated mandates, insurance company assets, private equity and direct investments of sovereign wealth funds, IFIs, pension funds and the like.
Renaissance Capital
14 January 2019
ESG
42

vk.com/id446425943
Where does ESG data come from?
ESG data can be collected from numerous sources. Many companies, particularly in developed markets issue ESG reports alongside annual reports. Media reports can be used to fill in the gaps, companies can be asked to fill in questionnaires, and reports from third party agencies, regulators, independent researchers and (sometimes) pressure groups can also be used. The boom in ESG data has resulted in a blossoming of ESG research firms, collecting and organising extensive amounts of ESG data that most asset managers do not have the resources to collect/organise. There are over 150 such firms in total, collecting 10,000 ESG KPI indicators via corporate reports, proprietary surveys sent to companies and other third parties, including media sources. Larger ESG providers often provide aggregate scores using proprietary algorithms.
Four of the most popular providers are MSCI, Sustainalytics, Bloomberg and ISS.
Other popular providers include RobecoSAM, Refinitiv, FTSE, CDP, RepRisk, Vigeo-Eiris and Glass Lewis; Truvalue and Trucost are also popular. Expert networks such as the Gerson Lehrman Group and employee feedback sites such as Glassdoor can also be used for ESG checks. Some larger fund managers ask companies to fill in proprietary questionnaires, but alongside the use of expert networks, care must be taken to avoid data being selectively disclosed.
Some of these providers boast of collecting thousands of data points per company, with the largest providers employing hundreds of ESG analysts and using sophisticated internet and media scraping tools to collate and organise the data.
Much is still subjective: even supposedly straightforward topics can be subject to debate, and the ESG focus may shift over time as norms change and/or more companies conform with best practice. Recent months, for example, have seen environmentalists debating whether hydroelectric dams are 'sustainable' or not. And we have all seen the debate over the gig economy – has it created jobs that wouldn't otherwise have existed, or is it taking advantage of workers? And what about reducing the power of the unions in countries which have suffered from militant unionism? Palm oil is used in bio-fuels, but at the same time is responsible for wide-scale deforestation in Malaysia and Indonesia. Diesel was once promoted by European governments as more environmentally friendly than petrol, a strategy that is now being reversed. At the end of the day, issues are bound to shift (just as sector and economic trends develop over time), something that fund managers are well used to adapting to.
ESG data are often patchy, inconsistently reported and unaudited, and often obtained from multiple sources (companies, regulators, media, advocacy groups, etc). As a result there is: 1) precious little agreement among ESG providers about how companies should rank; and 2) a risk of data overload (one study suggested that incorporating) immaterial factors can detract from performance.
Whereas the leading credit rating agencies have a 0.9 correlation between them for corporate credit, for ESG providers it is typically more like 0.3 as different providers rank various factors differently. While this lack of consensus might provide greater ‘ESG alpha’, given the lack of consensus, it highlights the risks of buying an index fund which might be blindly reliant on one or other provider. By combining huge data sets in to a single score, we think ESG providers are almost certainly oversimplifying matters and active managers will need to drill down in to the underlying data to fully understand the picture.
Work is still in progress to standardise ESG reporting – the most widely used reporting framework is provided by the Global Reporting Initiative (GRI), with another provided by the International Integrated Reporting Council (IIRC), but companies are free to follow all or part of a standard or no standard at all in their ESG reporting, and data are typically unaudited. The Sustainability Accounting Standards Board has taken the GRI and IRC frameworks to develop a new reporting standard with a focus on materiality across 79 industries.
Renaissance Capital
14 January 2019
ESG
43

vk.com/id446425943 |
|
Renaissance Capital |
|
|
14 January 2019 |
|
ESG |
|
|
Figure 54: MSCI ESG parameters, $mn |
|
|
|
|
|
|
|
|
|
|
|
|
|||||
|
|
|
|
|
|
|
|
|
|
|
|
|
|
|
|
|
|
|
|
|
Environment pillar |
|
|
|
Social pillar |
|
|
Governance pillar |
|
|
|||||
|
|
|
|
|
|
|
|
|
|
|
|
|
|
|
|
|
|
|
Climate |
|
Natural |
|
Pollution & |
|
Environment |
Human |
Product |
|
Stakeholder |
Social |
|
Corporate |
Corporate |
|
|
|
change |
|
capital |
|
waste |
|
opportunities |
capital |
liability |
|
opposition |
opportunities |
|
governance |
behaviour |
|
|
|
|
|
|
|
|
|
|
|
|
|
|
|
|
|
|
|
|
|
Carbon |
|
|
|
Toxic |
|
|
Labour |
Product safety & |
|
Controversial |
Access to |
|
|
|
|
|
|
|
Water stress |
|
emissions & |
|
Clean tech |
|
|
Board |
Business ethics |
|
|
|||||
|
emissions |
|
|
|
management |
quality |
|
Sourcing |
Communication |
|
|
|
|||||
|
|
|
|
waste |
|
|
|
|
|
|
|
|
|||||
|
|
|
|
|
|
|
|
|
|
|
|
|
|
|
|
|
|
|
|
|
|
|
|
|
|
|
|
|
|
|
|
|
|
|
|
|
Product carbon |
|
Biodiversity & |
|
Packaging |
|
|
|
|
|
|
|
|
|
Anti-competitive |
|
|
|
|
|
material & |
|
Green building |
Health & safety |
Chemical safety |
|
|
Access to finance |
|
Pay |
|
|
|||
|
footprint |
|
land use |
|
|
|
|
|
practices |
|
|
||||||
|
|
|
waste |
|
|
|
|
|
|
|
|
|
|
|
|||
|
|
|
|
|
|
|
|
|
|
|
|
|
|
|
|
|
|
|
|
|
|
|
|
|
|
|
|
|
|
|
|
|
|
|
|
|
Financing |
|
Raw material |
|
Electronic |
|
Renewable |
Human capital |
Financial |
|
|
Access to |
|
|
Corruption & |
|
|
|
environmental |
|
|
|
|
|
|
Ownership |
|
|
|||||||
|
|
sourcing |
|
waste |
|
energy |
development |
product safety |
|
|
healthcare |
|
instability |
|
|
||
|
impact |
|
|
|
|
|
|
|
|
|
|||||||
|
|
|
|
|
|
|
|
|
|
|
|
|
|
|
|
|
|
|
|
|
|
|
|
|
|
|
|
|
|
|
|
|
|
|
|
|
Climate change |
|
|
|
|
|
|
Supply chain |
Privacy & data |
|
|
Opportunities in |
|
|
Financial system |
|
|
|
|
|
|
|
|
|
labour |
|
|
|
Accounting |
|
|
||||
|
vulnerability |
|
|
|
|
|
|
security |
|
|
nutrition & health |
|
instability |
|
|
||
|
|
|
|
|
|
|
standards |
|
|
|
|
|
|
||||
|
|
|
|
|
|
|
|
|
|
|
|
|
|
|
|
|
|
|
|
|
|
|
|
|
|
|
|
|
|
|
|
|
|
|
|
|
|
|
|
|
|
|
|
|
Responsible |
|
|
|
|
|
Tax |
|
|
|
|
|
|
|
|
|
|
|
investment |
|
|
|
|
|
transparency |
|
|
|
|
|
|
|
|
|
|
|
|
|
|
|
|
|
|
|
|
|
|
|
|
|
|
|
|
|
Insuring health |
|
|
|
|
|
|
|
|
|
|
|
|
|
|
|
|
|
& demographic |
|
|
|
|
|
|
|
|
|
|
|
|
|
|
|
|
|
risk |
|
|
|
|
|
|
|
|
|
|
|
|
|
|
|
|
|
|
|
|
|
|
|
Source: MSCI |
||
44
vk.com/id446425943
The ESG debate
Renaissance Capital
14 January 2019
ESG
ESG is a sector undergoing rapid development. ESG integration in seeking to enhance the understanding of risks associated with the environment, social factors and governance, without artificially constraining the investment universe aims to improve (or at the very least equal) competitive risk-adjusted returns – to meet the fiduciary requirements of many of the world’s largest pools of capital (pension funds, insurance companies, etc).
Though ESG integration should normally result in portfolios prioritising companies doing well on these issues, it is not the same as true impact investment, where investments are made with a specific outcome in mind (e.g. raising financial inclusion, targeting poverty, etc) and where lower returns could often be tolerated. Impact investing tends to be much less liquid for now and is largely restricted to billionaires, family offices, foundations and sovereign wealth funds.
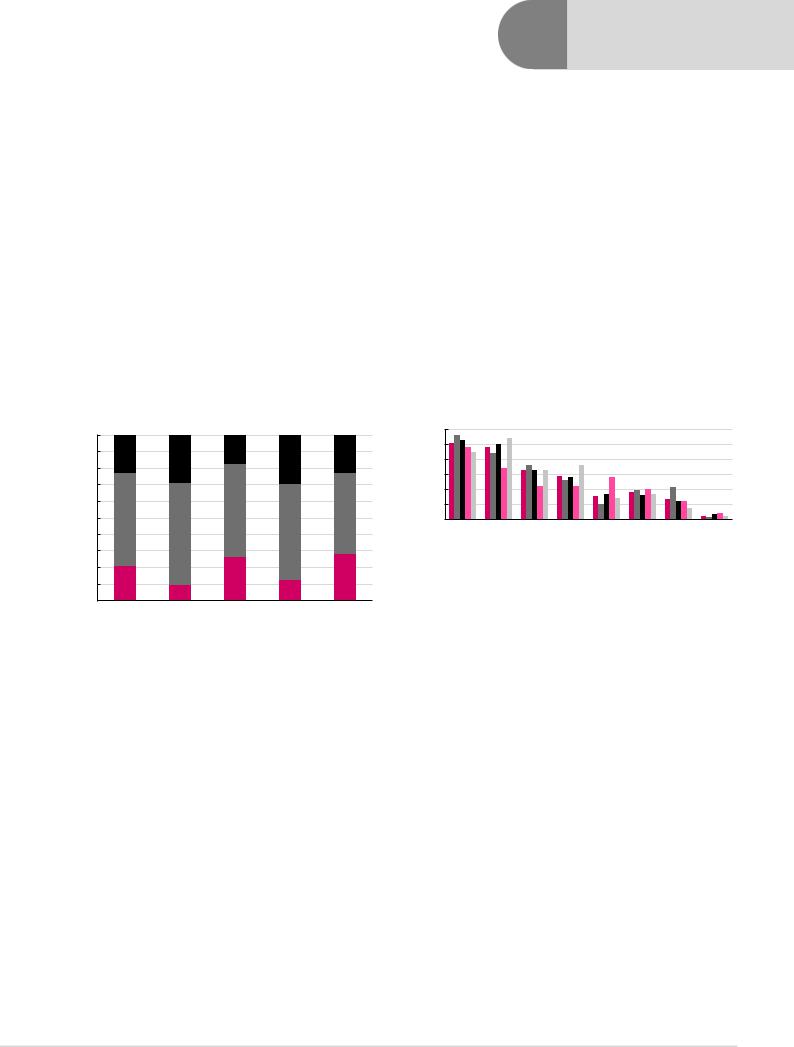
This is still a young industry, with its teething issues. One study, by fund managers Schroders revealed that 77% of investors find incorporating ESG either very or somewhat challenging, with the key issues being performance concerns, data availability and quality and risk management.
Figure 55: How challenging do you find sustainable investments? |
Figure 56: Which factors do you consider a challenge in sustainable investing |
|
Very challenging |
|
Somewhat challenging |
|
Not challenging |
|
|
|
100%
90%
80%
70%
60%
50%
40%
30%
20%
10%
0%
Overall |
N America |
Europe |
Latin America |
Asia |
|
Overall |
|
N America |
|
Europe |
|
Latin America |
|
Asia |
|
|
|
|
|
|||||
|
|
|
|
|
60
50
40
30
20
10
0
Performance concerns |
Data concerns |
Managing risk |
Cost |
Investment committee not comfortable |
Do not believe in concept |
No challenges |
Other |
Source: Schroders Institutional Investor Study 2018 |
Source: Schroders Institutional Investor Study 2018 |
The ESG debate in bullet points – some of the challenges:
1.Lack of standardised reporting. Companies have a wide range of reporting methodologies and there is limited comparability with numbers produced between companies. Sustainability accounting standards are being developed.
2.Lack of auditing. Such disclosure is often voluntary and not part of annuallyaudited disclosures.
3.Selective reporting. Companies tend voluntarily to disclose positive metrics and may be inclined not to disclose too much negative data, which can skew results.
4.Small companies tend to lag. Large companies often have the ability to produce comprehensive ESG reports, which their smaller peers struggle to produce. Some scoring methodologies penalise missing data, boosting the scores of companies with high disclosure.
5.Geographical bias. Regulations in Europe favour more in-depth ESG reporting and hence greater data availability.
6.Sector bias. Carbon emissions matter for steel and oil companies. It shouldn’t really matter (at least in order of magnitude) for advertising agencies. Water table issues may be relevant to beverage producers but irrelevant to banks,
45

vk.com/id446425943
though banks’ lending policies might come in to play. This tends to make managers compare companies within their sector group silos, with sometimes less of a focus on which sectors (or countries) in aggregate are challenging from an ESG perspective.
7.How far to go? How far down a company’s supply chain should analysis go to identify polluting or socially irresponsible suppliers? Global multinationals may have multiple industries in many markets requiring extensive and costly (particularly in terms of time) ESG due diligence. There is also a challenge in finding appropriate peers for some companies.
8.What is material? The Sustainable Accounting Standards Board (SASB) differentiates between materiality of ESG factors by sector in its materiality map covering 77 industries within 11 sectors. One study found that across industries, on average, only about 20% of ESG issues could be classified as ‘material’, and that firms with strong ratings on material sustainability issues have better future performance than firms with inferior ratings on the same issues. In contrast, firms with strong ratings on immaterial issues do not outperform firms with poor ratings on these issues. And firms with strong ratings on material issues but poor ratings on immaterial issues have the best future performance. In other words, incorporating non-material issues in to ESG analysis has tended to detract from performance, a potentially important takeaway for ESG managers. However, which factors may be important in the future is a key unknown.
9.Weighting difficult-to-compare results. Should social issues be considered more or less important than environmental or governance issues? Should a highly-polluting company be able to offset that by having great governance and treating workers well? Is having unions good or bad (reducing the power of militant unions was seen as a great success in many countries)? How should societal norms in less wealthy countries, or in countries with different social traditions be treated?
10.Consistency. Lack of standardised analysis. As the Wall Street Journal pointed out in September 2018 (see Figure 52), Tesla was ranked by MSCI at the top of the industry, and by FTSE as the worst carmaker globally on ESG issues.
Sustainalytics put it in the middle. One study showed only a 14% correlation between MSCI's ESG score and Fortune magazine's Corporate Social Performance (CSP) ranking, and found very little correlation between providers even on detailed metrics such as palm oil. CSRHub found only a 0.32 correlation between MSCI and Sustainalytics ESG scores. Schroders similarly found on average just a 0.4 correlation between scores of different leading ESG providers. By contrast, our work (which took us over our monthly Bloomberg data allowance) shows that at the sovereign level, there is a 0.98 r-square correlation between S&P and Moody’s, and at the corporate level, 0.88. It is possible to argue that this lack of consensus leaves more ESG ‘alpha’ on the table for portfolio managers, but it invariably makes investing in passive funds challenging and means that active managers need to actively process the underlying data rather than aggregate score.
11.Missing data. Should companies be given the benefit of the doubt and be given sector average scores for missing data, or should scorers assume the worst?
12.Reporting delays. Real time disclosure, or even quarterly disclosure is limited, with data tending to be disclosed only annually, and even then, often with some deals.
13.Restatement/infilling of back data. Companies are free to restate data without penalty. Companies can also provide back data at will, potentially changing future and current ranks.
Renaissance Capital
14 January 2019
ESG
46

vk.com/id446425943
Renaissance Capital
14 January 2019
ESG
14.Source transparency. Some ESG raters use only company-disclosed information, others use proprietary questionnaires to seek more. Some scrape information from media sources, or even from action groups. There is little transparency in data sources, reliability and interpretation. Excessive use of proprietary questionnaires or expert sources can increase the risk of selective disclosure.
15.Are the raters also advisors? Some ESG providers are also providing ESG compliance advice to corporates.
16.Morphing data. Fund managers are not only being overwhelmed with data, but are faced with new metrics being introduced: for example, palm oil controversies, tax optimisation and data security measures are relatively new. Such newlyintroduced metrics tend to come without the ability to back-test.
17.Coverage. Many EM stocks have only limited coverage by the main ESG providers. Frontier stocks are barely covered.
18.Will ESG integration be enough? The aim of incorporating ESG risks and opportunities in to the investment process without compromising risk-adjusted returns is a laudable one, but is it enough? If over time, a measurable societal outcome is not achieved, then perhaps ESG will be seen as having fallen short of its potential.
Figure 57: Tesla according to different providers
Source: FTSE Russell, MSCI Sustainalystics, Wall Street Journal
47

vk.com/id446425943
Does (or should) ESG outperform?
Investing for good purpose while accepting potentially lower returns could be a very worthy pursuit for those who can afford it. The pot of gold for ESG managers however – which would allow ESG to move much more in to the mainstream – is to ‘prove’ that ESG can be incorporated in to investment strategies without compromising risk-adjusted returns. The reason for this is that many of the largest pools of capital in the world (pension funds, insurance companies, etc) with an eye on future liabilities have a duty to maximise riskadjusted returns.
What does the literature tell us?
First it is important to differentiate between types of ESG.
Impact and thematic investing is usually considered to be more tolerant of non-market returns in order to provide a particular ESG impact or provide focused exposure on a particular industry or theme. Impact and thematic AuM are relatively small.
Screening is where the longest ESG history lies, in the form of Socially Responsible Investment (SRI). Much of the concern about ESG performance comes from screening. The argument is that if an investment universe is artificially constrained, for example by stripping out tobacco companies, then the constrained fund manager will be unable to replicate the optimal portfolio constructed by an unconstrained manager. The unconstrained manager always has the investment option not to hold tobacco stocks if they don’t provide attractive risk-adjusted returns, but has the option to own them when they are attractive. The constrained manager does not have that choice. Investor surveys suggest that screening strategies tend to be driven more by product strategy and ethical considerations and less so by economic considerations. There is little to suggest there is much market inefficiency to be exploited: it is usually no secret that a company is involved in tobacco, gambling or alcohol.
Probably the longest ‘live’ ESG screening experience is that of Norway's Sovereign Wealth fund (at $1trn, the world’s largest, owning 1.4% of listed companies globally) which has calculated that over the past 12 years, ESG exclusions have cost the fund 1.6% in performance (excluding companies that produce tobacco or weapons that violate humanitarian principles cost the fund 2.4% in performance, only partly offset by a 0.9% improvement in returns by excluding companies with an unacceptable risk of human rights violations, serious environmental damage, gross corruption or serious violations of ethical norms). Although the numbers are small, it is a clear shortfall in performance.
One study shows that over the long term (1965-2006), ‘sin stock’ portfolios have tended to outperform their peers. Another shows that screening constraints can be costly, with the scale depending on the extent of constraints (ranging from a few basis points for index fund up to 30 bpts per month for active funds). One more study shows that SRI funds in the UK and US show similar performance to conventional funds, whereas those in Europe and Asia-Pacific strongly underperform. Another has shown that studies are inconclusive when it comes to out/under performance of SRI screening. One study showed that portfolios with positive screens outperformed those with negative screens. Others have shown little difference in performance of SRI and non-SRI funds by studying the results of multiple other studies. The skew is probably weakly towards the risk of underperformance, which is why the focus of ESG investing appears to have shifted towards ESG integration.
Renaissance Capital
14 January 2019
ESG
48