

GS EM Strategy Views_watermark
.pdfvk.com/id446425943
Goldman Sachs
EM Strategy Views
Exhibit 10: EMs tend to rotate from ‘extreme underperformance to outperformance’ from one year to the next
Countries tend not to remain at the top/bottom of the order (x-asset index)
2014 |
|
2015 |
|
2016 |
|
2017 |
|
2018 |
|
||||||||
Indonesia |
|
0.2% |
|
Russia |
|
0.1% |
|
Brazil |
0.5% |
|
Poland |
|
0.3% |
|
Brazil |
|
0.0% |
India |
|
0.2% |
|
Hungary |
|
0.1% |
|
Russia |
0.3% |
|
Peru |
|
0.2% |
|
Thailand |
|
0.0% |
Turkey |
|
0.1% |
|
India |
|
0.0% |
|
Peru |
0.2% |
|
Hungary |
|
0.2% |
|
Peru |
|
0.0% |
Philippines |
|
0.1% |
|
China |
|
0.0% |
|
South Africa |
0.2% |
|
South Africa |
|
0.2% |
|
Malaysia |
|
0.0% |
Thailand |
|
0.1% |
|
Korea |
|
0.0% |
|
Colombia |
0.2% |
|
Korea |
|
0.2% |
|
Czech Rep. |
|
0.0% |
Peru |
|
0.1% |
|
Philippines |
|
0.0% |
|
Indonesia |
0.2% |
|
Chile |
|
0.2% |
|
Taiwan |
|
0.0% |
China |
|
0.1% |
|
Taiwan |
|
0.0% |
|
Chile |
0.1% |
|
Thailand |
|
0.2% |
|
Colombia |
|
-0.1% |
South Africa |
|
0.0% |
|
Indonesia |
|
-0.1% |
|
Hungary |
0.1% |
|
China |
|
0.2% |
|
China |
|
-0.1% |
Korea |
|
0.0% |
|
Thailand |
|
-0.1% |
|
Thailand |
0.1% |
|
Indonesia |
|
0.2% |
|
Russia |
|
-0.1% |
Taiwan |
|
0.0% |
|
Czech Rep. |
|
-0.1% |
|
India |
0.1% |
|
Brazil |
|
0.2% |
|
Mexico |
|
-0.1% |
Mexico |
|
0.0% |
|
Poland |
|
-0.1% |
|
Taiwan |
0.0% |
|
Malaysia |
|
0.2% |
|
Korea |
|
-0.1% |
Brazil |
|
0.0% |
|
Mexico |
|
-0.1% |
|
Korea |
0.0% |
|
India |
|
0.2% |
|
Poland |
|
-0.1% |
Malaysia |
|
0.0% |
|
Chile |
|
-0.1% |
|
Malaysia |
0.0% |
|
Mexico |
|
0.1% |
|
India |
|
-0.1% |
Chile |
|
0.0% |
|
Malaysia |
|
-0.1% |
|
China |
0.0% |
|
Philippines |
|
0.1% |
|
Hungary |
|
-0.1% |
Czech Rep. |
|
-0.1% |
|
Peru |
|
-0.2% |
|
Philippines |
0.0% |
|
Czech Rep. |
|
0.1% |
|
Chile |
|
-0.1% |
Poland |
|
-0.1% |
|
Turkey |
|
-0.2% |
|
Poland |
0.0% |
|
Colombia |
|
0.1% |
|
Philippines |
|
-0.1% |
Hungary |
|
-0.1% |
|
South Africa |
|
-0.2% |
|
Czech Rep. |
0.0% |
|
Russia |
|
0.1% |
|
Indonesia |
|
-0.1% |
Colombia |
|
-0.1% |
|
Colombia |
|
-0.3% |
|
Turkey |
-0.1% |
|
Turkey |
|
0.1% |
|
South Africa |
|
-0.2% |
Russia |
|
-0.4% |
|
Brazil |
|
-0.3% |
|
Mexico |
-0.1% |
|
Taiwan |
|
0.1% |
|
Turkey |
|
-0.3% |
Source: Datastream, FactSet, Goldman Sachs Global Investment Research
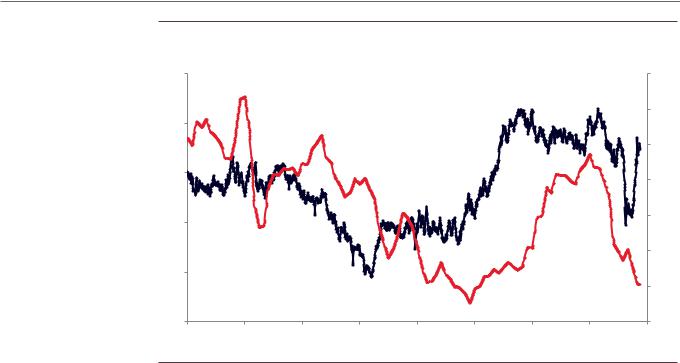
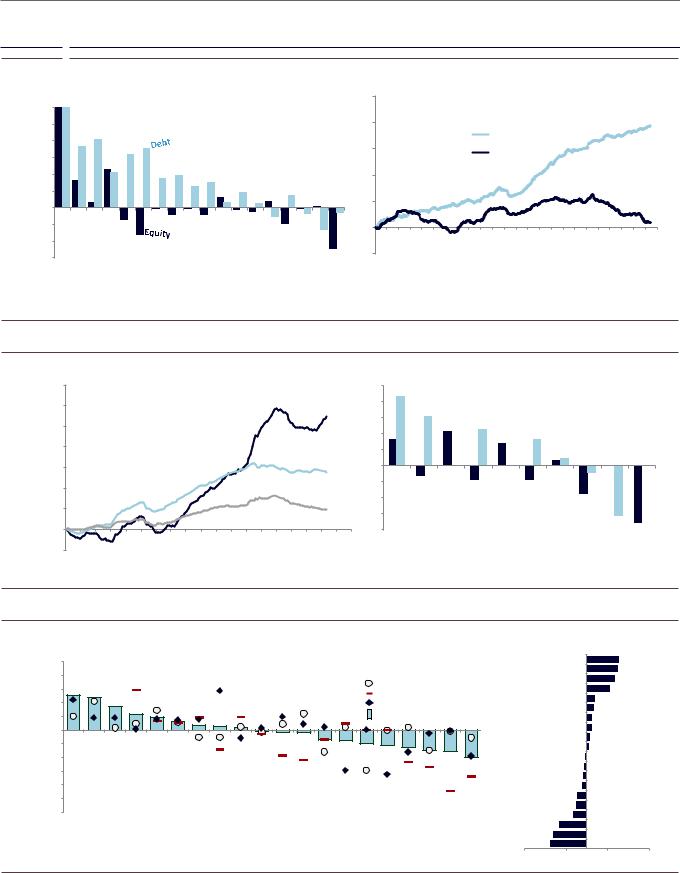
More broadly, our economic outlook outlined how several large EM economies have weighed heavily on the aggregate growth data for EM (Brazil, Russia, Turkey, and South Africa). Improvements in these economies is critical to stabilizing the EM growth differential vs. the US (which in turn tends to be indicative of EM asset stability). But we note that markets appear to have priced a significant improvement in their growth data already (see Exhibit 11). Assets in Brazil and Turkey have moved the needle to a greater extent here, with equities holding up in Russia and South Africa (in local terms); we still see more upside in FX for the latter two markets (and modestly in Brazil as well).
26 November 2018 |
11 |
vk.com/id446425943
Goldman Sachs
EM Strategy Views
Exhibit 11: The ‘weak economies’ of this year have already priced improvement heading into 2019
105 |
|
Growth and pricing in the "BRTS" vs the Rest |
|
2% |
||||
|
|
|
(Brazil, Russia, Turkey, and South Africa) |
|
|
|
||
|
|
|
|
|
|
|
|
1% |
100 |
|
|
|
Relative market pricing of |
|
|
|
|
|
|
|
|
|
|
|
||
|
|
|
|
growth vs rest of EM |
|
|
0% |
|
|
|
|
|
(cyc vs def EQ, 2s-10s |
|
|
||
|
|
|
|
|
|
|
||
95 |
|
|
|
slop, Real TWI FX) |
|
|
|
|
|
|
|
|
|
|
|
-1% |
|
|
|
|
|
|
|
|
|
|
90 |
|
|
|
|
|
|
|
-2% |
|
|
|
|
|
|
|
|
|
|
|
|
|
|
|
|
|
-3% |
85 |
|
|
|
|
|
CAI differentia vs |
|
|
|
|
|
|
|
|
-4% |
||
|
|
|
|
|
|
|
rest of EM |
|
|
|
|
|
|
|
(3mo mov avg, RHS) |
|
|
80 |
|
|
|
|
|
|
|
-5% |
2011 |
2012 |
2013 |
2014 |
2015 |
2016 |
2017 |
2018 |
2019 |
Source: Datastream, FactSet, Goldman Sachs Global Investment Research
(8) China - a known risk to EM, but FX spillovers have declined
Bottom Line: China trade and growth concerns are paramount for macro EM investing, but local bonds are trading less China-centric vs. recent history, and we expect growth improvement in China to boost the equity more than FX.
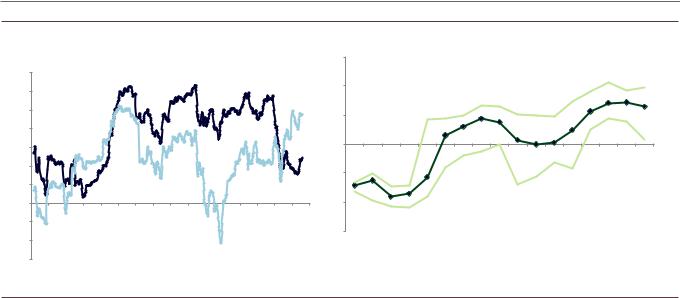
Outside the US-focused concerns (weaker growth and higher rates), macro investors remain in ‘prove it to me’ mode regarding the potential for China data to improve after a meaningful deceleration over the past six months (our CAI suggests activity has fallen from a sequential run rate above 7% in the Spring to below 6% currently). The importance of the Chinese economy to global growth and to EM investing (particularly equities given the 30%+ weighting of Chinese equities in the benchmark index) is well known, but we note that at the margin, EM FX and local bonds appear to be trading less China-centric (see Exhibit 12 left-hand side).
Anecdotally, we find that macro investors are focused on the CNY in particular, as USD/CNY has been skirting the 7.00 level for the past two months. As we show below, EM equities are still highly correlated with CNY moves, but EM local bonds (GBI-EM) are currently trading with the lowest correlation to the CNY since early 2015 (before the surprise CNY devaluation that summer).
We have made the case above for owning EM equity in terms of the distribution of returns around US growth and interest rate outcomes (where local bonds did screen as attractively), but we would note that from a China-risk perspective, EM local seems a safer asset class. As shown below on the right-hand side, there is still a general relationship between China equity risk and EM local bonds, but outside the extremes, the potential for strong EM local bond returns is high.
26 November 2018 |
12 |
vk.com/id446425943
Goldman Sachs
EM Strategy Views
Exhibit 12: Local bonds trade with low correlation to the CNY and are less China-dependent in general
Weekly Return Correlation |
|
Correlation of CNY |
|
|
|
|
|
15% |
GBI-EM |
|
|
EM local bond performance given |
|
|
|
|
||||||||||||||||||
(6-mo rolling) |
|
|
|
|
|
|
|
|
|
|
|
|
|
|
|
|||||||||||||||||||
0.7 |
|
|
|
|
with EM Equity and EM Local Bonds |
|
|
|
|
6mo Performance |
6mo China local equity performance |
|
|
|
||||||||||||||||||||
0.6 |
|
|
|
|
|
|
|
|
|
|
|
|
|
|
|
10% |
|
|
|
|
|
|
|
|
|
|
|
|
|
|
|
|
|
|
|
|
|
|
|
|
|
|
|
|
|
|
|
|
|
|
|
|
|
|
|
|
|
|
|
|
|
|
|
|
|
|
|
||
0.5 |
|
|
|
|
|
|
|
|
|
|
|
|
|
|
Equity |
|
|
|
|
|
|
|
|
|
|
|
|
|
|
|
|
|
||
|
|
|
|
|
|
|
|
|
|
|
|
|
|
|
5% |
|
|
|
|
|
|
|
|
|
|
|
|
|
|
|
|
|
||
|
|
|
|
|
|
|
|
|
|
|
|
|
|
|
|
|
|
|
|
|
|
|
|
|
|
|
|
|
|
|
|
|
||
0.4 |
|
|
|
|
|
|
|
|
|
|
|
|
|
|
|
|
|
|
|
|
|
|
|
|
|
|
Median |
|
|
|
|
|
||
|
|
|
|
|
|
|
|
|
|
|
|
|
|
|
|
0% |
|
|
|
|
|
|
|
|
|
|
|
|
|
|
|
|||
0.3 |
|
|
|
|
|
|
|
|
|
|
|
|
|
|
|
|
|
|
|
|
|
|
|
|
|
|
|
|
|
|
|
|
||
|
|
|
|
|
|
|
|
|
|
|
|
|
|
|
|
|
|
|
|
|
|
|
|
|
|
|
|
|
|
|
|
|
||
0.2 |
|
|
|
|
|
|
|
|
|
|
|
|
|
|
|
-5% |
|
|
|
|
|
|
|
|
|
|
|
|
|
|
|
|
|
|
|
|
|
|
|
|
|
|
|
|
|
|
|
|
|
|
|
|
|
|
|
|
|
|
|
|
|
|
|
|
|
|
|
||
0.1 |
|
|
|
|
|
|
|
|
|
|
|
|
|
GBI-EM |
|
|
|
|
|
|
|
|
|
|
|
25th - 75th |
|
|
|
|||||
0 |
|
|
|
|
|
|
|
|
|
|
|
|
|
|
|
-10% |
|
|
|
|
|
|
|
|
|
|
|
|
|
|
||||
|
|
|
|
|
|
|
|
|
|
|
|
|
|
|
|
|
|
|
|
|
|
|
|
|
|
percentile |
|
|
|
|||||
|
|
|
|
|
|
|
|
|
|
|
|
|
|
|
|
|
|
|
|
|
|
|
|
|
|
|
|
|
|
|||||
-0.1 |
|
|
|
|
|
|
|
|
|
|
|
|
|
|
|
-15% |
|
|
|
|
|
|
|
|
|
|
|
|
MSCI China 6mo |
|
|
|||
15-Jan |
15-Apr |
15-Jul |
15-Oct |
16-Jan |
16-Apr |
16-Jul |
16-Oct |
17-Jan |
17-Apr |
17-Jul |
17-Oct |
18-Jan |
18-Apr |
18-Jul |
18-Oct |
<-30% |
30%-to -25% |
25%-to -20% |
20%-to -15% |
15%-to -10% |
10%- to -5% |
5%-to -2.5% |
2.5%- to 0% |
0%to 2.5% |
2.5%to 5% |
5%to 7.5% |
7.5%to 10% |
to10%12.5% |
12.5%to 15% |
15%to 20% |
20%to 25% |
>25% |
||
19-Jan |
||||||||||||||||||||||||||||||||||
-0.2 |
|
|
|
|
|
|
|
|
|
|
|
|
|
|
|
|
|
|
|
|
|
|
|
|
|
|
|
|
|
|
|
|
|
|
-0.3 |
|
|
|
|
|
|
|
|
|
|
|
|
|
|
|
|
|
|
|
|
|
|
|
|
|
|
|
|
|
|
|
|
|
|
Source: Datastream, Goldman Sachs Global Investment Research
26 November 2018 |
13 |

vk.com/id446425943
Goldman Sachs
EM Strategy Views
Appendix – Macro Forecasts and Activity
Goldman Sachs macro forecasts for major EMs and world aggregates
|
|
|
Market |
|
GDP growth |
|
|
Inflation |
|
|
|
Policy Rates |
|
|
|
FX Forecast (USD) |
|
|
|
|
|
|
2017E |
2018E |
2019E |
2017E |
2018E |
2019E |
Current |
2018E |
2019E |
Current |
3-m |
6-m |
12-m |
|
|||
|
|
|
|
|
|||||||||||||||
|
|
|
Brazil |
1.0 |
1.2 |
2.6 |
3.5 |
3.7 |
4.0 |
6.50 |
6.50 |
8.00 |
3.82 |
|
3.70 |
3.60 |
3.60 |
|
|
|
|
|
|
||||||||||||||||
|
|
|
Chile |
1.5 |
4.0 |
3.6 |
2.2 |
2.5 |
3.3 |
2.75 |
3.00 |
4.00 |
674 |
|
650 |
640 |
630 |
|
|
|
|
|
China |
6.9 |
6.6 |
6.2 |
1.6 |
2.2 |
2.5 |
2.37 |
2.50 |
2.50 |
6.94 |
|
7.00 |
7.10 |
6.90 |
|
|
|
|
|
Colombia |
1.8 |
2.6 |
3.2 |
4.3 |
3.3 |
3.4 |
4.25 |
4.25 |
5.00 |
3229 |
|
3050 |
3000 |
2950 |
|
|
|
|
|
Czech Rep. |
4.5 |
2.8 |
2.9 |
2.4 |
2.2 |
2.3 |
1.75 |
1.75 |
2.00 |
22.85 |
|
22.77 |
21.71 |
21.04 |
|
|
|
|
|
Hungary |
4.3 |
4.8 |
3.5 |
2.4 |
3.0 |
3.2 |
0.90 |
0.90 |
1.25 |
284.12 |
|
283.90 |
271.80 |
262.50 |
|
|
|
|
|
India |
6.3 |
7.5 |
7.3 |
3.3 |
4.1 |
5.2 |
6.50 |
6.50 |
7.25 |
70.94 |
|
74.00 |
74.00 |
71.00 |
|
|
|
|
|
Indonesia |
5.1 |
5.2 |
5.0 |
3.8 |
3.1 |
3.5 |
6.00 |
6.00 |
6.25 |
14540 |
|
15000 |
14800 |
14400 |
|
|
|
|
|
Korea |
3.1 |
2.7 |
2.5 |
1.9 |
1.5 |
1.8 |
1.50 |
1.75 |
2.00 |
1130 |
|
1140 |
1160 |
1170 |
|
|
|
|
|
Malaysia |
5.9 |
4.8 |
4.6 |
3.8 |
1.1 |
2.3 |
3.25 |
3.25 |
3.25 |
4.19 |
|
4.20 |
4.25 |
4.20 |
|
|
|
|
|
Mexico |
2.0 |
2.2 |
1.9 |
6.0 |
4.9 |
4.3 |
8.00 |
8.00 |
8.00 |
20.37 |
|
19.75 |
19.50 |
19.25 |
|
|
|
|
|
Peru |
2.5 |
3.9 |
4.1 |
2.8 |
1.3 |
2.8 |
2.75 |
2.75 |
4.00 |
3.38 |
|
3.30 |
3.27 |
3.25 |
|
|
|
|
|
Philippines |
6.7 |
6.3 |
6.0 |
2.9 |
5.4 |
3.9 |
4.75 |
4.50 |
4.25 |
52.46 |
|
53.00 |
52.00 |
50.00 |
|
|
|
|
|
Poland |
4.9 |
5.3 |
3.8 |
2.0 |
1.7 |
2.4 |
1.50 |
1.50 |
1.75 |
3.78 |
|
3.79 |
3.59 |
3.46 |
|
|
|
|
|
Russia |
1.5 |
1.7 |
1.8 |
3.7 |
2.8 |
4.3 |
7.50 |
7.50 |
7.00 |
66.29 |
|
70.00 |
68.00 |
65.00 |
|
|
|
|
|
South Africa |
1.3 |
0.8 |
2.2 |
5.3 |
4.6 |
4.4 |
6.75 |
6.75 |
6.25 |
13.86 |
|
14.25 |
13.75 |
13.50 |
|
|
|
|
|
Taiwan |
2.9 |
2.7 |
2.3 |
0.6 |
1.5 |
1.1 |
1.38 |
1.38 |
1.75 |
30.90 |
|
31.50 |
31.50 |
31.00 |
|
|
|
|
|
Thailand |
3.9 |
4.2 |
3.7 |
0.7 |
1.2 |
1.4 |
1.50 |
1.50 |
1.75 |
33.05 |
|
34.00 |
34.50 |
33.50 |
|
|
|
|
|
Turkey |
7.4 |
3.0 |
-1.5 |
11.1 |
17.2 |
22.1 |
24.00 |
24.00 |
18.00 |
5.29 |
|
5.50 |
6.00 |
6.50 |
|
|
|
|
|
EM |
4.9 |
5.0 |
4.7 |
3.4 |
3.5 |
4.1 |
- |
- |
- |
- |
|
- |
- |
- |
|
|
|
|
|
DM |
2.4 |
2.4 |
2.1 |
1.7 |
2.0 |
1.6 |
- |
- |
- |
- |
|
- |
- |
- |
|
|
|
|
|
World |
3.7 |
3.8 |
3.5 |
3.7 |
3.5 |
3.2 |
- |
- |
- |
- |
|
- |
- |
- |
|
|
|
|
|
|
|
|
|
|
|
|
|
|
|
|||||||
Source: Haver Analytics, FactSet, Goldman Sachs Global Investment Research |
|
|
|
|
|
|
|
|
|
|
|
|
|||||||
|
|
|
|
|
|
|
|
||||||||||||
Goldman Sachs Current Activity Indicators (3-month smoothed) |
|
|
Current activity indicators across EMs |
|
|
|
|
||||||||||||
% |
|
|
|
|
|
|
|
|
3-mo |
|
|
2.0 |
Momentum |
|
|
|
|
|
|
6.0 |
|
|
|
|
|
EM CAI |
|
|
|
|
|
(last 3-mo vs prior |
|
|
|
|
|
||
|
|
|
|
|
|
|
smoothed |
|
|
|
|
|
|
|
|||||
|
|
|
|
|
|
|
|
|
|
3-mo chg in CAI, %) |
BRL |
|
|
|
|||||
5.0 |
|
|
|
|
(Avg. of 19 major EM CAIs) |
|
|
|
1.0 |
|
|
|
|
|
|||||
|
|
|
|
|
|
|
|
|
|
|
|
|
|
||||||
|
|
|
|
|
|
|
|
|
|
|
|
|
|
|
|
|
|
||
4.0 |
|
|
|
|
|
|
|
|
|
|
|
|
|
|
MXN |
IDR |
|
THB |
|
|
|
|
|
|
|
|
|
|
|
|
|
|
|
|
|
|
|
||
|
|
|
|
|
|
|
|
|
|
|
0.0 |
|
|
|
|
|
|
|
|
|
|
|
|
|
|
|
|
|
|
|
|
|
|
INR |
|
|
|
|
|
3.0 |
|
|
|
|
|
|
|
|
|
|
|
|
|
|
MYR |
PLN |
|
||
|
|
|
|
|
|
|
|
|
|
|
|
|
ZAR |
PHP |
|
||||
|
|
|
|
|
|
|
|
|
|
|
|
-1.0 |
RUB |
|
CZK |
|
|
HUF |
|
2.0 |
|
|
|
|
|
|
|
|
|
|
|
|
|
|
|
||||
|
|
|
|
|
|
|
|
|
3-mo |
|
|
CLP KRW |
COP CNY |
|
|
|
|||
|
|
|
|
|
|
|
|
|
|
|
|
|
|
|
|
|
|
||
1.0 |
|
|
|
|
|
|
|
DM CAI |
smoothed |
|
|
|
TWD |
|
Growth |
|
|||
|
|
|
|
|
|
|
|
|
-2.0 |
|
|
|
|
|
|
||||
|
|
|
|
|
|
|
|
|
|
|
|
|
|
|
|
||||
|
|
|
|
|
|
(Avg. of US, Euro Area, and Japan CAIs) |
|
|
|
PEN |
|
|
|
(Current CAI vs. |
|||||
0.0 |
|
|
|
|
|
|
|
|
|
|
Consensus long-term |
||||||||
|
Jul-14 |
|
Jan-15 |
Apr-15 Jul-15 |
Oct-15 Jan-16 Apr-16 Jul-16 |
|
Jan-17 |
Apr-17 Jul-17 Oct-17 |
Jan-18 Apr-18 Jul-18 Oct-18 |
Jan-19 |
|
|
|
|
|||||
Jan-14 |
Apr-14 |
Oct-14 |
Oct-16 |
-3.0 |
|
|
|
|
|
growth, %) |
|
||||||||
|
|
|
|
|
|
|
|||||||||||||
|
|
|
|
|
|
|
|
|
|
|
|
-3.0 |
-2.0 |
-1.0 |
0.0 |
1.0 |
2.0 |
3.0 |
4.0 |
Source: Goldman Sachs Global Investment Research |
Source: Consensus Economics, Goldman Sachs Global Investment Research |
Goldman Sachs Financial Conditions Index
102.5 |
|
EM FCI |
|
|
|
|
|
|
|
|
|
|
102.0 |
|
|
|
|
|
|
|
|
|
|
||
101.5 |
|
|
|
|
|
|
|
|
|
|
|
|
101.0 |
|
|
|
|
|
|
|
|
|
|
|
|
100.5 |
|
|
|
|
|
|
|
|
|
|
|
|
100.0 |
|
|
|
|
|
|
|
|
|
|
|
|
99.5 |
|
|
|
|
|
|
|
|
|
|
|
|
99.0 |
|
|
|
|
|
|
|
|
Easier financial |
|
|
|
|
|
|
|
|
DM FCI |
|
|
|
|
|||
98.5 |
|
|
|
|
|
|
conditions |
|
|
|||
98.0 |
|
|
|
|
|
|
|
|
|
|
|
|
Jan-13 |
Jul-13 |
Jan-14 |
Jul-14 |
Jan-15 |
Jul-15 |
Jan-16 |
Jul-16 |
Jan-17 |
Jul-17 |
Jan-18 |
Jul-18 |
Jan-19 |
EM inflation and policy monitor
|
|
Inflation |
Inflation & Policy Monitor |
|
||||
2.0pp |
|
Change |
|
|||||
|
|
(now vs. |
|
|
|
|
|
|
1.5pp |
|
3-mo ago) |
|
|
|
|
|
|
|
|
|
|
|
|
|
|
|
1.0pp |
|
|
PEN |
|
RUB |
|
|
|
|
|
|
KRW |
CNY CLP |
|
|
|
|
0.5pp |
MYR |
BRL |
MXN |
PHP |
|
|||
|
|
|
COP HUF |
|
|
|
||
0.0pp |
|
|
|
|
|
|
|
|
|
THB |
|
CZK |
IDR |
|
|
|
|
|
|
|
ZAR |
|
|
|||
(0.5pp) |
|
|
|
|
|
|
|
|
|
TWD PLN |
|
INR |
|
Cutting |
|
||
|
|
|
|
|
||||
(1.0pp) |
|
|
|
|
|
|||
|
|
|
|
|
|
No Chg. |
|
|
(1.5pp) |
|
|
|
|
|
|
Hiking |
|
|
|
|
|
|
|
Inflation Rate |
||
|
|
|
|
|
|
|
||
(2.0pp) |
|
|
|
|
|
|
(current, yoy) |
|
|
0% |
1% |
2% |
3% |
4% |
5% |
6% |
7% |
Source: Goldman Sachs Global Investment Research |
Source: Haver Analytics, Goldman Sachs Global Investment Research |
26 November 2018 |
14 |
vk.com/id446425943
Goldman Sachs
EM Strategy Views
Central Bank Policy and Inflation
Policy Rate
Inflation (%)
Level (%) |
Market Pricing (cum.) |
GS Forecasts |
Recent Policy Changes |
|
Curr |
12m fwd 3m ch |
Current |
Real |
3mo |
6mo |
12mo |
3mo |
6mo |
12mo |
1m |
2m |
3m |
3-6m |
|
Brazil |
4.5 |
4.2 |
+0.0 |
6.50 |
1.97 |
-5 |
+5 |
+35 |
+0 |
+75 |
+150 |
+0 |
+0 |
+0 |
+0 |
Chile |
2.9 |
3.2 |
+0.3 |
2.75 |
-0.16 |
+21 |
+37 |
+90 |
+50 |
+75 |
+125 |
+25 |
+0 |
+0 |
+0 |
China |
2.4 |
2.3 |
+0.6 |
2.39 |
-0.01 |
+10 |
+16 |
+23 |
-5 |
-30 |
-5 |
-21 |
+35 |
-18 |
-67 |
Colombia |
3.4 |
3.3 |
+0.2 |
4.25 |
0.89 |
+5 |
+30 |
+89 |
+0 |
+50 |
+75 |
+0 |
+0 |
+0 |
+0 |
Czech Rep |
2.2 |
2.3 |
-0.1 |
1.75 |
-0.46 |
+14 |
+26 |
+34 |
+25 |
+25 |
+25 |
+25 |
+0 |
+25 |
+50 |
Hungary |
3.9 |
3.1 |
+0.4 |
0.90 |
-2.97 |
+13 |
+35 |
+93 |
+0 |
+0 |
+35 |
+0 |
+0 |
+0 |
+0 |
India |
3.3 |
4.8 |
-0.9 |
6.50 |
3.24 |
+7 |
+17 |
+24 |
+0 |
+25 |
+75 |
+0 |
+0 |
+25 |
+25 |
Indonesia |
3.2 |
3.7 |
-0.0 |
6.00 |
2.84 |
|
|
|
|
|
|
+25 |
+0 |
+25 |
+75 |
Korea |
1.9 |
1.8 |
+0.4 |
1.50 |
-0.44 |
+16 |
+17 |
+17 |
+25 |
+25 |
+50 |
+0 |
+0 |
+0 |
+0 |
Malaysia |
0.6 |
2.0 |
-0.3 |
3.25 |
2.67 |
+3 |
+5 |
+3 |
+0 |
+0 |
+0 |
+0 |
+0 |
+0 |
+0 |
Mexico |
4.9 |
3.9 |
+0.1 |
8.00 |
3.09 |
+44 |
+56 |
+51 |
+0 |
+0 |
+0 |
+25 |
+0 |
+0 |
+25 |
Peru |
1.8 |
2.4 |
+0.2 |
2.75 |
0.90 |
|
|
|
|
|
|
+0 |
+0 |
+0 |
+0 |
Philippines |
6.7 |
4.5 |
+0.8 |
4.75 |
-1.92 |
+76 |
+39 |
+34 |
-25 |
-25 |
-50 |
+25 |
+0 |
+50 |
+75 |
Poland |
1.9 |
2.3 |
-0.3 |
1.50 |
-0.41 |
+2 |
+5 |
+12 |
+0 |
+0 |
+25 |
+0 |
+0 |
+0 |
+0 |
Romania |
4.2 |
-- |
-0.3 |
2.50 |
-1.72 |
+37 |
+36 |
+78 |
+0 |
+25 |
+50 |
+0 |
+0 |
+0 |
+0 |
Russia |
3.5 |
4.4 |
+1.1 |
7.50 |
3.99 |
+41 |
+92 |
+67 |
+0 |
-25 |
-50 |
+0 |
+25 |
+0 |
+0 |
South Africa |
5.2 |
5.2 |
+0.0 |
6.75 |
1.57 |
+9 |
+18 |
+34 |
+0 |
+0 |
-50 |
+25 |
+0 |
+0 |
+0 |
Taiwan |
1.4 |
1.4 |
-0.5 |
1.38 |
0.00 |
+24 |
+4 |
-0 |
+0 |
+13 |
+38 |
+0 |
+0 |
+0 |
+0 |
Thailand |
1.2 |
1.4 |
-0.3 |
1.50 |
0.27 |
+5 |
+9 |
+34 |
+25 |
+25 |
+25 |
+0 |
+0 |
+0 |
+0 |
Turkey |
25.3 |
19.0 |
+9.5 |
24.00 |
-1.31 |
-65 |
-47 |
-116 |
+0 |
+0 |
-600 |
+0 |
+625 |
+0 |
+975 |
75 |
Tight |
Financial Conditions |
|
||
|
|
3mo Change |
50 |
|
(Bars) |
|
|
|
|
|
Current |
|
|
(vs 3yr average, RHS, |
25 |
|
Dots) |
|
|
0 |
|
|
|
|
|
|
|
|
|
|
|
|
|
|
|
|
-25 |
|
|
|
|
|
|
|
|
|
|
|
|
|
|
|
|
-50 |
|
|
|
|
|
|
|
|
|
|
|
|
|
|
|
|
Loose |
|
|
|
|
|
|
|
|
|
|
|
|
|
|
|
|
-75 |
Russia |
Indonesia |
South Africa |
Thailand |
China |
Chile |
Mexico |
Hungary |
Korea |
Poland |
India |
Malaysia |
Czech Rep |
Brazil |
Turkey |
EM |
Philippines |
||||||||||||||||
|
|
|
|
Inflation Momentum |
|
|
TRY |
|||
250 |
current inflation (%) |
|
|
|
|
|||||
|
|
|
|
|
|
|
|
|||
|
7.0% |
|
|
|
|
|
|
|
|
|
200 |
6.5% |
|
|
|
|
|
PHP |
|
|
|
|
|
|
|
|
|
|
|
|
||
150 |
6.0% |
|
|
|
|
|
|
|
|
|
100 |
5.5% |
|
|
|
|
|
|
|
|
|
5.0% |
|
|
MXN |
|
|
|
|
|
||
|
|
|
|
|
|
|
|
|||
|
|
|
|
ZAR |
|
|
|
|
|
|
50 |
|
|
|
|
|
|
|
|
|
|
4.5% |
|
|
|
BRL |
|
|
|
|
|
|
|
|
|
|
|
|
|
|
|
||
0 |
4.0% |
|
|
RON |
|
|
|
|
|
|
|
|
|
|
HUF |
|
|
|
|
||
|
|
|
|
|
|
|
|
|
|
|
-50 |
3.5% |
INR |
|
|
COP |
RUB |
|
|
|
|
|
|
|
|
|
|
|
||||
|
3.0% |
|
IDR |
|
|
|
|
|
||
|
|
|
|
|
|
|
|
|||
-100 |
|
|
|
CLP |
|
|
|
|
||
|
|
|
|
|
|
|
|
|||
2.5% |
|
|
CZK |
|
|
|
|
|
|
|
|
|
|
|
|
CNY |
|
|
|
||
-150 |
|
|
|
|
|
|
|
|
|
|
2.0% |
|
|
PLN |
PEN |
KRW |
|
|
|
||
|
|
|
|
|
|
|
|
|||
-200 |
1.5% |
|
TWD |
|
|
|
|
|
|
|
|
|
THB |
|
|
|
|
|
|
||
|
1.0% |
|
|
|
|
|
|
|
|
|
-250 |
|
|
|
|
|
|
|
|
|
|
0.5% |
|
|
|
|
|
|
|
|
|
|
|
|
|
MYR |
|
|
current inflation vs 3mo ago (pp change) |
||||
|
0.0% |
|
|
|
|
|||||
|
|
|
|
|
|
|
|
|
|
|
|
-1.5% |
-1.0% |
-0.5% |
0.0% |
|
0.5% |
1.0% |
1.5% |
2.0% |
2.5% |
real policy rate (%) |
Inflation vs Policy |
|
|
|
TRY |
||||||||
|
|
|
|
(bps) |
|||||||||
|
|
|
|
|
|
|
|
|
|
|
|||
5.0% |
|
|
|
|
|
|
|
|
|
|
|
|
|
|
|
|
|
|
|
|
|
|
|
|
|
||
4.5% |
|
|
|
|
RUB |
|
|
|
|
|
125 |
||
4.0% |
|
|
|
|
|
|
|
|
|
||||
3.5% |
|
|
|
|
|
|
|
|
|
|
|
|
|
3.0% |
|
MYR |
|
IDR |
INR |
|
|
|
|
|
MXN |
75 |
|
2.5% |
|
|
|
|
|
|
|
|
|
|
|||
|
|
|
|
|
|
|
|
|
|
|
|
||
2.0% |
|
|
|
|
|
|
|
BRL |
|
|
|
|
|
1.5% |
|
|
|
|
PEN |
|
|
ZAR |
|
|
|
25 |
|
1.0% |
|
|
|
|
|
|
|
COP |
|
|
|
||
|
|
|
|
|
|
|
|
|
|
|
|
||
0.5% |
|
|
|
CNY THB |
|
|
|
|
|
|
|
|
|
0.0% |
|
|
|
|
|
|
|
|
|
|
|
||
|
|
|
|
|
|
|
|
|
|
|
|
|
|
|
|
|
TWD KRW |
|
CLP |
|
|
|
-25 |
||||
-0.5% |
|
|
|
|
|
|
|
||||||
|
|
|
|
|
|
|
|
|
|
|
|||
-1.0% |
|
|
|
CZK |
PLN |
|
|
|
|
|
|
|
|
-1.5% |
|
|
|
|
|
|
|
|
|
|
|
-75 |
|
-2.0% |
|
|
|
|
|
|
|
|
RON |
PHP |
|||
-2.5% |
|
|
|
|
|
|
|
|
|||||
|
|
|
|
|
|
|
|
|
|
||||
|
|
|
|
|
|
|
HUF |
|
|
|
|
|
|
-3.0% |
|
|
|
|
|
|
|
|
|
|
-125 |
||
|
|
|
|
|
|
|
|
|
|
|
|||
-3.5% |
|
|
|
|
|
|
|
current inflation minus target (%) |
|||||
|
|
|
|
|
|
||||||||
-4% |
-3% |
-2% |
-1% |
|
0% |
1% |
2% |
3% |
|||||
12mo Market Implied Policy Changes
Market implied
93 90 89
78
67 |
GS Forecasts |
51 |
35 34 34 34 34 24 23
17 12 3
0
|
Chile |
Colombia |
|
|
Mexico |
Brazil |
|
|
|
|
|
|
|
|
|
|
-116 |
Hungary |
Romania |
Russia |
Philippines |
Thailand |
Czech Rep |
South Africa |
India |
China |
Korea |
Poland |
Malaysia |
Taiwan |
Turkey |
Source: Haver Analytics, Bloomberg, Goldman Sachs Global Investment Research
26 November 2018 |
15 |
vk.com/id446425943
Goldman Sachs
EM Strategy Views
EM “Macro Slice” performance vs. MSCI EM
115 |
vs. MSCI EM |
|
|
|
|
|
|
|
|
145 |
||
|
|
|
|
|
|
|
|
|
||||
|
|
|
|
|
|
|
|
|
140 |
|||
|
|
|
|
|
|
|
|
|
|
|
|
|
110 |
|
|
|
|
|
|
|
|
|
|
|
135 |
|
|
|
|
|
|
|
|
|
|
|
|
|
|
|
|
|
|
|
|
|
|
|
|
|
130 |
105 |
|
|
|
|
|
|
|
|
|
|
|
125 |
|
|
|
|
|
|
|
|
|
|
|
|
|
|
|
|
|
|
|
|
|
|
|
|
|
120 |
100 |
|
|
|
|
|
|
|
|
External |
|
115 |
|
|
|
|
|
|
|
|
|
|
|
|||
|
|
|
|
|
|
|
|
|
Demand |
|
110 |
|
95 |
|
|
|
|
|
Domestic |
|
|
|
105 |
||
|
|
|
|
|
Cyclicals |
|
|
|
|
|||
|
|
|
|
|
|
|
|
|
100 |
|||
|
|
|
|
|
|
|
|
|
|
|
|
|
90 |
|
|
|
|
|
|
|
|
|
|
|
95 |
Dec-15 |
Mar-16 |
Jun-16 |
Sep-16 |
Dec-16 |
Mar-17 |
Jun-17 |
Sep-17 |
Dec-17 |
Mar-18 |
Jun-18 |
Sep-18 |
Dec-18 |
|
vs. MSCI EM |
|
|
|
|
|
|
|
|
110 |
||
|
|
|
|
|
|
|
|
|
|
|||
|
|
|
|
|
|
|
|
|
|
|
|
105 |
|
|
|
Commodity Cyclicals |
|
|
|
100 |
|||||
|
|
|
|
|
|
|
||||||
|
|
|
|
|
|
|
|
|
|
|
|
95 |
|
|
|
|
|
|
|
|
|
|
|
|
90 |
|
|
|
|
|
|
|
|
|
|
|
|
85 |
|
|
|
|
|
|
|
|
|
|
|
|
80 |
|
|
Jun-16 |
Sep-16 |
|
Mar-17 |
Jun-17 |
Sep-17 |
|
Mar-18 |
Jun-18 |
Sep-18 |
75 |
Dec-15 |
Mar-16 |
Dec-16 |
Dec-17 |
Dec-18 |
||||||||
|
vs. MSCI EM |
|
|
|
|
|
|
|
|
|
||
|
|
|
|
|
|
|
|
|
|
Banks |
|
|
|
|
|
Defensives |
|
|
|
|
|
|
|
||
Dec-15 |
Mar-16 |
Jun-16 |
Sep-16 |
Dec-16 |
Mar-17 |
Jun-17 |
Sep-17 |
Dec-17 |
Mar-18 |
Jun-18 |
Sep-18 |
Dec-18 |
EM valuation and earnings growth
MSCI EM Valuation
|
P/E |
P/B |
D/Y |
|
Earnings Growth |
|
|
|
(NTM) |
(LTM) |
(LTM) |
2017E |
2018E |
2019E |
2020E |
Brazil |
10.9 |
1.9 |
3.9 |
44.8 |
48.4 |
20.6 |
8.2 |
Chile |
15.0 |
1.8 |
3.0 |
17.2 |
25.3 |
15.2 |
7.2 |
China |
10.2 |
1.6 |
3.0 |
39.9 |
4.0 |
13.2 |
13.5 |
India |
17.2 |
2.9 |
1.7 |
14.8 |
8.0 |
18.7 |
18.4 |
Indonesia |
14.5 |
2.8 |
3.2 |
12.2 |
8.5 |
12.4 |
11.0 |
Korea |
7.2 |
0.9 |
2.8 |
49.8 |
12.4 |
1.1 |
9.0 |
Malaysia |
15.3 |
1.7 |
3.4 |
5.8 |
9.5 |
3.7 |
7.3 |
Mexico |
12.6 |
2.0 |
2.9 |
32.4 |
12.4 |
17.3 |
12.4 |
Philippines |
15.6 |
2.1 |
1.9 |
14.4 |
6.3 |
12.7 |
12.6 |
Poland |
11.1 |
1.4 |
3.3 |
30.9 |
0.6 |
8.1 |
10.0 |
Russia |
5.3 |
0.9 |
7.3 |
10.7 |
58.8 |
2.7 |
4.2 |
South Africa |
12.3 |
2.0 |
3.8 |
8.9 |
23.2 |
16.7 |
14.6 |
Taiwan |
12.2 |
1.7 |
4.7 |
15.3 |
1.3 |
1.2 |
9.8 |
Thailand |
13.7 |
2.0 |
3.1 |
26.0 |
6.9 |
5.1 |
6.6 |
Turkey |
5.8 |
1.0 |
5.8 |
45.6 |
13.3 |
7.2 |
25.8 |
EM (Local) |
10.3 |
1.5 |
3.4 |
31.2 |
13.3 |
9.0 |
11.0 |
EM (USD) |
|
|
|
29.4 |
14.1 |
8.9 |
11.1 |
*Earnings growth based on consensus estimates in local currency
25% |
|
|
|
|
|
|
|
MSCI EM |
|
|
|
|
2017 |
|
|
||
|
|
|
|
|
|
|
|
|
|
|
|
|
|
||||
20% |
|
|
|
|
(Consensus EPS growth revisions in USD) |
|
|
|
|
||||||||
15% |
|
|
|
|
|
|
|
|
|
|
|
|
|
|
|
2018 |
|
|
|
|
|
|
|
|
|
|
|
|
|
|
|
|
|
|
|
10% |
|
|
|
|
|
|
|
|
|
|
|
|
|
|
|
2019 |
|
|
|
|
|
|
|
|
|
|
|
|
|
|
2016 |
|
|||
5% |
|
2011 |
|
|
|
|
|
2013 |
|
|
|
|
|
|
|
||
0% |
|
|
|
|
|
|
|
|
|
|
|
|
|
|
|
||
|
|
|
|
|
2012 |
|
|
|
|
|
|
|
|
|
|
|
|
-5% |
|
|
|
|
|
|
|
|
|
|
|
|
|
|
|
|
|
|
|
|
|
|
|
|
|
|
2014 |
|
|
|
|
|
|
|
|
-10% |
|
|
|
|
|
|
|
|
|
|
|
|
|
|
|
|
|
|
|
|
|
|
|
|
|
|
|
|
2015 |
|
|
|
|
|
|
|
|
|
|
|
|
|
|
|
|
|
|
|
|
|
|
|
|
-15% |
|
|
|
|
|
|
|
|
|
|
|
|
|
|
|
|
|
Jun-10 |
Dec-10 |
Jun-11 |
Dec-11 |
Jun-12 |
Dec-12 |
Jun-13 |
Dec-13 |
Jun-14 |
Dec-14 |
Jun-15 |
Dec-15 |
Jun-16 |
Dec-16 |
Jun-17 |
Dec-17 |
Jun-18 |
Dec-18 |
EM cross asset valuation
|
|
|
|
|
|
|
|
|
|
|
|
Average Valuation |
|
|
|
|
|
|
|
|
|
||||
|
|
0.30 |
|
|
|
|
|
Z-Scores across Equity, FX, Credit, and local Bonds |
|
|
|
|
|
|
|||||||||||
|
|
0.10 |
|
|
|
|
|
|
|
|
|
|
|
|
|
|
|
|
|
|
|
|
|
|
|
|
|
(0.10) |
|
|
|
|
|
|
|
|
|
|
|
|
|
|
|
|
|
|
|
|
|
|
|
|
|
(0.30) |
|
|
|
|
|
|
|
|
|
|
|
|
|
|
|
|
|
|
|
|
|
|
|
|
|
(0.50) |
|
|
|
|
|
|
|
|
|
|
|
|
|
|
|
|
|
|
|
|
|
|
|
|
|
(0.70) |
|
|
|
|
|
|
|
|
|
|
|
|
|
|
|
|
|
|
|
|
|
|
|
|
|
(0.90) |
|
|
|
|
|
|
|
|
|
|
|
|
|
|
|
|
|
|
|
|
|
|
|
|
|
(1.10) |
|
+ive z-score = overvaluation, -ive z-score = undervaluation |
|
|
|
|
|
|
|
|
|
|
|
|
|
|
|
|
|||||
|
|
(1.30) |
|
|
|
|
|
|
|
|
|
|
|
|
|
|
|
|
|
||||||
|
|
(1.50) |
|
Equity valuation includes P/E, P/B, D/Y in z-score |
|
|
|
|
|
|
|
|
|
|
|
|
|
|
|
|
|
||||
|
|
|
Real bond yields using forward inflation expectations |
|
|
|
|
|
|
|
|
|
|
|
|
|
|
|
|
||||||
|
|
|
|
HUF |
PLN |
BRL |
THB |
CZK |
PHP |
PEN |
KRW |
INR |
CLP |
TWD |
CNY |
IDR |
COP |
TRY |
RUB |
MYR |
ZAR |
MXN |
|
EM |
|
|
Equity |
PE (NTM) |
9.3x |
10.7x |
11.1x |
14.0x |
14.0x |
15.3x |
13.4x |
7.2x |
17.0x |
14.9x |
12.6x |
9.9x |
13.8x |
10.0x |
5.7x |
5.3x |
15.3x |
12.1x |
13.5x |
|
10.2x |
|
|
|
FX |
GS DEER |
(19%) |
(24%) |
(10%) |
+0% |
(7%) |
(7%) |
(11%) |
+10% |
(7%) |
(19%) |
(3%) |
(22%) |
(8%) |
(24%) |
(71%) |
(10%) |
(19%) |
(41%) |
(26%) |
|
(17%) |
|
|
|
Credit |
Spread |
88bp |
71bp |
214bp |
- |
- |
100bp |
88bp |
- |
145bp |
55bp |
- |
74bp |
151bp |
144bp |
393bp |
162bp |
119bp |
239bp |
161bp |
|
399bp |
|
|
|
Bonds |
Real Rates |
0.5% |
0.9% |
5.9% |
1.5% |
-0.2% |
2.9% |
3.6% |
0.3% |
3.2% |
-1.5% |
- |
1.2% |
4.5% |
4.1% |
-2.8% |
4.5% |
2.5% |
4.6% |
5.7% |
|
2.3% |
|
|
|
|
Z-Score |
|
|
|
|
|
|
|
|
|
|
|
|
|
|
|
|
|
|
|
|
(0.79) |
|
|
|
Equity |
(0.10) |
(0.20) |
0.33 |
0.46 |
(0.23) |
(0.07) |
0.03 |
(1.71) |
(0.19) |
(0.83) |
(0.47) |
(0.44) |
(0.26) |
(0.66) |
(2.27) |
(1.05) |
(0.34) |
(0.67) |
(1.36) |
|
|
|||
|
FX |
Z-Score |
(1.54) |
(1.58) |
(0.92) |
(0.34) |
(0.65) |
(0.06) |
(1.23) |
(0.02) |
(1.29) |
(2.33) |
(0.41) |
(1.74) |
(1.43) |
(1.94) |
(2.77) |
(1.50) |
(1.54) |
(1.48) |
(2.39) |
|
(1.32) |
|
|
|
Credit |
Z-Score |
1.09 |
0.60 |
(0.20) |
- |
- |
0.52 |
0.76 |
- |
0.63 |
0.86 |
- |
0.48 |
0.38 |
0.15 |
(2.05) |
0.46 |
(0.10) |
(0.53) |
(0.40) |
|
(0.22) |
|
|
|
Bonds |
Z-Score |
1.36 |
1.95 |
0.58 |
(0.31) |
0.53 |
(1.25) |
(0.44) |
0.98 |
(0.50) |
0.76 |
- |
(0.25) |
(0.75) |
0.05 |
3.68 |
(1.45) |
(1.84) |
(1.64) |
(1.67) |
|
0.12 |
|
|
|
AVG |
Z-Score |
0.20 |
0.19 |
(0.05) |
(0.07) |
(0.11) |
(0.21) |
(0.22) |
(0.25) |
(0.34) |
(0.38) |
(0.44) |
(0.49) |
(0.52) |
(0.60) |
(0.85) |
(0.89) |
(0.95) |
(1.08) |
(1.46) |
|
(0.55) |
|
|
|
|
|
|
|
|
|
|
|
|
|
|
|
|
|
|
|
|
|
|
|
|
|
|
|
|
Source: FactSet, Datastream, Goldman Sachs Global Investment Research
26 November 2018 |
16 |
vk.com/id446425943
Goldman Sachs
EM Strategy Views
Flows and Positioning
EM portfolio investment and exchange-reported foreign flows
Foreign Inflows
Bil USD |
|
|
|
|
Balance of Payments |
|
|
|
|
|
|
250 |
EM exchange-reported foreign inflows |
|
|
|
|
|||||||
30 |
|
|
|
|
(Portfolio Inflows, last 4Q) |
|
|
|
|
|
|
|
($Bil, Cumulative) |
|
|
|
|
|||||||
25 |
|
|
|
|
|
|
|
|
|
|
|
|
|
|
|
|
|
200 |
|
|
|
|
|
|
20 |
|
|
|
|
|
|
|
|
|
|
|
|
|
|
|
|
|
|
Bond |
|
|
|
|
|
|
|
|
|
|
|
|
|
|
|
|
|
|
|
|
|
|
150 |
|
|
|
|
|
||
15 |
|
|
|
|
|
|
|
|
|
|
|
|
|
|
|
|
|
Equity |
|
|
|
|
||
|
|
|
|
|
|
|
|
|
|
|
|
|
|
|
|
|
|
|
|
|
|
|||
|
|
|
|
|
|
|
|
|
|
|
|
|
|
|
|
|
|
|
|
|
|
|
||
10 |
|
|
|
|
|
|
|
|
|
|
|
|
|
|
|
|
|
100 |
|
|
|
|
|
|
5 |
|
|
|
|
|
|
|
|
|
|
|
|
|
|
|
|
|
50 |
|
|
|
|
|
|
0 |
|
|
|
|
|
|
|
|
|
|
|
|
|
|
|
|
|
|
|
|
|
|
||
|
|
|
|
|
|
|
|
|
|
|
|
|
|
|
|
|
|
|
|
|
|
|
||
-5 |
|
|
|
|
|
|
|
|
|
|
|
|
|
|
|
|
|
0 |
|
|
|
|
|
|
|
|
|
|
|
|
|
|
|
|
|
|
|
|
|
|
|
|
|
|
|
|
|
||
-10 |
|
|
|
|
|
|
|
|
|
|
|
|
|
|
|
|
|
|
|
|
|
|
|
|
-15 |
|
|
|
|
|
|
|
|
|
|
|
|
|
|
|
|
|
-50 |
|
|
|
|
|
|
Mexico |
|
|
|
|
Peru |
Chile |
|
|
Brazil |
Colombia |
|
Poland |
Thailand |
|
|
|
Jan-15 |
Mar-15 May-15 Jul-15 Sep-15 Nov-15 Jan-16 Mar-16 May-16 Jul-16 Sep-16 Nov-16 Jan-17 Mar-17 May-17 Jul-17 Sep-17 |
Nov-17 |
Jan-18 Mar-18 May-18 Jul-18 |
Sep-18 |
Nov-18 |
||
China |
India |
SouthAfrica |
Korea |
Indonesia |
Turkey |
Russia |
Philippines |
Hungary |
CzechRep |
Taiwan |
||||||||||||||
Bond: India, Indonesia, Korea, Mexico, S. Africa, Thailand, Turkey |
|
|
Jan19- |
|||||||||||||||||||||
|
|
|
|
|
|
|
|
|
|
|
|
|
|
|
|
|
|
Equity: Brazil, India, Indonesia, Korea, Philippines, S. Africa, Taiwan, Thailand, Turkey |
||||||
Source: Haver Analytics, Bloomberg, Goldman Sachs Global Investment Research |
|
|
|
|
|
|
|
|
|
|
|
|
|
|
|
|
|||||||
Cumulative flows into EM mutual funds |
|
|
|
|
|
|
|
|
|
|
|
|
|
|
|
|
|
|
|||||
|
140 |
$bn |
|
Cumulative flows into EM funds |
|
|
|
|
2.5 |
Bil USD |
|
Inflows by country over the past month |
|
||||||||||
|
|
|
|
|
|
|
|
2 |
|
|
|
|
(reported by exchanges) |
|
|
|
|||||||
|
120 |
|
|
|
|
|
|
|
|
|
|
|
|
|
|
|
|
|
|
||||
|
|
|
|
|
EM equity |
|
|
|
|
|
|
|
|
|
|
|
|
|
|
|
|
||
|
|
|
|
|
|
|
|
|
|
|
|
|
|
|
|
|
|
|
|
|
|
||
|
|
|
|
|
|
|
|
|
|
|
|
1.5 |
|
|
|
|
|
|
|
|
|
|
|
Flows |
100 |
|
|
|
|
funds |
|
|
|
|
|
|
|
|
|
|
Debt Inflows |
|
|
|
|
||
|
|
|
|
|
|
|
|
|
|
|
1 |
|
|
|
|
|
|
|
|
||||
|
|
|
|
|
|
|
|
|
|
|
|
|
|
|
|
|
|
|
|
|
|
||
80 |
|
|
|
EM credit funds |
|
|
|
|
|
|
0.5 |
|
|
|
|
|
|
|
|
|
|
||
|
|
|
|
|
|
|
|
|
|
|
|
|
|
|
|
|
|
|
|
||||
60 |
|
|
|
(hard currency |
|
|
|
|
|
|
0 |
|
|
|
|
|
|
|
|
|
|
||
Fund |
|
|
|
bond funds) |
|
|
|
|
|
|
|
|
|
|
|
|
|
|
|
|
|||
|
EM bond funds |
|
|
|
|
|
|
|
|
|
|
|
|
|
|
|
|
|
|||||
40 |
|
|
|
|
|
|
|
|
-0.5 |
|
|
|
|
|
|
|
|
|
|
||||
|
|
(local currency |
|
|
|
|
|
|
|
|
-1 |
|
|
|
|
|
Equity Inflows |
|
|
|
|||
|
|
|
bond funds) |
|
|
|
|
|
|
|
|
|
|
|
|
|
|
|
|
||||
|
|
|
|
|
|
|
|
|
|
|
|
|
|
|
|
|
|
|
|
|
|||
|
20 |
|
|
|
|
|
|
|
|
|
|
|
-1.5 |
|
|
|
|
|
|
|
|
|
|
|
|
|
|
|
|
|
|
|
|
|
|
|
|
|
|
|
|
|
|
|
|
|
|
|
0 |
16-Mar |
16-May 16-Jul |
16-Sep 16-Nov 17-Jan |
17-Mar 17-May 17-Jul |
17-Sep 17-Nov 18-Jan 18-Mar |
18-May |
18-Jul |
18-Sep |
18-Nov |
19-Jan |
19-Mar |
-2 |
Indonesia |
Korea |
Taiwan |
India |
Philippines |
Thailand |
Turkey |
SouthAfrica |
Mexico |
Brazil |
|
16-Jan |
|
|||||||||||||||||||||
|
-20 |
|
|
|
|
|
|
|
|
|
|
|
|
|
|
|
|
|
|
|
|
|
|
Source: EPFR, Goldman Sachs Global Investment Research
Cross-asset mutual fund positioning
5% |
|
|
|
|
|
Cross-Asset Country Allocation |
4% |
|
|
|
|
|
relative to MSCI EM, EMBI Sov., GBI-EM |
|
|
|
|
|
Equity Funds
Positioning |
3% |
|
|
|
|
|
|
|
|
|
|
|
|
|
|
Credit Funds |
|
|
|
|
2% |
|
|
|
|
|
|
|
|
|
|
|
|
|
|
|
|
|
|||
|
|
|
|
|
|
|
|
|
|
|
|
|
|
|
|
|
|
|||
|
|
|
|
|
|
|
|
|
|
|
|
|
|
|
Loc. Bond Funds |
|
|
|||
|
1% |
|
|
|
|
|
|
|
|
|
|
|
|
|
|
Average |
|
|
|
|
|
0% |
|
|
|
|
|
|
|
|
|
|
|
|
|
|
|
|
|
|
|
|
-1% |
|
|
|
|
|
|
|
|
|
|
|
|
|
|
|
|
|
|
|
|
-2% |
|
|
|
|
|
|
|
|
|
|
|
|
|
|
|
|
|
|
|
Fund |
-3% |
|
|
|
|
|
|
|
|
|
|
|
|
|
|
|
|
|
|
|
-6% |
|
|
|
|
|
|
|
|
|
|
|
|
|
|
|
|
|
|
|
|
|
-4% |
|
|
|
|
|
|
|
|
|
|
|
|
|
|
|
|
|
|
|
|
-5% |
|
|
|
|
|
|
|
|
|
|
|
|
|
|
|
|
|
|
|
|
Brazil |
India |
Argentina |
Mexico |
Russia |
Indonesia |
South Africa |
Chile |
Turkey |
Colombia |
Peru |
China |
Korea |
Thailand |
Taiwan |
Czech Rep. |
Hungary |
Malaysia |
Philippines |
Poland |
Thailand |
|
|
|
Mexico |
|
|
|
Brazil |
|
|
|
Colombia |
|
|
|
Indonesia |
|
|
|
Hungary |
|
|
|
Czech Rep. |
|
|
|
Poland |
|
|
|
India |
|
|
|
Korea |
|
|
|
Malaysia |
|
|
|
Philippines |
|
|
|
Taiwan |
|
|
|
Peru |
|
|
|
Chile |
|
|
|
South Africa |
|
|
|
China |
|
|
|
Russia |
|
Chg in average |
|
Argentina |
|
positioning |
|
Turkey |
|
from 6-mo ago |
|
-1.5% |
-0.5% |
0.5% |
1.5% |
Source: EPFR, Goldman Sachs Global Investment Research
26 November 2018 |
17 |

vk.com/id446425943
Goldman Sachs
EM Strategy Views
FX Performance
|
|
|
|
|
|
|
|
|
|
|
|
|
|
|
|
Return vs USD |
Forecasts |
|
GS Fair Value |
FX Carry (%) |
|
|
|
|
||||||||||||||||||||
|
|
|
|
|
|
|
|
|
|
|
|
|
|
|
|
Spot |
|
1w% |
3m% |
YTD% |
|
3m |
6m |
12m |
|
DEER |
FEER |
% overval |
|
|
|
1yr fwd |
real 1y |
|
|
|
|
|
|
|||||
|
|
|
|
|
|
|
|
|
South Africa |
|
ZAR |
|
|
13.86 |
1.5 |
-5.8 |
-11.95 |
|
14.25 |
13.75 |
13.50 |
10.43 |
14.90 |
-14.0 |
|
|
|
4.5 |
1.7 |
|
|
|
|
|
|
|||||||||
|
|
|
|
|
|
|
|
|
India |
|
|
INR |
|
|
70.94 |
1.3 |
-3.4 |
-11.14 |
|
74.00 |
74.00 |
71.00 |
69.33 |
80.97 |
3.2 |
|
|
|
4.0 |
1.5 |
|
|
|
|
|
|
||||||||
|
|
|
|
|
|
|
|
|
Turkey |
|
|
TRY |
|
|
5.29 |
|
1.0 |
-7.7 |
-39.47 |
|
5.50 |
6.00 |
6.50 |
3.28 |
4.66 |
-29.3 |
|
|
|
20.1 |
3.4 |
|
|
|
|
|
|
|||||||
|
|
|
|
|
|
|
|
|
Philippines |
|
PHP |
|
|
52.46 |
0.5 |
1.2 |
-5.08 |
|
53.00 |
52.00 |
50.00 |
50.05 |
58.01 |
0.5 |
|
|
|
2.8 |
0.6 |
|
|
|
|
|
|
|||||||||
|
|
|
|
|
|
|
|
|
Indonesia |
|
IDR |
|
|
14540 |
0.5 |
-0.8 |
-7.17 |
|
15000 |
14800 |
14400 |
14085 |
15776 |
0.7 |
|
|
|
5.5 |
4.1 |
|
|
|
|
|
|
|||||||||
|
|
|
|
|
|
|
|
|
Egypt |
|
|
EGP |
|
|
17.89 |
0.1 |
0.0 |
-0.62 |
|
-- |
-- |
-- |
-- |
-- |
-- |
|
|
|
11.1 |
-- |
|
|
|
|
|
|
||||||||
|
|
|
|
|
|
|
|
|
China |
|
|
CNY |
|
|
6.94 |
|
0.1 |
-1.7 |
-6.60 |
|
7.00 |
7.10 |
6.90 |
5.73 |
7.40 |
-9.4 |
|
|
|
-0.4 |
-0.4 |
|
|
|
|
|
|
|||||||
|
|
|
|
|
|
|
|
|
Poland |
|
|
PLN |
|
|
3.78 |
|
0.0 |
-3.5 |
-8.88 |
|
3.79 |
3.59 |
3.46 |
3.10 |
4.22 |
-8.1 |
|
|
|
-1.1 |
-1.1 |
|
|
|
|
|
|
|||||||
|
|
|
|
|
|
|
|
|
Malaysia |
|
MYR |
|
|
4.19 |
|
0.0 |
-3.2 |
-3.63 |
|
4.20 |
4.25 |
4.20 |
3.53 |
4.45 |
-8.6 |
|
|
|
0.2 |
0.5 |
|
|
|
|
|
|
||||||||
|
|
|
|
|
|
|
|
|
Peru |
|
|
PEN |
|
|
3.38 |
|
-0.1 |
-3.2 |
-4.23 |
|
3.30 |
3.27 |
3.25 |
3.04 |
3.51 |
-5.4 |
|
|
|
1.3 |
1.2 |
|
|
|
|
|
|
|||||||
|
|
|
|
|
|
|
|
|
Czech Rep |
|
CZK |
|
|
22.85 |
-0.1 |
-4.5 |
-7.48 |
|
22.77 |
21.71 |
21.04 |
21.48 |
25.31 |
-0.4 |
|
|
|
-1.4 |
-1.3 |
|
|
|
|
|
|
|||||||||
|
|
|
|
|
|
|
|
|
Taiwan |
|
|
TWD |
|
|
30.90 |
-0.1 |
-0.9 |
-3.84 |
|
31.50 |
31.50 |
31.00 |
30.14 |
31.01 |
-1.5 |
|
|
|
-3.3 |
-2.4 |
|
|
|
|
|
|
||||||||
|
|
|
|
|
|
|
|
|
Korea |
|
|
KRW |
|
|
1130 |
-0.2 |
-1.1 |
-5.60 |
|
1140 |
1160 |
1170 |
1265 |
1202 |
10.0 |
|
|
|
-1.8 |
-1.2 |
|
|
|
|
|
|
||||||||
|
|
|
|
|
|
|
|
|
Thailand |
|
THB |
|
|
33.05 |
-0.2 |
0.7 |
-1.42 |
|
34.00 |
34.50 |
33.50 |
33.17 |
34.14 |
1.3 |
|
|
|
-1.5 |
-0.5 |
|
|
|
|
|
|
|||||||||
|
|
|
|
|
|
|
|
|
Romania |
|
RON |
|
|
4.11 |
|
-0.3 |
-3.9 |
-5.63 |
|
4.20 |
4.06 |
4.00 |
-- |
-- |
-- |
|
|
|
0.7 |
-- |
|
|
|
|
|
|
||||||||
|
|
|
|
|
|
|
|
|
Chile |
|
|
CLP |
|
|
674 |
|
-0.6 |
-5.4 |
-9.64 |
|
650 |
640 |
630 |
586 |
731 |
-5.9 |
|
|
|
-0.2 |
-1.0 |
|
|
|
|
|
|
|||||||
|
|
|
|
|
|
|
|
|
Hungary |
|
|
HUF |
|
|
284 |
|
-0.6 |
-3.7 |
-9.98 |
|
284 |
272 |
263 |
242 |
308 |
-7.1 |
|
|
|
-2.5 |
-3.3 |
|
|
|
|
|
|
|||||||
|
|
|
|
|
|
|
|
|
Russia |
|
|
RUB |
|
|
66.29 |
-0.6 |
-6.2 |
-15.14 |
|
70.00 |
68.00 |
65.00 |
59.63 |
60.72 |
-9.5 |
|
|
|
4.9 |
2.8 |
|
|
|
|
|
|
||||||||
|
|
|
|
|
|
|
|
|
Mexico |
|
|
MXN |
|
|
20.37 |
-0.9 |
-9.2 |
-4.12 |
|
19.75 |
19.50 |
19.25 |
16.16 |
19.11 |
-15.8 |
|
|
|
6.2 |
4.7 |
|
|
|
|
|
|
||||||||
|
|
|
|
|
|
|
|
|
Brazil |
|
|
BRL |
|
|
3.82 |
|
-1.8 |
-1.6 |
-15.08 |
|
3.70 |
3.60 |
3.60 |
3.39 |
3.71 |
-8.4 |
|
|
|
2.9 |
1.0 |
|
|
|
|
|
|
|||||||
|
|
|
|
|
|
|
|
|
Colombia |
|
COP |
|
|
3229 |
-1.9 |
-11.7 |
-8.18 |
|
3050 |
3000 |
2950 |
2605 |
3297 |
-12.2 |
|
|
|
1.6 |
0.6 |
|
|
|
|
|
|
|||||||||
|
|
|
|
|
|
|
|
|
Argentina |
|
ARS |
|
|
36.73 |
-2.0 |
-34.2 |
-95.11 |
|
38.00 |
45.00 |
48.00 |
-- |
-- |
-- |
|
|
|
42.3 |
-- |
|
|
|
|
|
|
|||||||||
7% |
|
|
|
|
|
|
|
Real FX Carry (12mo) |
|
|
|
|
|
100% |
|
20% |
|
|
Current Level vs GS Fair Value Metrics |
|
|
|
||||||||||||||||||||||
|
|
|
|
|
|
|
|
|
|
|
|
|
|
|
|
|
|
|
||||||||||||||||||||||||||
6% |
|
|
|
|
|
|
|
|
|
|
|
|
|
|
|
|
|
|
|
|
|
|
90% |
|
% overvalued vs |
|
|
|
|
|
|
|
|
|
|
|
|
Expensive |
|
|
||||
5% |
|
|
|
|
|
|
|
|
|
|
|
|
|
|
|
|
|
|
|
|
|
|
|
15% |
|
FEER |
|
|
|
|
|
|
|
|
INR |
|
|
|
|
|
||||
|
|
|
|
|
|
|
|
|
|
|
|
|
|
|
|
|
|
|
|
|
|
|
|
|
|
|
|
|
|
|
|
|
|
|
|
|
|
|
|
|||||
|
|
|
|
|
|
|
|
|
|
|
|
|
|
|
|
|
|
|
|
|
|
80% |
|
|
|
|
|
|
|
|
|
|
|
|
|
|
|
|
|
|
||||
4% |
|
|
|
|
|
|
|
|
|
|
|
|
|
|
|
%-ile vs History |
|
|
|
|
|
|
|
|
PLN |
CZK |
PHP |
|
|
|
|
|
||||||||||||
3% |
|
|
|
|
|
|
|
|
|
|
|
|
|
|
|
|
|
|
|
|
10% |
|
|
|
|
|
|
|
|
|
|
|||||||||||||
|
|
|
|
|
|
|
|
|
|
|
|
|
|
|
|
70% |
|
|
|
|
|
|
CLP |
|
|
|
|
|
||||||||||||||||
|
|
|
|
|
|
|
|
|
|
|
|
|
|
|
|
|
(RHS, Dots) |
|
|
|
|
|
|
|
|
HUF |
|
|
|
|
|
|
|
|
|
|||||||||
2% |
|
|
|
|
|
|
|
|
|
|
|
|
|
|
|
|
|
|
|
|
|
|
|
|
|
|
|
|
|
|
|
|
|
|
|
|
|
|
|
|||||
|
|
|
|
|
|
|
|
|
|
|
|
|
|
|
|
|
|
|
|
|
|
60% |
|
|
|
|
|
|
|
ZAR |
MYR |
IDR |
|
|
KRW |
|
|
|||||||
1% |
|
|
|
|
|
|
|
|
|
|
|
|
|
|
|
|
|
|
|
|
|
|
|
5% |
|
|
|
|
|
CNY |
|
|
|
|
|
|
||||||||
|
|
|
|
|
|
|
|
|
|
|
|
|
|
|
|
|
|
|
|
|
|
|
|
|
|
|
|
|
|
|
|
|
PEN |
|
THB |
|
|
|
||||||
0% |
|
|
|
|
|
|
|
|
|
|
|
|
|
|
|
|
|
|
|
|
|
|
|
50% |
|
|
|
|
|
|
|
COP |
|
|
|
|
|
|
||||||
|
|
Current |
|
|
|
|
|
|
|
|
|
|
|
|
|
|
|
|
|
|
|
|
|
|
|
|
|
|
|
|
|
|
|
|
|
|
||||||||
-1% |
|
|
|
|
|
|
|
|
|
|
|
|
|
|
|
|
|
|
|
|
|
|
|
0% |
|
|
|
|
|
|
|
|
|
|
|
|
|
|
|
|||||
|
|
|
|
|
|
|
|
|
|
|
|
|
|
|
|
|
|
|
40% |
|
|
|
|
|
|
|
|
|
|
|
|
|
|
|
|
|
|
|||||||
|
|
(Bars) |
|
|
|
|
|
|
|
|
|
|
|
|
|
|
|
|
|
|
|
|
|
|
|
|
|
|
|
|
|
|
|
|
|
|
|
|
||||||
|
|
|
|
|
|
|
|
|
|
|
|
|
|
|
|
|
|
|
|
|
|
|
|
|
|
|
|
|
|
|
|
|
|
|
|
|
|
|||||||
-2% |
|
|
|
|
|
|
|
|
|
|
|
|
|
|
|
|
|
|
|
|
|
|
|
|
|
|
|
|
|
|
|
|
|
|
|
|
|
|
|
|||||
|
|
|
|
|
|
|
|
|
|
|
|
|
|
|
|
|
|
|
|
|
|
30% |
|
|
|
|
|
|
|
|
|
|
|
BRL |
|
|
|
|
|
|
|
|||
-3% |
|
|
|
|
|
|
|
|
|
|
|
|
|
|
|
|
|
|
|
|
|
|
|
|
|
|
|
|
|
|
|
|
|
|
|
|
|
|
|
|
||||
|
|
|
|
|
|
|
|
|
|
|
|
|
|
|
|
|
|
|
|
|
|
|
-5% |
|
|
|
|
|
MXN |
|
|
|
|
|
|
|
|
|
|
|||||
-4% |
|
|
|
|
|
|
|
|
|
|
|
|
|
|
|
|
|
|
|
|
|
|
20% |
|
|
|
|
|
|
|
|
|
|
|
|
|
|
|
|
|
||||
|
|
|
|
|
|
|
|
|
|
|
|
|
|
|
|
|
|
|
|
|
|
|
|
|
|
|
|
|
|
|
|
|
RUB |
|
|
|
|
|
||||||
-5% |
|
|
|
|
|
|
|
|
|
|
|
|
|
|
|
|
|
|
|
|
|
|
|
|
|
-10% |
|
|
|
|
|
|
|
|
|
|
|
|
|
|
||||
|
|
|
|
|
|
|
|
|
|
|
|
|
|
|
|
|
|
|
|
|
|
10% |
|
|
|
|
|
|
|
|
|
|
|
|
|
|
|
|
|
|||||
-6% |
|
|
|
|
|
|
|
|
|
|
|
|
|
|
|
|
|
|
|
|
|
|
|
|
|
|
|
|
|
|
|
|
|
|
|
|
|
|
|
|||||
|
|
|
|
|
|
|
|
|
|
|
|
|
|
|
|
|
|
|
|
|
|
|
|
|
|
|
TRY |
|
|
|
|
|
|
|
|
|
|
% overvalued vs |
||||||
|
|
|
|
|
|
|
|
|
|
|
|
|
|
|
|
|
|
|
|
|
|
|
|
|
|
|
|
|
|
|
|
|
|
|
|
|
|
|
|
|||||
-7% |
|
|
|
|
|
|
|
|
|
|
|
|
|
|
|
|
|
|
|
|
|
|
0% |
|
-15% Inexpensive |
|
|
|
|
|
|
|
|
|
|
|
|
|||||||
|
MXN |
IDR |
TRY |
RUB |
ZAR |
INR |
|
PEN |
BRL |
COP |
PHP |
MYR |
CNY |
THB |
CLP |
PLN |
KRW |
CZK |
TWD |
|
|
|
|
|
|
|
|
|
|
|
|
|
|
DEER |
|
|
||||||||
|
|
|
HUF |
|
-50% |
-40% |
|
-30% |
-20% |
|
|
|
-10% |
0% |
|
10% |
20% |
|||||||||||||||||||||||||||
|
|
|
|
|
|
|
|
|
|
|
|
|
|
|
|
|
|
|
|
|
|
|
|
|
|
|
|
|
|
|
|
|||||||||||||
% Appreciation Forecasted
12% |
|
|
10% |
|
|
8% |
|
|
6% |
|
|
4% |
|
|
2% |
3mo |
12mo |
0% |
|
|
|
|
|
-2% |
|
|
-4% |
|
|
-6% |
|
|
-8%
COP |
CLP |
BRL |
MXN |
PEN |
CZK |
HUF |
MYR |
PLN |
CNY |
KRW |
PHP |
TWD |
RON |
ZAR |
THB |
IDR |
ARS |
TRY |
INR |
RUB |
3mo Return vs USD (%)
PHP
THB
EGP IDR TWD KRW BRL CNY
PEN
MYR
INR
PLN
HUF
RON
CZK CLP ZAR RUB
TRY MXN
COP
ARS
-36% |
-32% |
-28% |
-24% |
-20% |
-16% |
-12% |
-8% |
-4% |
0% |
4% |
Source: FactSet, Goldman Sachs Global Investment Research
26 November 2018 |
18 |
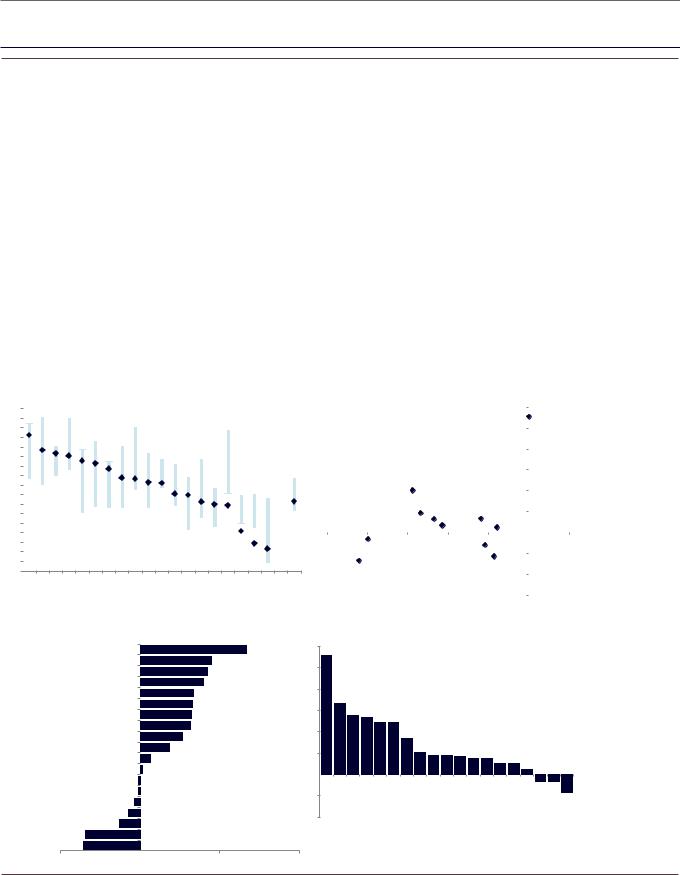
vk.com/id446425943
Goldman Sachs
EM Strategy Views
Equities Performance
|
|
Equities Performance (%) |
|
|
|
|
|
|
|
|
|
EPS (NTM %ch) |
|
|
|
|
||||||||||
|
|
|
Local |
|
|
|
USD |
|
|
|
P/E |
|
P/B |
|
D/Y |
|
|
Local |
|
|
|
USD |
|
|
EPS Growth |
|
|
wgt |
1w |
3m |
ytd |
|
1w |
3m |
ytd |
|
|
NTM |
|
LTM |
|
NTM |
|
1m |
3m |
12m |
|
1m |
3m |
12m |
|
2018E 2019E |
|
Philippines |
1.1% |
4.0 |
-4.3 |
-14.8 |
4.5 |
-3.1 |
-19.9 |
15.6 |
2.1 |
1.9 |
1.0 |
2.1 |
6.5 |
2.0 |
1.3 |
2.7 |
6.3 |
12.7 |
||||||||
Poland |
1.2% |
2.9 |
-3.7 |
-9.6 |
2.9 |
-7.2 |
-18.5 |
11.1 |
1.4 |
3.3 |
-0.3 |
0.5 |
1.2 |
-4.1 |
-4.1 |
-3.8 |
0.6 |
8.1 |
||||||||
Hungary |
0.3% |
-0.2 |
11.3 |
0.0 |
-0.8 |
7.7 |
-10.0 |
9.9 |
1.6 |
3.2 |
1.5 |
4.9 |
10.7 |
-1.5 |
0.3 |
3.2 |
-- |
-- |
||||||||
Indonesia |
2.2% |
-0.3 |
6.7 |
-7.2 |
0.2 |
5.9 |
-14.4 |
14.5 |
2.8 |
3.2 |
0.6 |
1.8 |
9.9 |
-1.4 |
-3.5 |
-1.9 |
8.5 |
12.4 |
||||||||
Malaysia |
2.4% |
-0.4 |
-5.7 |
-6.2 |
-0.4 |
-8.9 |
-9.8 |
15.3 |
1.7 |
3.4 |
0.1 |
-0.6 |
-0.8 |
-1.0 |
-3.5 |
0.3 |
9.5 |
3.7 |
||||||||
Thailand |
2.4% |
-0.8 |
-5.5 |
-5.3 |
-1.0 |
-4.9 |
-6.7 |
13.7 |
2.0 |
3.1 |
0.6 |
1.7 |
11.1 |
-1.9 |
2.0 |
11.3 |
6.9 |
5.1 |
||||||||
Turkey |
0.7% |
-0.8 |
-1.9 |
-19.7 |
0.2 |
-9.6 |
-59.2 |
5.8 |
1.0 |
5.8 |
-1.5 |
1.5 |
17.4 |
5.6 |
-11.1 |
-20.5 |
13.3 |
7.2 |
||||||||
Chile |
1.1% |
-0.9 |
-5.9 |
-9.5 |
-1.4 |
-11.3 |
-19.1 |
15.0 |
1.8 |
3.0 |
2.7 |
5.6 |
20.6 |
-2.7 |
-3.0 |
10.1 |
25.3 |
15.2 |
||||||||
Czech Rep |
0.2% |
-1.3 |
-3.6 |
1.4 |
-1.4 |
-8.1 |
-6.1 |
14.2 |
1.6 |
5.8 |
0.8 |
3.4 |
10.0 |
-2.3 |
-1.3 |
5.8 |
-- |
-- |
||||||||
India |
9.0% |
-1.7 |
-7.5 |
-3.1 |
-0.4 |
-10.9 |
-14.2 |
17.2 |
2.9 |
1.7 |
1.4 |
1.5 |
8.7 |
-0.6 |
-5.8 |
-4.8 |
8.0 |
18.7 |
||||||||
Russia |
3.8% |
-1.7 |
0.4 |
12.3 |
-2.3 |
-5.8 |
-2.9 |
5.3 |
0.9 |
7.3 |
2.7 |
11.2 |
42.2 |
2.3 |
5.5 |
26.2 |
58.8 |
2.7 |
||||||||
South Africa |
6.3% |
-1.7 |
-11.4 |
-17.8 |
-0.3 |
-17.2 |
-29.8 |
12.3 |
2.0 |
3.8 |
1.6 |
4.9 |
12.8 |
-2.7 |
-7.0 |
8.0 |
23.2 |
16.7 |
||||||||
China |
30.7% |
-1.8 |
-12.0 |
-13.0 |
-1.7 |
-13.7 |
-19.6 |
10.2 |
1.6 |
3.0 |
0.3 |
1.1 |
18.6 |
-1.0 |
-1.1 |
12.7 |
4.0 |
13.2 |
||||||||
Taiwan |
11.3% |
-2.1 |
-13.3 |
-9.5 |
-2.2 |
-14.3 |
-13.4 |
12.2 |
1.7 |
4.7 |
-1.8 |
-1.7 |
2.2 |
-3.1 |
-2.7 |
-0.4 |
1.3 |
1.2 |
||||||||
Korea |
13.9% |
-2.4 |
-11.0 |
-17.8 |
-2.5 |
-12.0 |
-23.4 |
7.2 |
0.9 |
2.8 |
0.1 |
-0.6 |
2.5 |
-2.6 |
-2.5 |
0.8 |
12.4 |
1.1 |
||||||||
Brazil |
7.5% |
-2.7 |
7.8 |
11.0 |
-4.5 |
6.2 |
-4.1 |
10.9 |
1.9 |
3.9 |
2.8 |
6.6 |
35.4 |
10.6 |
7.8 |
19.2 |
48.4 |
20.6 |
||||||||
Mexico |
2.6% |
-2.9 |
-17.6 |
-17.9 |
-3.8 |
-26.7 |
-22.0 |
12.6 |
2.0 |
2.9 |
2.1 |
1.7 |
7.1 |
-5.7 |
-6.3 |
1.2 |
12.4 |
17.3 |
||||||||
Colombia |
0.4% |
-4.3 |
-6.9 |
-2.6 |
-6.2 |
-18.6 |
-10.8 |
9.9 |
1.3 |
4.0 |
2.9 |
5.4 |
42.2 |
-5.1 |
-5.5 |
34.3 |
-- |
-- |
||||||||
Peru |
0.4% |
-5.3 |
-6.6 |
1.5 |
-5.3 |
-9.8 |
-2.8 |
12.7 |
2.4 |
2.8 |
1.9 |
1.0 |
14.0 |
-0.2 |
-1.8 |
9.9 |
-- |
-- |
||||||||
MSCI EM |
-- |
-1.7 |
-9.4 |
-11.9 |
-1.7 |
-10.9 |
-16.3 |
10.3 |
1.5 |
3.4 |
0.4 |
1.3 |
11.1 |
-0.7 |
-1.3 |
6.7 |
14.1 |
8.9 |
||||||||
PE Ratios
20 |
|
|
|
|
|
|
|
|
|
|
|
|
|
|
|
|
|
|
|
|
|
|
|
|
|
|
|
|
|
|
|
|
|
|
|
|
|
|
|
|
|
|
|
|
|
|
|
|
|
|
|
|
|
|
|
|
|
|
|
|
|
|
|
|
|
|
|
|
|
|
|
|
|
|
|
|
|
|
|
|
|
|
|
|
|
19 |
|
|
17.2 |
|
|
|
|
|
|
|
|
|
|
|
|
|
|
|
|
|
|
|
|
|
|
|
|
|
|
|
|
|
|
|
|
|
|
|
|
|
|
|
|
|
|
|
|
|
|
|
|
|
|
|
|
|
|
|
|
|
|
|
|
|
|
|
|
|
|
|
|
|
|
|
|
|
|
|
|
|
|
|
|
||
18 |
|
|
|
|
|
|
|
|
|
|
|
|
|
|
|
|
|
|
|
|
|
|
|
|
|
|
|
|
|
|
|
|
|
|
|
|
|
|
|
|
|
|
|
|
|
|
|
|
|
|
|
|
|
|
|
|
|
|
|
|
|
|
|
|
|
|
|
|
|
|
|
|
|
|
|
|
|
|
|
|
|
|
|
||
17 |
|
15.6 |
15.3 |
|
|
|
|
|
|
|
|
|
|
|
|
|
|
|
|
|
|
|
|
|
|
|
|
|
|
|
|
|
|
|
|
|
|
|
||||
16 |
|
15.0 |
14.5 |
14.2 |
|
|
|
|
|
|
|
|
|
|
|
|
|
|
|
|
|
|
|
|
|
|
|
|
|
|
|
|
||||||||||
|
|
|
|
|
|
|
|
|
|
|
|
|
|
|
|
|
|
|
|
|
|
|
|
|
|
|
|
|
|
|
|
|
|
|
||||||||
15 |
|
|
13.7 |
|
|
|
|
|
|
|
|
|
|
|
|
|
|
|
|
|
|
|
|
|
|
|
|
|
|
|
||||||||||||
|
|
|
|
|
|
|
|
|
|
|
|
|
|
|
|
|
|
|
|
|
|
|
|
|
|
|
|
|
|
|
|
|
|
|
|
|
||||||
14 |
|
|
|
|
|
|
|
|
|
12.7 12.6 12.3 12.2 |
|
|
|
|
|
|
|
|
|
|
|
|
Current |
|||||||||||||||||||
|
|
|
|
|
|
|
|
|
|
|
|
|
|
|
|
|
|
|
|
|
||||||||||||||||||||||
13 |
|
|
|
|
|
|
|
|
|
|
|
|
|
|
|
|
|
|
|
|||||||||||||||||||||||
|
|
|
|
|
|
|
||||||||||||||||||||||||||||||||||||
12 |
|
|
|
|
|
|
|
11.1 10.9 |
|
|
|
|
|
|
|
(Diamonds) |
||||||||||||||||||||||||||
|
|
|
|
|
||||||||||||||||||||||||||||||||||||||
11 |
|
|
|
|
|
|
|
|
|
|
|
|
|
|
|
|
|
|
|
10.2 |
9.9 |
9.9 |
|
|
|
|
|
|
|
|
||||||||||||
|
|
|
|
|
|
|
|
|
|
|
|
|
|
|
|
|
|
|
|
|
|
|
|
|
|
|
||||||||||||||||
10 |
|
|
|
|
|
|
|
|
|
|
|
|
|
|
|
|
|
|
|
|
|
|
|
|
|
|
|
|
|
|
|
|
|
|
|
|
|
|
|
|
|
|
9 |
|
|
|
|
|
|
|
|
|
|
|
|
|
|
|
|
|
|
|
|
|
|
|
|
|
|
|
|
|
|
|
|
|
|
|
7.2 |
|
|
|
|
|
|
|
|
|
|
|
|
|
|
|
|
|
|
|
|
|
|
|
|
|
|
|
|
|
|
|
|
|
|
|
|
|
|
|
|
|
|
|
|
|
|
|
||
8 |
|
|
|
|
|
|
|
|
|
|
|
|
|
|
|
|
|
|
|
|
|
|
|
|
|
|
|
|
|
|
|
|
|
|
|
|
|
|
|
|
||
7 |
|
|
|
|
|
|
|
|
|
|
|
|
|
|
|
|
|
|
|
|
|
|
|
|
|
|
|
|
|
|
|
|
|
5.8 |
|
|
|
|||||
|
|
|
|
|
|
|
|
|
|
|
10th-90th percentile |
|
|
|
5.3 |
|||||||||||||||||||||||||||
6 |
|
|
|
|
|
|
|
|
|
|
|
|
|
|
|
(Bars) |
|
|
|
|
|
|
|
|
|
|
|
|
||||||||||||||
5 |
|
|
|
|
|
|
|
|
|
|
|
|
|
|
|
|
|
|
|
|
|
|
|
|
|
|
|
|||||||||||||||
|
|
|
|
|
|
|
|
|
|
|
|
|
|
|
|
|
|
|
|
|
|
|
|
|
|
|
|
|
|
|
|
|
|
|
|
|
|
|
|
|
|
|
4 |
|
|
|
|
|
|
|
|
|
|
|
|
|
|
|
|
|
|
|
|
|
|
|
|
|
|
|
|
|
|
|
|
|
|
|
|
|
|
|
|
|
|
|
|
|
|
|
|
|
|
|
|
|
|
|
|
|
|
|
|
|
|
|
|
|
|
|
|
|
|
|
|
|
|
|
|
|
|
|
|
|
|
|
|
|
3 |
|
India Philippines Malaysia Chile Indonesia Czech Rep Thailand Peru Mexico South Africa Taiwan Poland Brazil China |
Hungary |
Colombia Korea Turkey |
Russia |
|||||||||||||||||||||||||||||||||||||
|
||||||||||||||||||||||||||||||||||||||||||
|
|
|||||||||||||||||||||||||||||||||||||||||
MSCI Sector Performance and Earnings
|
|
|
12% |
|
3mo |
|
|
|
|
|
|
|
|
|
|
|
Performance |
|
|
|
|
|
Energy |
||
|
|
|
10% |
|
(LOC) |
|
|
|
|
|
|
|
|
|
|
8% |
|
|
|
|
|
|
|
|
|
|
|
|
6% |
|
|
|
|
|
|
|
|
|
|
|
|
4% |
|
|
|
Materials |
|
|
|
|
|
10.3 |
|
|
|
|
|
|
|
|
||||
|
|
|
2% |
|
|
|
Health |
|
|
|
|
|
|
|
|
|
|
|
EM |
Indu |
|
|
|
|
|
|
|
|
|
|
|
|
|
|
|
|
||
|
|
|
|
|
|
|
Con Stap |
|
|
|
|
|
|
|
|
0% |
|
|
|
Finls |
|
|
|
|
|
|
|
|
|
Con Disc |
|
Utilities |
|
|
|
|
||
|
|
|
|
|
|
|
|
|
|
|||
|
|
|
-2% |
|
|
|
|
|
|
|
|
|
|
|
|
|
Info Tech |
|
|
Telecom |
|
|
|
||
|
|
|
|
|
|
|
|
|
|
|||
|
|
|
|
|
|
|
|
|
|
|
|
|
EM |
-4% |
|
|
|
EPS 3mo Chg |
|
|
|
||||
|
|
|
|
|
|
|
||||||
MSCI |
-6% |
|
|
|
|
(LOC) |
|
|
|
|
||
|
|
|
|
|
|
|
||||||
-20% |
-16% |
-12% |
-8% |
-4% |
0% |
4% |
||||||
Combined Valuation Metrics
Russia |
|
|
Malaysia |
|
|
Brazil |
|
|
Indonesia |
|
|
Hungary |
|
|
Thailand |
|
|
Czech Rep |
|
|
India |
|
|
Mexico |
|
|
South Africa |
|
|
Turkey |
|
|
Taiwan |
|
|
Chile |
|
|
Philippines |
|
|
Korea |
|
Average Z-Score of PBK, PE |
China |
|
and Div Yld |
Peru |
|
|
Poland |
|
|
Colombia |
|
|
-0.5 |
0 |
0.5 |
1
3mo Change in EPS (Local Currency, %)
12 11.2
10
8
6.6
65.6 5.4 4.9 4.9
43.4
2 |
|
2.1 1.8 1.7 1.7 1.5 1.5 |
1.1 1.0 0.5 |
|
|
|
|
0 |
|
|
|
|
|
-0.6-0.6 |
|
-2 |
|
|
|
|
|
-1.7 |
|
|
|
|
|
-4 |
Russia Brazil |
Chile Colombia Hungary South Africa Czech Rep Philippines Indonesia Mexico Thailand India Turkey China Peru Poland Korea Malaysia Taiwan |
|
|
|||
Source: FactSet, I/B/E/S, Goldman Sachs Global Investment Research
26 November 2018 |
19 |
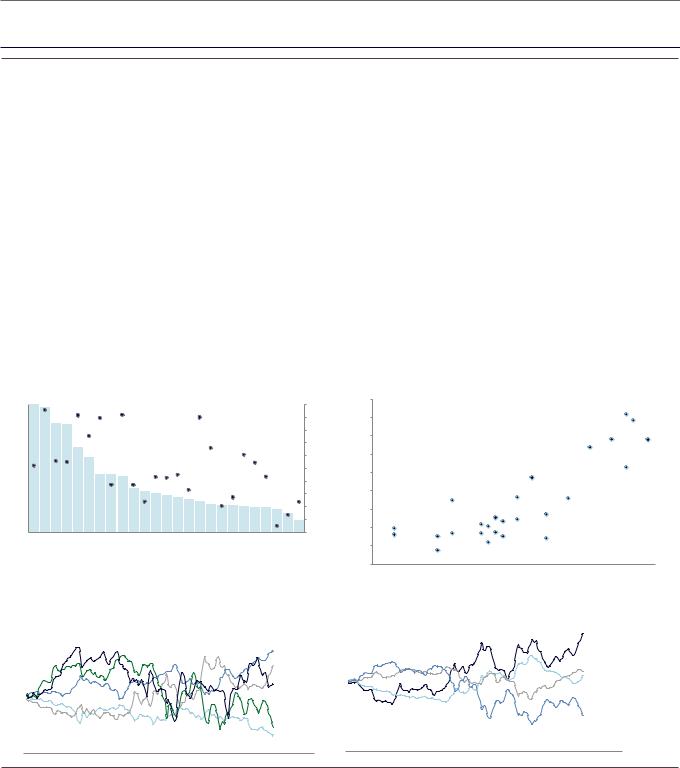
vk.com/id446425943
Goldman Sachs
Performance of Select EMBI Countries
EM Strategy Views
|
|
Returns (%) |
|
|
|
Spread |
|
|
Returns (%) |
|
|
|
Spread |
|
|||||||
|
Wgt |
1wk |
3m |
YTD |
|
1wk |
3m |
YTD |
Level |
%ile/hist |
|
1wk |
|
3m |
YTD |
Wgt |
1wk |
3m |
YTD |
Level |
%ile/hist |
India |
2.3% |
0.3 |
-0.3 |
-1.4 |
-1 |
19 |
63 |
173 |
66% |
Asia |
-0.1 |
|
-1.9 |
-3.6 |
19.3% |
6 |
32 |
66 |
229 |
52% |
|
Philippines |
3.4% |
0.2 |
-1.4 |
-3.4 |
2 |
5 |
19 |
118 |
13% |
Europe |
-0.6 |
|
-0.2 |
-4.0 |
25.9% |
17 |
14 |
98 |
308 |
54% |
|
Malaysia |
2.7% |
0.1 |
-0.7 |
-2.2 |
5 |
13 |
39 |
153 |
43% |
Latam |
-0.8 |
|
-3.2 |
-7.6 |
38.2% |
16 |
42 |
109 |
452 |
60% |
|
China |
4.3% |
0.0 |
-0.3 |
-0.9 |
3 |
7 |
40 |
195 |
90% |
Mid. East |
-0.8 |
|
-2.5 |
-6.0 |
6.1% |
19 |
62 |
150 |
530 |
82% |
|
Uruguay |
1.7% |
0.0 |
-5.3 |
-8.0 |
3 |
33 |
58 |
206 |
33% |
Africa |
-1.6 |
|
-3.8 |
-8.7 |
10.5% |
31 |
71 |
193 |
533 |
76% |
|
Hungary |
2.9% |
0.0 |
-0.3 |
-2.0 |
4 |
18 |
62 |
153 |
54% |
|
|
|
|
|
|
|
|
|
|
|
|
Croatia |
0.8% |
-0.0 |
0.3 |
-0.1 |
5 |
6 |
36 |
141 |
5% |
A |
0.0 |
|
-0.6 |
-1.9 |
12.4% |
4 |
11 |
33 |
125 |
32% |
|
Peru |
3.1% |
-0.0 |
-2.6 |
-4.9 |
4 |
15 |
28 |
167 |
27% |
BBB |
-0.3 |
|
-2.9 |
-5.2 |
35.7% |
8 |
29 |
59 |
235 |
75% |
|
Indonesia |
4.3% |
-0.0 |
-3.5 |
-5.9 |
5 |
34 |
61 |
232 |
42% |
BB |
-0.7 |
|
-0.7 |
-5.5 |
23.3% |
16 |
13 |
108 |
349 |
76% |
|
Russia |
3.7% |
-0.1 |
0.2 |
-3.9 |
6 |
-8 |
61 |
244 |
43% |
B |
-1.5 |
|
-2.8 |
-9.1 |
24.6% |
33 |
69 |
219 |
601 |
71% |
|
Poland |
2.7% |
-0.1 |
0.1 |
-0.8 |
6 |
5 |
27 |
75 |
24% |
|
|
|
|
|
|
|
|
|
|
|
|
Panama |
2.9% |
-0.2 |
-2.9 |
-5.0 |
6 |
27 |
46 |
167 |
20% |
IG |
-0.2 |
|
-2.4 |
-4.4 |
51.9% |
8 |
25 |
61 |
217 |
74% |
|
Chile |
2.8% |
-0.2 |
-2.1 |
-5.1 |
6 |
15 |
36 |
160 |
61% |
HY |
-1.2 |
|
-2.1 |
-7.7 |
48.1% |
28 |
52 |
207 |
609 |
86% |
|
Colombia |
3.0% |
-0.4 |
-4.0 |
-4.9 |
8 |
34 |
40 |
218 |
45% |
|
|
|
|
|
|
|
|
|
|
|
|
South Africa |
2.7% |
-0.4 |
-2.9 |
-5.2 |
11 |
43 |
106 |
363 |
89% |
EMBI Composites |
|
|
|
|
|
|
|
|
|
||
Brazil |
3.4% |
-0.4 |
3.4 |
-1.9 |
11 |
-34 |
36 |
271 |
37% |
Plus |
-0.6 |
|
-1.4 |
-7.2 |
--- |
14 |
17 |
108 |
432 |
68% |
|
Dominican Rep. |
2.4% |
-0.9 |
-2.2 |
-5.4 |
16 |
24 |
81 |
359 |
37% |
Global Div |
-0.7 |
|
-2.2 |
-6.0 |
--- |
17 |
39 |
122 |
398 |
63% |
|
Mexico |
5.2% |
-0.9 |
-6.6 |
-8.9 |
15 |
71 |
102 |
347 |
92% |
Global |
-0.7 |
|
-2.2 |
-6.4 |
--- |
16 |
37 |
118 |
423 |
66% |
|
Lebanon |
2.7% |
-1.1 |
-3.3 |
-9.6 |
30 |
106 |
304 |
783 |
95% |
|
|
|
|
|
|
|
|
|
|
|
|
Ukraine |
2.6% |
-1.2 |
-3.2 |
-5.6 |
35 |
94 |
226 |
678 |
55% |
|
|
|
|
|
|
|
|
|
|
|
|
Turkey |
3.9% |
-1.4 |
3.9 |
-10.6 |
27 |
-62 |
177 |
471 |
75% |
|
|
|
|
|
|
|
|
|
|
|
|
Egypt |
2.0% |
-1.5 |
-3.1 |
-7.0 |
28 |
40 |
136 |
529 |
91% |
|
|
|
|
|
|
|
|
|
|
|
|
Argentina |
3.4% |
-1.6 |
1.1 |
-18.5 |
32 |
1 |
335 |
680 |
56% |
|
|
|
|
|
|
|
|
|
|
|
|
Kazakhstan |
2.7% |
-1.7 |
-2.8 |
-4.2 |
24 |
24 |
56 |
252 |
24% |
|
|
|
|
|
|
|
|
|
|
|
|
Ecuador |
1.9% |
-1.9 |
-3.6 |
-11.0 |
54 |
106 |
362 |
816 |
52% |
|
|
|
|
|
|
|
|
|
|
|
|
Venezuela |
1.5% |
-2.7 |
-11.5 |
-18.9 |
263 |
832 |
1362 |
6185 |
100% |
|
|
Green = Cheap, Red = Expensive as %ile vs history |
|
|
|||||||
800 |
EMBI Spread by Country |
100% |
|
|
Current |
90% |
|
700 |
|
||
|
|
||
600 |
Percentile Rank |
80% |
|
70% |
|||
|
vs. History |
||
500 |
(RHS) |
60% |
|
|
|
||
400 |
|
50% |
|
300 |
|
40% |
|
|
|
||
200 |
|
30% |
|
|
20% |
||
|
|
||
100 |
|
10% |
|
|
|
||
0 |
|
0% |
Ecuador |
Lebanon |
Argentina |
Ukraine |
Egypt |
Turkey |
South Africa |
Dominican Rep. |
Mexico |
Brazil |
Kazakhstan |
Russia |
Indonesia |
Colombia |
Uruguay |
China |
India |
Panama |
Peru |
Chile |
Hungary |
Malaysia |
Croatia |
Philippines |
Poland |
104 |
Regional Relative Performance vs EMBI |
104 |
|
||
103 |
|
103 |
|
|
|
102 |
Europe |
102 |
|
||
|
Mid East 101 |
|
101 |
Asia |
100 |
|
Africa |
|
|
99 |
|
100 |
|
|
Spread (bps) |
Spreads vs Avg Sovereign Ratings |
900 |
|
|
ECU |
800 |
LBP |
700 |
LKR ARS |
UAH
600
500 |
|
|
|
|
|
|
TRY |
|
|
|
EGP |
|
400 |
|
|
MXN |
|
|
ZAR |
|
|
|
|
|
|
|
|
|
|
|
|
|
|
DOP |
|
|
|
|
|
|
|
|
|
|
|
|
BRL |
|
|
|
|
300 |
|
|
|
|
KZT |
RUB |
|
|
|
|
||
|
|
|
|
COP |
|
|
|
|
|
|||
200 |
CNY |
|
PEN |
IDR |
|
|
|
|
|
|
||
|
PAB |
UYU |
INR |
HRK |
|
|
|
|
||||
|
CLP |
MYR |
HUF |
|
|
|
|
|||||
100 |
|
|
|
|
|
|
|
|
|
|
|
|
|
|
PLN |
|
PHP |
|
|
|
|
|
|
||
|
|
|
|
|
|
|
|
|
|
|
|
|
0 |
|
BBB+ |
|
BBB- |
|
|
|
|
|
|
CCC+ |
|
A |
A- |
BBB |
BB+ |
BB |
BB- |
B+ |
B |
B- |
CCC |
|||
Ratings Relative Performance vs EMBI
A
BBB
BB
99 |
|
|
|
|
|
|
|
|
|
|
|
|
|
98 |
|
|
|
|
|
|
|
|
|
|
|
|
B |
|
|
|
|
|
|
|
|
|
|
|
|
Latam |
97 |
|
|
|
|
|
|
|
|
|
|
|
|
|
|
98 |
|
|
|
|
|
|
|
|
|
|
|
|
|
|
|
|
|
|
|
|
|
|
|
|
|
||
|
|
|
|
|
|
|
|
|
|
|
|
|
96 |
|
|
|
|
|
|
|
|
|
|
|
|
|
|
|
|
|
|
|
|
|
|
|
|
|
|
|
|
|
|
|
|
|
|
|
|
|
|
|
|
|
|
97 |
|
|
|
|
|
|
|
|
|
|
|
|
|
95 |
17 |
18 |
18 |
18 |
18 |
18 |
18 |
18 |
18 |
18 |
18 |
18 |
18 |
7 |
7 |
8 |
8 |
8 |
8 |
8 |
8 |
8 |
8 |
8 |
8 |
8 |
8 |
17 |
Source: Datastream, Goldman Sachs Global Investment Research
26 November 2018 |
20 |